Note
Go to the end to download the full example code.
Seed demonstration
from datetime import datetime, timedelta
import numpy as np
from opendrift import test_data_folder as tdf
from opendrift.models.oceandrift import OceanDrift
from opendrift.models.openoil import OpenOil

o = OceanDrift(loglevel=50)

time=datetime(2016, 1, 20, 12, 30, 0)
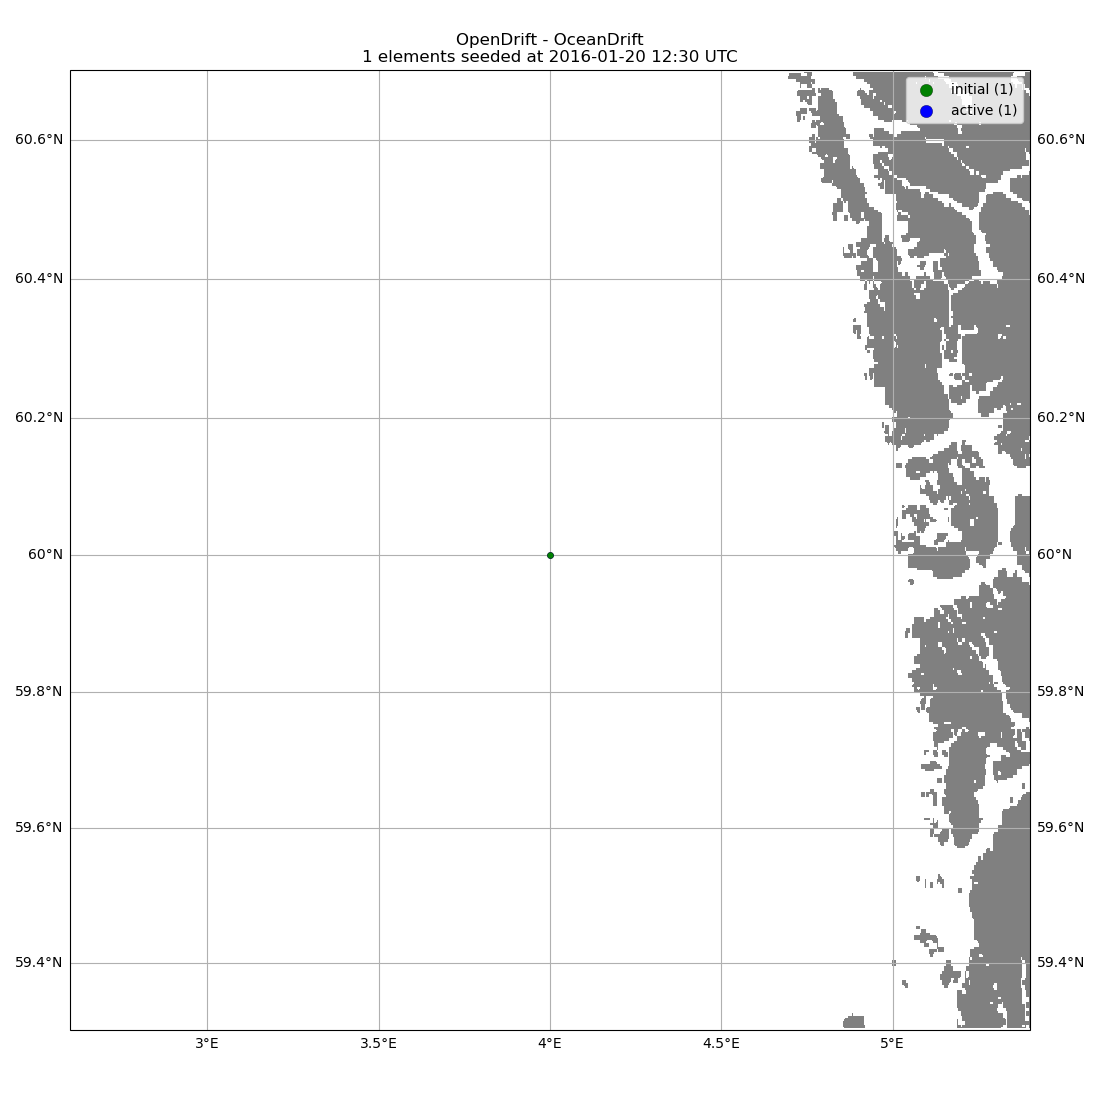
Seeding a single element at a point
print('\n' + '='*70)
print('Seeding a single element at a point:')
print('o.seed_elements(lon=4, lat=60, time=time)')
print('='*70)
o.seed_elements(lon=4, lat=60, time=time)
#o.run(steps=1)
o.plot(buffer=.7, fast=True)
======================================================================
Seeding a single element at a point:
o.seed_elements(lon=4, lat=60, time=time)
======================================================================

(<GeoAxes: title={'center': 'OpenDrift - OceanDrift\n1 elements seeded at 2016-01-20 12:30 UTC'}>, <Figure size 1100x1100 with 1 Axes>)
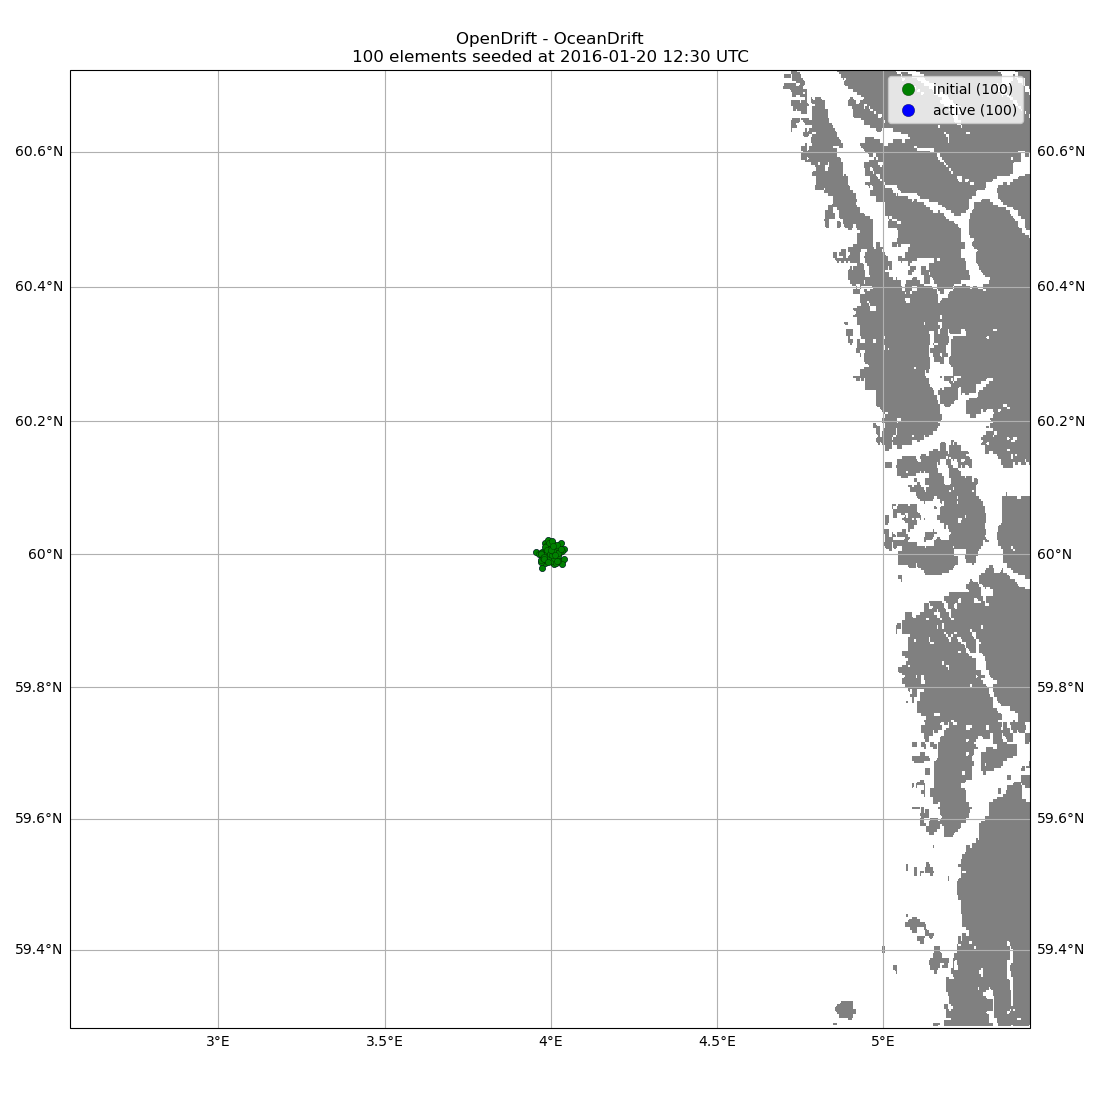
Seeding 100 elements within a radius of 1000 m
o = OceanDrift(loglevel=50)
print('\n' + '='*70)
print('Seeding 100 elements within a radius of 1000 m:')
print('o.seed_elements(lon=4, lat=60, number=100, radius=1000, time=time)')
print('='*70)
o.seed_elements(lon=4, lat=60, number=100, radius=1000, time=time)
#o.run(steps=1)
o.plot(buffer=.7, fast=True)
======================================================================
Seeding 100 elements within a radius of 1000 m:
o.seed_elements(lon=4, lat=60, number=100, radius=1000, time=time)
======================================================================

(<GeoAxes: title={'center': 'OpenDrift - OceanDrift\n100 elements seeded at 2016-01-20 12:30 UTC'}>, <Figure size 1100x1098.6 with 1 Axes>)
Seeding 100 elements within a radius of 1000 m and specifying a property (here z/depth) as an array
print('\n' + '='*70)
print('Seeding 100 elements within a radius of 1000 m\n and specifying a property (here z/depth) as an array:')
print('o.seed_elements(lon=4, lat=60, number=100, radius=1000, time=time, z=z)')
print('='*70)
o = OceanDrift(loglevel=50)
z = np.linspace(0, -50, 100)  # Linearly increasing depth
o.set_config('environment:fallback:y_sea_water_velocity', 3)  # Adding some current to be able to visualise depth as color of trajectories
o.seed_elements(lon=4, lat=60, number=100, radius=1000, time=time, z=z)
o.run(steps=1)
o.plot(linecolor='z', buffer=.7, fast=True)
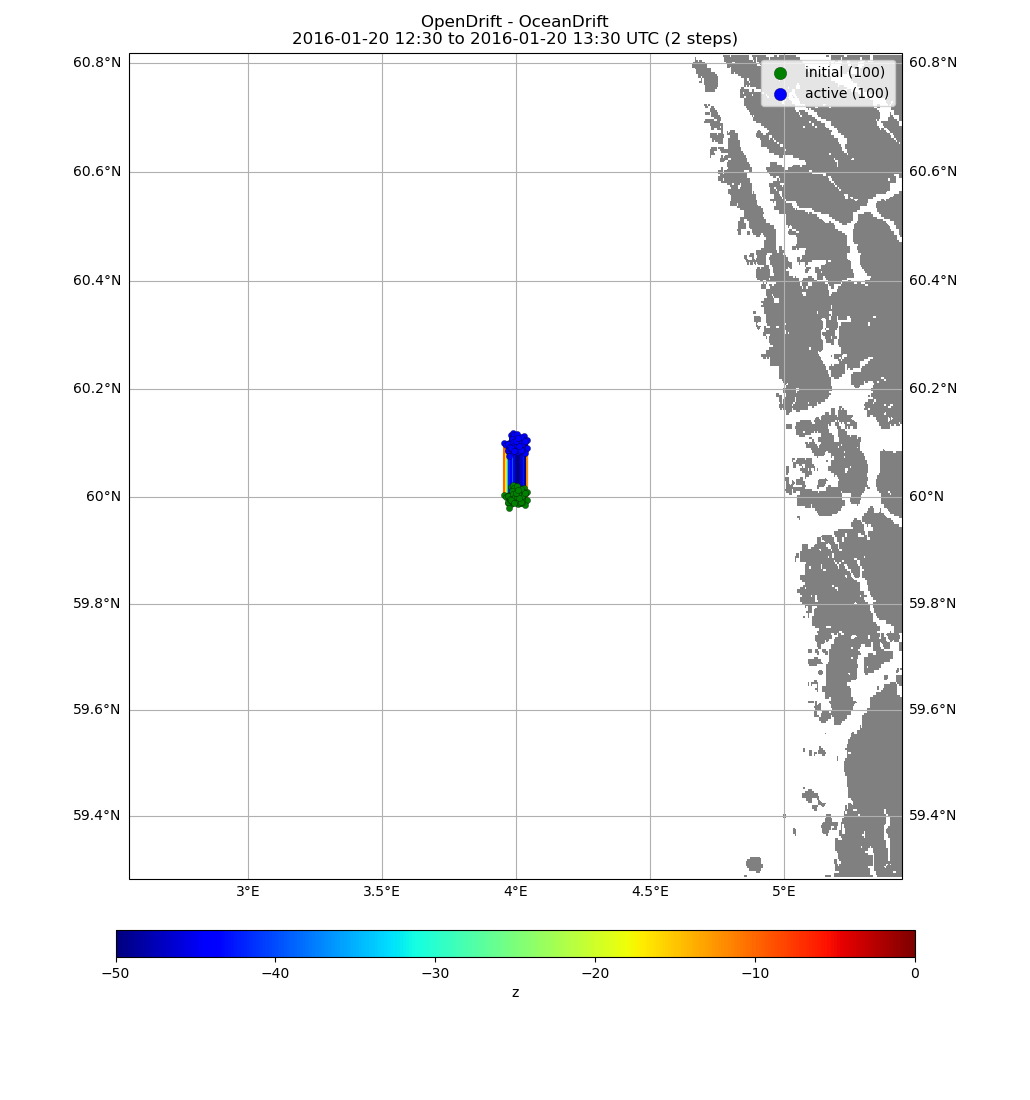
======================================================================
Seeding 100 elements within a radius of 1000 m
 and specifying a property (here z/depth) as an array:
o.seed_elements(lon=4, lat=60, number=100, radius=1000, time=time, z=z)
======================================================================

(<GeoAxes: title={'center': 'OpenDrift - OceanDrift\n2016-01-20 12:30 to 2016-01-20 13:30 UTC (2 steps)'}>, <Figure size 1030.48x1100 with 2 Axes>)
Seeding 100 elements at user defined locations (here along line between two points)
print('\n' + '='*70)
print('Seeding 100 elements at user defined locations\n (here along line between two points):')
print('lats = np.linspace(60, 61, 100)\n' \
      'lons = np.linspace(4, 4.8, 100)\n' \
      'o.seed_elements(lon=lons, lat=lats, time=time)')
print('='*70)
o = OceanDrift(loglevel=50)
lats = np.linspace(60, 61, 100)
lons = np.linspace(4, 4.8, 100)
o.seed_elements(lon=lons, lat=lats, time=time)
o.run(steps=1)
o.plot(buffer=.2, fast=True)
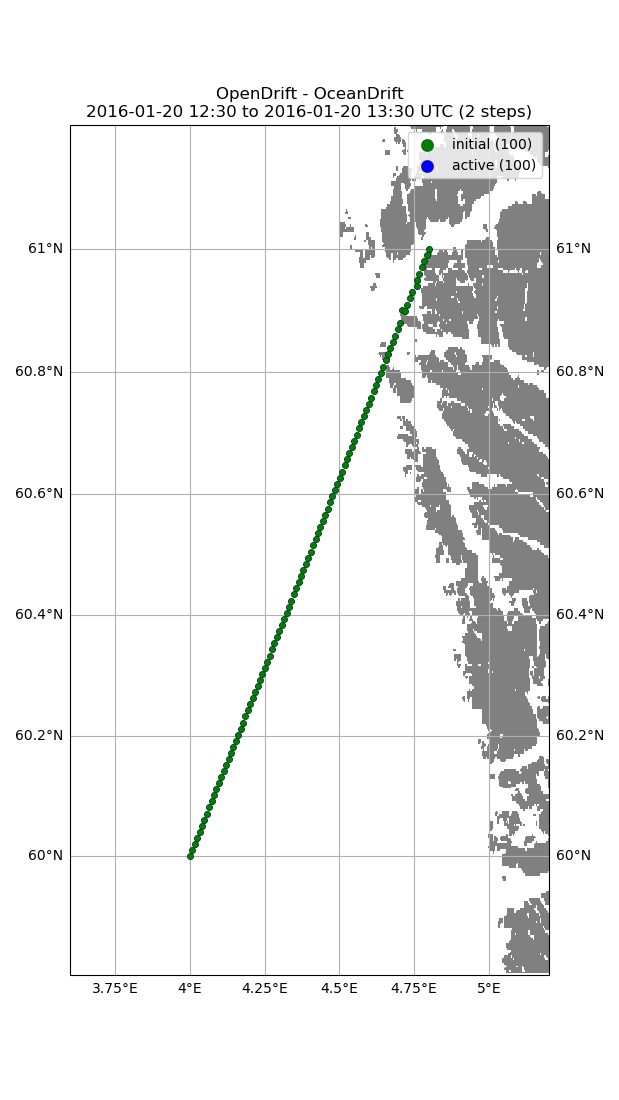
======================================================================
Seeding 100 elements at user defined locations
 (here along line between two points):
lats = np.linspace(60, 61, 100)
lons = np.linspace(4, 4.8, 100)
o.seed_elements(lon=lons, lat=lats, time=time)
======================================================================

(<GeoAxes: title={'center': 'OpenDrift - OceanDrift\n2016-01-20 12:30 to 2016-01-20 13:30 UTC (2 steps)'}>, <Figure size 619.046x1100 with 1 Axes>)
Seeding 100 elements between two points with seed_cone() (achieving the same as previous example)
print('\n' + '='*70)
print('Seeding 100 elements between two points with seed_cone() (achieving the same as previous example):')
print('o.seed_cone(lon=[4, 4.8], lat=[60, 61], number=100, time=time)')
print('='*70)
o = OceanDrift(loglevel=50)
o.seed_cone(lon=[4, 4.8], lat=[60, 61], number=100, time=time)
o.run(steps=1)
o.plot(buffer=.2, fast=True)
======================================================================
Seeding 100 elements between two points with seed_cone() (achieving the same as previous example):
o.seed_cone(lon=[4, 4.8], lat=[60, 61], number=100, time=time)
======================================================================

(<GeoAxes: title={'center': 'OpenDrift - OceanDrift\n2016-01-20 12:30 to 2016-01-20 13:30 UTC (2 steps)'}>, <Figure size 621.707x1100 with 1 Axes>)
Seeding 1000 elements along cone with radius/uncertainty increasing linearly from 0 to 5000 m
print('\n' + '='*70)
print('Seeding 1000 elements along cone with radius/uncertainty\n increasing linearly from 0 to 5000 m:')
print('o.seed_cone(lon=[4, 4.8], lat=[60, 61], number=1000, radius=[0, 5000], time=time)')
print('='*70)
o = OceanDrift(loglevel=50)
o.seed_cone(lon=[4, 4.8], lat=[60, 61], number=1000, radius=[0, 5000], time=time)
o.run(steps=1)
o.plot(buffer=.2, fast=True)
======================================================================
Seeding 1000 elements along cone with radius/uncertainty
 increasing linearly from 0 to 5000 m:
o.seed_cone(lon=[4, 4.8], lat=[60, 61], number=1000, radius=[0, 5000], time=time)
======================================================================

(<GeoAxes: title={'center': 'OpenDrift - OceanDrift\n2016-01-20 12:30 to 2016-01-20 13:30 UTC (2 steps)'}>, <Figure size 676.734x1100 with 1 Axes>)
If specifying time as a two element list (start and end, here +5 hours), elements are seeded linearly in time
print('\n' + '='*70)
print('If specifying time as a two element list (start and end,\n here +5 hours), elements are seeded linearly in time:')
print('o.seed_cone(lon=[4, 4.8], lat=[60, 61], number=1000, radius=[0, 5000], time=[time, time+timedelta(hours=5)])')
print('='*70)
o = OceanDrift(loglevel=50)
o.seed_cone(lon=[4, 4.8], lat=[60, 61], number=1000, radius=[0, 5000], time=[time, time+timedelta(hours=5)])
o.run(steps=5*4, time_step=900)
o.animation(fast=True)
======================================================================
If specifying time as a two element list (start and end,
 here +5 hours), elements are seeded linearly in time:
o.seed_cone(lon=[4, 4.8], lat=[60, 61], number=1000, radius=[0, 5000], time=[time, time+timedelta(hours=5)])
======================================================================
print('\n' + '='*70)
print('Any model/module may provide specialised seeding-functions, such as \n seeding oil within contours read from a GML file:')
print('o.seed_from_gml(tdf + "radarsat_oil_satellite_observation/RS2_20151116_002619_0127_SCNB_HH_SGF_433012_9730_12182143_Oil.gml", num_elements=2000)')
print('='*70)
o = OpenOil(loglevel=50)
o.set_config('environment:fallback:x_wind', 0)
o.set_config('environment:fallback:y_wind', 0)
o.set_config('environment:fallback:x_sea_water_velocity', 0)
o.set_config('environment:fallback:y_sea_water_velocity', 0)
o.seed_from_gml(tdf + 'radarsat_oil_satellite_observation/RS2_20151116_002619_0127_SCNB_HH_SGF_433012_9730_12182143_Oil.gml', num_elements=2000)
o.run(steps=1, time_step=1800, time_step_output=1800)
o.plot(buffer=.03, fast=True)
======================================================================
Any model/module may provide specialised seeding-functions, such as
 seeding oil within contours read from a GML file:
o.seed_from_gml(tdf + "radarsat_oil_satellite_observation/RS2_20151116_002619_0127_SCNB_HH_SGF_433012_9730_12182143_Oil.gml", num_elements=2000)
======================================================================

(<GeoAxes: title={'center': 'OpenDrift - OpenOil (GENERIC BUNKER C)\n2015-11-16 00:26 to 2015-11-16 00:56 UTC (2 steps)'}>, <Figure size 958.051x1100 with 1 Axes>)
Total running time of the script: (0 minutes 35.768 seconds)