Note
Go to the end to download the full example code.
Comparing oil budgets
from datetime import datetime, timedelta
import numpy as np
import matplotlib.pyplot as plt
from opendrift.models.openoil import OpenOil
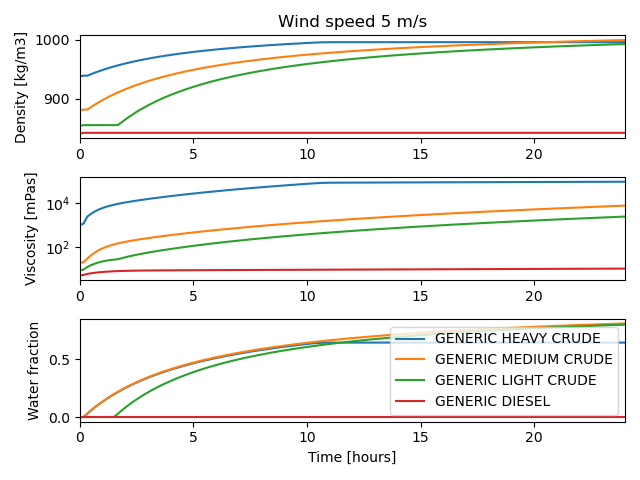
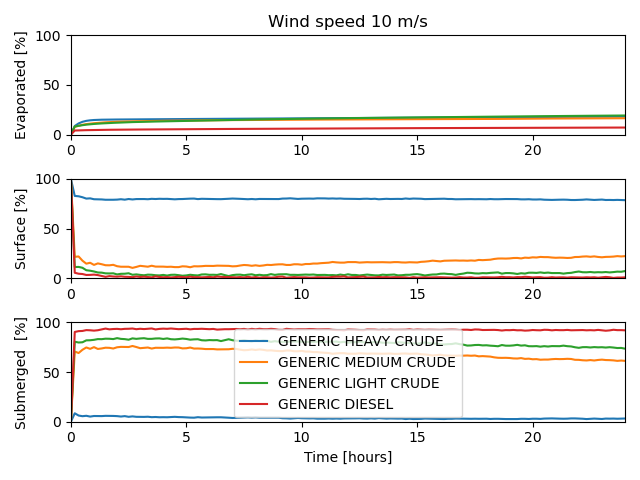
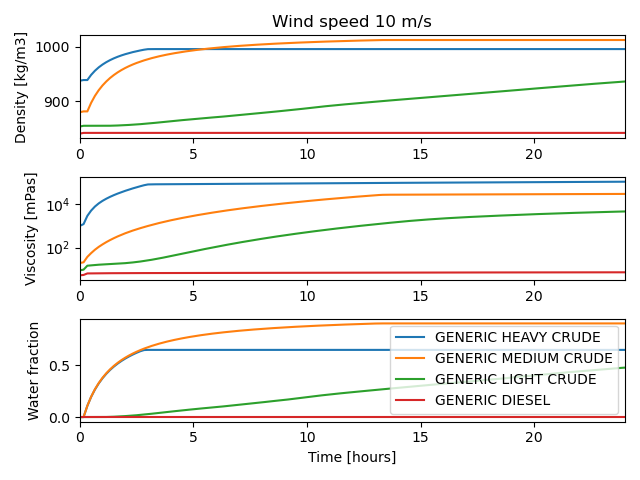
Comparing the weathering and properties of different oils at different wind speeds
oiltypes = ['GENERIC HEAVY CRUDE', 'GENERIC MEDIUM CRUDE', 'GENERIC LIGHT CRUDE',
            'GENERIC DIESEL']
wind_speeds = [5, 10]
hours = 24
b = {}
viscosities = {}
densities = {}
water_fractions = {}

for wind_speed in wind_speeds:
    for ot in oiltypes:
        o = OpenOil(loglevel=50)
        print('%s m/s - %s' % (wind_speed, ot))
        o.set_config('environment:constant:x_wind', wind_speed)
        o.set_config('environment:constant:y_wind', 0)
        o.set_config('environment:constant:x_sea_water_velocity', 0)
        o.set_config('environment:constant:y_sea_water_velocity', 0)
        o.set_config('environment:constant:land_binary_mask', 0)
        o.set_config('general:use_auto_landmask', False)
        o.set_config('processes:dispersion', False)
        o.seed_elements(lon=0, lat=0, time=datetime.now(), number=1000, oil_type=ot)
        o.run(duration=timedelta(hours=hours), time_step=600)
        b[ot] = o.get_oil_budget()
        # Get viscosity and density
        kin_viscosity = o.result.viscosity
        dyn_viscosity = kin_viscosity * o.result.density * 1000 # mPas
        viscosities[ot] = dyn_viscosity.mean(dim='trajectory')
        densities[ot] = o.result.density.mean(dim='trajectory')
        water_fractions[ot] = o.result.water_fraction.mean(dim='trajectory')

    time = (o.result.time-o.result.time[0]).dt.total_seconds()/3600  # Hours since start

    figw,(axevap, axsurf, axsub) = plt.subplots(3,1)
    figp,(axdens, axvisc, axw) = plt.subplots(3,1)
    for ot in oiltypes:
        axevap.plot(time, 100*b[ot]['mass_evaporated']/b[ot]['mass_total'], label=ot)
        axsurf.plot(time, 100*b[ot]['mass_surface']/b[ot]['mass_total'], label=ot)
        axsub.plot(time, 100*b[ot]['mass_submerged']/b[ot]['mass_total'], label=ot)
        axdens.plot(time, densities[ot], label=ot)
        axvisc.plot(time, viscosities[ot], label=ot)
        axw.plot(time, water_fractions[ot], label=ot)

    for ax in (axevap, axsurf, axsub, axdens, axvisc, axw):
        if ax in (axevap, axsurf, axsub):
            ax.set_ylim([0, 100])
        ax.set_xlim([0, hours])

    axevap.set_title('Wind speed %s m/s' % wind_speed)
    axsurf.set_ylabel('Surface [%]')
    axevap.set_ylabel('Evaporated [%]')
    axsub.set_ylabel('Submerged  [%]')
    axsub.legend()
    axsub.set_xlabel('Time [hours]')

    axdens.set_title('Wind speed %s m/s' % wind_speed)
    axvisc.set_ylabel('Viscosity [mPas]')
    axvisc.set_yscale('log')
    axdens.set_ylabel('Density [kg/m3]')
    axw.set_ylabel('Water fraction')
    axw.set_xlabel('Time [hours]')
    axw.legend()
    plt.tight_layout()
    plt.show()
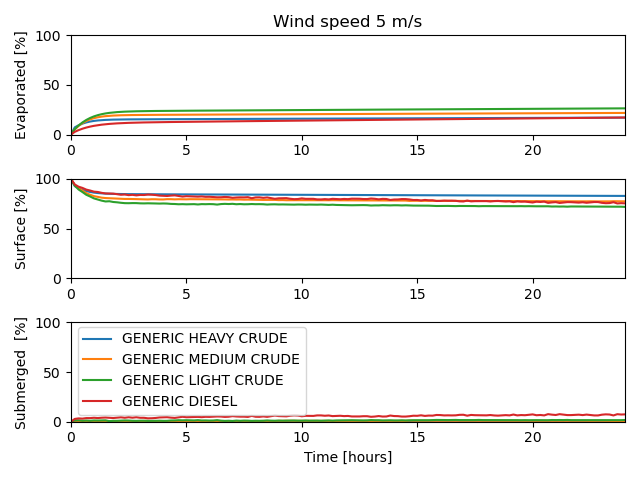
5 m/s - GENERIC HEAVY CRUDE
5 m/s - GENERIC MEDIUM CRUDE
5 m/s - GENERIC LIGHT CRUDE
5 m/s - GENERIC DIESEL
10 m/s - GENERIC HEAVY CRUDE
10 m/s - GENERIC MEDIUM CRUDE
10 m/s - GENERIC LIGHT CRUDE
10 m/s - GENERIC DIESEL
Total running time of the script: (2 minutes 0.036 seconds)