Note
Go to the end to download the full example code.
Example plot (for front page)
from datetime import datetime, timedelta
from opendrift.models.oceandrift import OceanDrift

o = OceanDrift(loglevel=30)
o.add_readers_from_list(
    ['https://thredds.met.no/thredds/dodsC/fou-hi/norkystv3_800m_m00_be'])
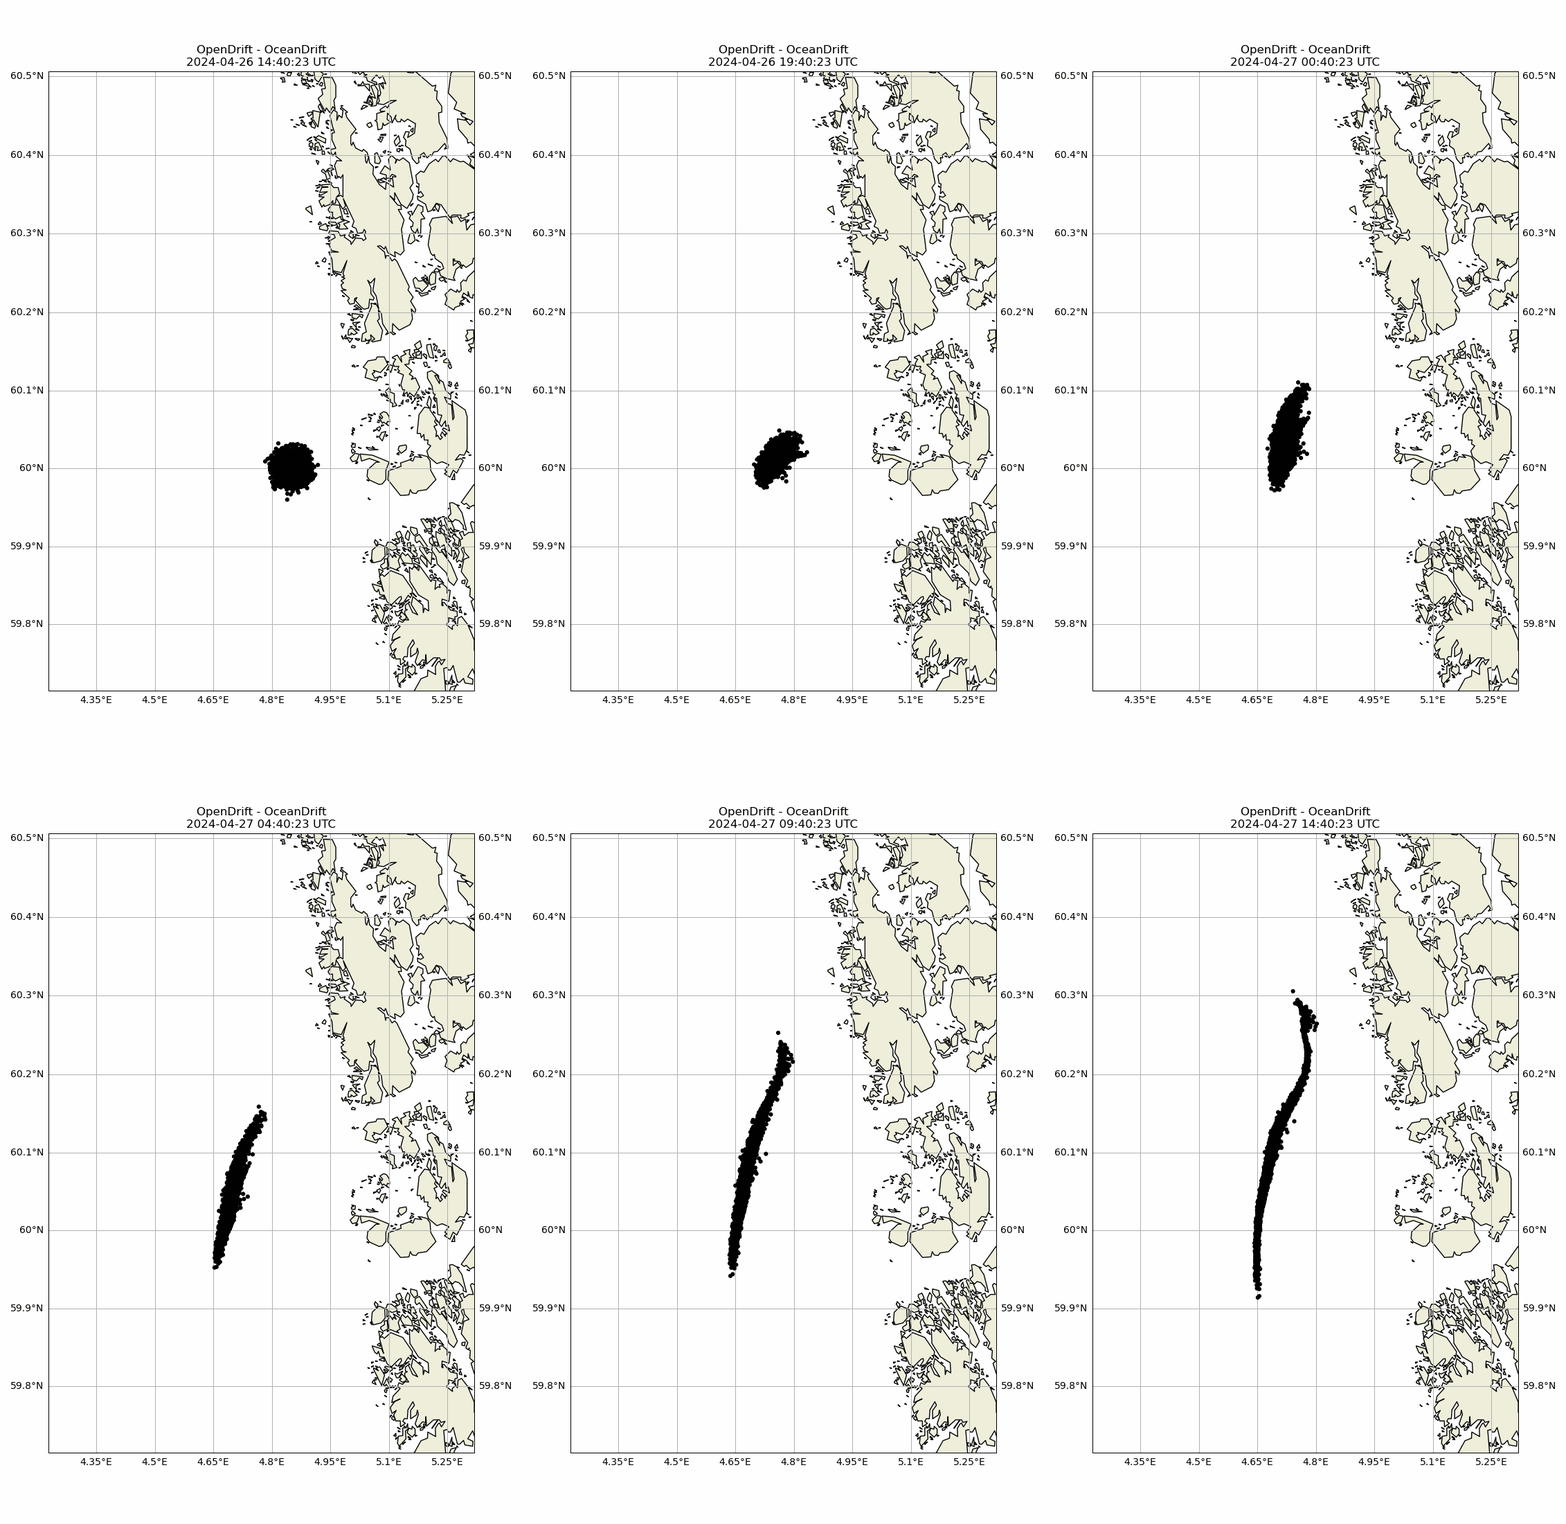
o.seed_elements(lon=4.85, lat=60, time=datetime.now(), number=10000, radius=1000)

o.run(duration=timedelta(hours=24))
o.animation(filename='animation.mp4')

Total running time of the script: (1 minutes 15.430 seconds)