Note
Go to the end to download the full example code.
Plotting map

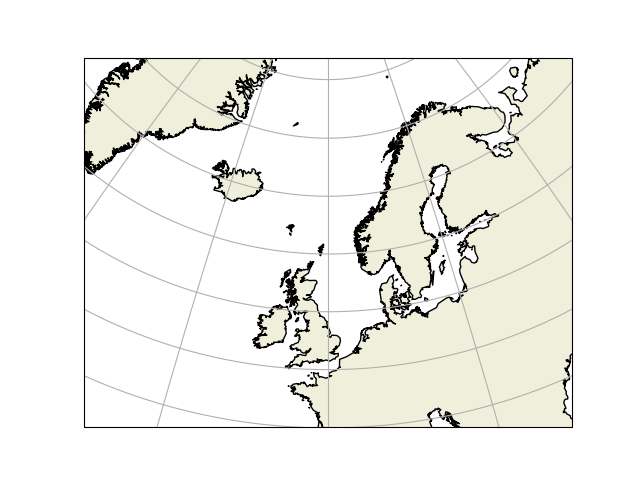
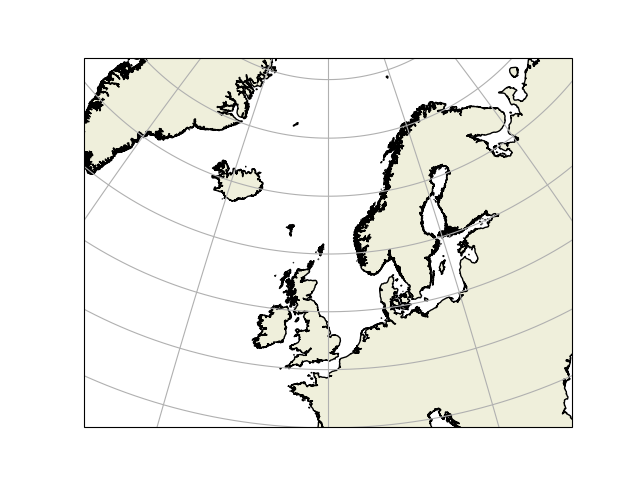

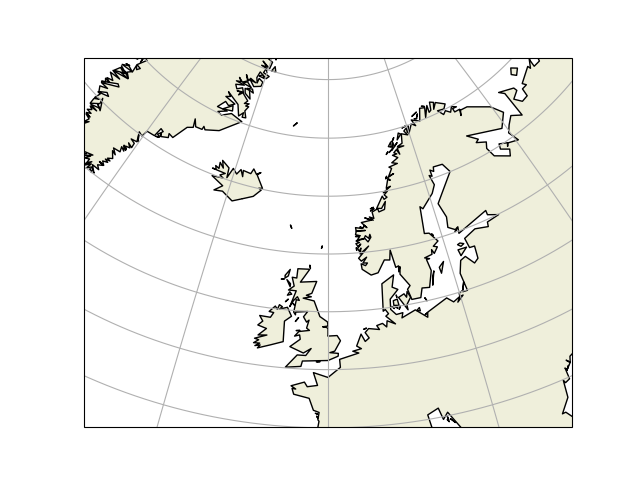
coarse LSCALE
low LSCALE
intermediate LSCALE
high LSCALE
auto LSCALE
import matplotlib.pyplot as plt
import cartopy.crs as ccrs
import cartopy.feature as cfeature


for lscale in ['coarse', 'low', 'intermediate', 'high', 'auto']:
    fig = plt.figure()
    sp = ccrs.Stereographic(central_longitude=0, central_latitude=60)
    ax = fig.add_subplot(1, 1, 1, projection=sp)

    corners = [-30, 30, 45, 75]
    #s = cfeature.AdaptiveScaler('coarse',
    #                (('low', 100), ('intermediate', 20), ('high', 5), ('full', 1)))
    #lscale = s.scale_from_extent([corners[0], corners[1], corners[2], corners[3]])
    #lscale = 'auto'
    print(lscale, 'LSCALE ')
    f = cfeature.GSHHSFeature(scale=lscale, levels=[1])
    ax.add_geometries(
        #f.intersecting_geometries(corners),
        f.geometries(),
        ccrs.PlateCarree(),
        facecolor=cfeature.COLORS['land'],
        edgecolor='black')

    ax.set_extent(corners, crs=ccrs.PlateCarree())
    gl = ax.gridlines(ccrs.PlateCarree())

    plt.show()
Total running time of the script: (3 minutes 33.263 seconds)