Note
Go to the end to download the full example code.
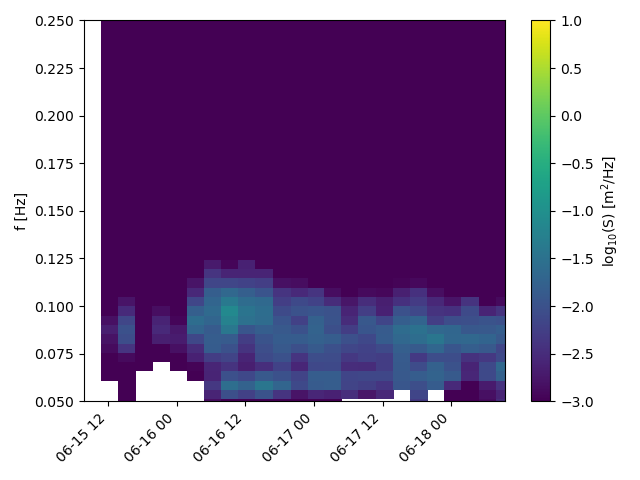
Plotting wave spectra data, using the accessor syntax#
import trajan as ta
from trajan.readers.omb import read_omb_csv
import coloredlogs
import datetime
import matplotlib.pyplot as plt

# adjust the level of information printed
# coloredlogs.install(level='error')
coloredlogs.install(level='debug')
# load the data from an example file with several buoys and a bit of wave spectra data
xr_data = read_omb_csv(ta.DATA_DIR + 'omb/omb3.csv')
2026-07-21 14:55:56 runnervm3jd5f trajan.readers.omb[2874] DEBUG reading /home/runner/work/trajan/trajan/examples/data_dir/omb/omb3.csv..
2026-07-21 14:55:56 runnervm3jd5f trajan.readers.omb[2874] DEBUG omb_dataframe at index 94 is:
Date Time (UTC)    16/Jun/2022 18:27:19
Device                        drifter_2
Direction                            MO
Payload                             NaN
Approx Lat/Lng          74.36745,3.3274
Payload (Text)                      NaN
Length (Bytes)                        0
Credits                               1
Name: 94, dtype: object
this is empty (Length (Bytes) is 0), drop
2026-07-21 14:55:56 runnervm3jd5f trajan.readers.omb[2874] DEBUG start applying sliding_filter_nsigma
2026-07-21 14:55:56 runnervm3jd5f trajan.readers.omb[2874] DEBUG done applying sliding_filter_nsigma
2026-07-21 14:55:56 runnervm3jd5f trajan.readers.omb[2874] DEBUG start applying sliding_filter_nsigma
2026-07-21 14:55:56 runnervm3jd5f trajan.readers.omb[2874] DEBUG done applying sliding_filter_nsigma
2026-07-21 14:55:56 runnervm3jd5f trajan.readers.omb[2874] DEBUG start applying sliding_filter_nsigma
2026-07-21 14:55:56 runnervm3jd5f trajan.readers.omb[2874] DEBUG done applying sliding_filter_nsigma
2026-07-21 14:55:57 runnervm3jd5f trajan.accessor[2874] DEBUG Detecting trajectory dimension
2026-07-21 14:55:57 runnervm3jd5f trajan.accessor[2874] DEBUG Found CF trajectory dimension "trajectory"
2026-07-21 14:55:57 runnervm3jd5f trajan.accessor[2874] DEBUG Detecting time-variable for "obs"..
2026-07-21 14:55:57 runnervm3jd5f trajan.accessor[2874] DEBUG Detected obs-dim: obs, detected time-variable: time.
2026-07-21 14:55:57 runnervm3jd5f trajan.accessor[2874] DEBUG Detected Ragged trajectory dataset
2026-07-21 14:55:57 runnervm3jd5f trajan.traj[2874] DEBUG No grid-mapping specified, checking if coordinates are lon/lat..
2026-07-21 14:55:57 runnervm3jd5f trajan.traj[2874] DEBUG No grid-mapping specified, checking if coordinates are lon/lat..
2026-07-21 14:55:57 runnervm3jd5f trajan.traj[2874] DEBUG No grid-mapping specified, checking if coordinates are lon/lat..
2026-07-21 14:55:57 runnervm3jd5f trajan.traj[2874] DEBUG No grid-mapping specified, checking if coordinates are lon/lat..
2026-07-21 14:55:57 runnervm3jd5f trajan.traj[2874] DEBUG No grid-mapping specified, checking if coordinates are lon/lat..
2026-07-21 14:55:57 runnervm3jd5f trajan.traj[2874] DEBUG No grid-mapping specified, checking if coordinates are lon/lat..
2026-07-21 14:55:57 runnervm3jd5f trajan.traj[2874] DEBUG No grid-mapping specified, checking if coordinates are lon/lat..
2026-07-21 14:55:57 runnervm3jd5f trajan.traj[2874] DEBUG No grid-mapping specified, checking if coordinates are lon/lat..
# if no axis is provided, an axis will be generated automatically
# by default, we "decorate", i.e. label axis etc

xr_data.isel(trajectory=0).processed_elevation_energy_spectrum.wave.plot(
    xr_data.isel(trajectory=0).time_waves_imu.squeeze(),
    )

plt.show()
2026-07-21 14:55:57 runnervm3jd5f trajan.waves[2874] DEBUG Setting up new plot object.
2026-07-21 14:55:57 runnervm3jd5f matplotlib.colorbar[2874] DEBUG locator: <matplotlib.ticker.AutoLocator object at 0x7f55942ea7b0>
2026-07-21 14:55:57 runnervm3jd5f matplotlib.font_manager[2874] DEBUG findfont: Matching sans\-serif:style=normal:variant=normal:weight=normal:stretch=normal:size=10.0.
2026-07-21 14:55:57 runnervm3jd5f matplotlib.font_manager[2874] DEBUG findfont: score(FontEntry(fname='/home/runner/micromamba/envs/trajan/lib/python3.14/site-packages/matplotlib/mpl-data/fonts/ttf/cmmi10.ttf', index=0, name='cmmi10', style='normal', variant='normal', weight=400, stretch='normal', size='scalable')) = 10.05
2026-07-21 14:55:57 runnervm3jd5f matplotlib.font_manager[2874] DEBUG findfont: score(FontEntry(fname='/home/runner/micromamba/envs/trajan/lib/python3.14/site-packages/matplotlib/mpl-data/fonts/ttf/DejaVuSerif-Bold.ttf', index=0, name='DejaVu Serif', style='normal', variant='normal', weight=700, stretch='normal', size='scalable')) = 10.335
2026-07-21 14:55:57 runnervm3jd5f matplotlib.font_manager[2874] DEBUG findfont: score(FontEntry(fname='/home/runner/micromamba/envs/trajan/lib/python3.14/site-packages/matplotlib/mpl-data/fonts/ttf/DejaVuSans-Oblique.ttf', index=0, name='DejaVu Sans', style='oblique', variant='normal', weight=400, stretch='normal', size='scalable')) = 1.05
2026-07-21 14:55:57 runnervm3jd5f matplotlib.font_manager[2874] DEBUG findfont: score(FontEntry(fname='/home/runner/micromamba/envs/trajan/lib/python3.14/site-packages/matplotlib/mpl-data/fonts/ttf/STIXSizThreeSymReg.ttf', index=0, name='STIXSizeThreeSym', style='normal', variant='normal', weight=400, stretch='normal', size='scalable')) = 10.05
2026-07-21 14:55:57 runnervm3jd5f matplotlib.font_manager[2874] DEBUG findfont: score(FontEntry(fname='/home/runner/micromamba/envs/trajan/lib/python3.14/site-packages/matplotlib/mpl-data/fonts/ttf/STIXNonUniBolIta.ttf', index=0, name='STIXNonUnicode', style='italic', variant='normal', weight=700, stretch='normal', size='scalable')) = 11.335
2026-07-21 14:55:57 runnervm3jd5f matplotlib.font_manager[2874] DEBUG findfont: score(FontEntry(fname='/home/runner/micromamba/envs/trajan/lib/python3.14/site-packages/matplotlib/mpl-data/fonts/ttf/DejaVuSerifDisplay.ttf', index=0, name='DejaVu Serif Display', style='normal', variant='normal', weight=400, stretch='normal', size='scalable')) = 10.05
2026-07-21 14:55:57 runnervm3jd5f matplotlib.font_manager[2874] DEBUG findfont: score(FontEntry(fname='/home/runner/micromamba/envs/trajan/lib/python3.14/site-packages/matplotlib/mpl-data/fonts/ttf/cmss10.ttf', index=0, name='cmss10', style='normal', variant='normal', weight=400, stretch='normal', size='scalable')) = 10.05
2026-07-21 14:55:57 runnervm3jd5f matplotlib.font_manager[2874] DEBUG findfont: score(FontEntry(fname='/home/runner/micromamba/envs/trajan/lib/python3.14/site-packages/matplotlib/mpl-data/fonts/ttf/STIXGeneralBolIta.ttf', index=0, name='STIXGeneral', style='italic', variant='normal', weight=700, stretch='normal', size='scalable')) = 11.335
2026-07-21 14:55:57 runnervm3jd5f matplotlib.font_manager[2874] DEBUG findfont: score(FontEntry(fname='/home/runner/micromamba/envs/trajan/lib/python3.14/site-packages/matplotlib/mpl-data/fonts/ttf/cmtt10.ttf', index=0, name='cmtt10', style='normal', variant='normal', weight=400, stretch='normal', size='scalable')) = 10.05
2026-07-21 14:55:57 runnervm3jd5f matplotlib.font_manager[2874] DEBUG findfont: score(FontEntry(fname='/home/runner/micromamba/envs/trajan/lib/python3.14/site-packages/matplotlib/mpl-data/fonts/ttf/cmsy10.ttf', index=0, name='cmsy10', style='normal', variant='normal', weight=400, stretch='normal', size='scalable')) = 10.05
2026-07-21 14:55:57 runnervm3jd5f matplotlib.font_manager[2874] DEBUG findfont: score(FontEntry(fname='/home/runner/micromamba/envs/trajan/lib/python3.14/site-packages/matplotlib/mpl-data/fonts/ttf/DejaVuSansMono-Oblique.ttf', index=0, name='DejaVu Sans Mono', style='oblique', variant='normal', weight=400, stretch='normal', size='scalable')) = 11.05
2026-07-21 14:55:57 runnervm3jd5f matplotlib.font_manager[2874] DEBUG findfont: score(FontEntry(fname='/home/runner/micromamba/envs/trajan/lib/python3.14/site-packages/matplotlib/mpl-data/fonts/ttf/STIXNonUniIta.ttf', index=0, name='STIXNonUnicode', style='italic', variant='normal', weight=400, stretch='normal', size='scalable')) = 11.05
2026-07-21 14:55:57 runnervm3jd5f matplotlib.font_manager[2874] DEBUG findfont: score(FontEntry(fname='/home/runner/micromamba/envs/trajan/lib/python3.14/site-packages/matplotlib/mpl-data/fonts/ttf/STIXGeneral.ttf', index=0, name='STIXGeneral', style='normal', variant='normal', weight=400, stretch='normal', size='scalable')) = 10.05
2026-07-21 14:55:57 runnervm3jd5f matplotlib.font_manager[2874] DEBUG findfont: score(FontEntry(fname='/home/runner/micromamba/envs/trajan/lib/python3.14/site-packages/matplotlib/mpl-data/fonts/ttf/cmti10.ttf', index=0, name='cmti10', style='normal', variant='normal', weight=400, stretch='normal', size='scalable')) = 10.05
2026-07-21 14:55:57 runnervm3jd5f matplotlib.font_manager[2874] DEBUG findfont: score(FontEntry(fname='/home/runner/micromamba/envs/trajan/lib/python3.14/site-packages/matplotlib/mpl-data/fonts/ttf/DejaVuSansMono-BoldOblique.ttf', index=0, name='DejaVu Sans Mono', style='oblique', variant='normal', weight=700, stretch='normal', size='scalable')) = 11.335
2026-07-21 14:55:57 runnervm3jd5f matplotlib.font_manager[2874] DEBUG findfont: score(FontEntry(fname='/home/runner/micromamba/envs/trajan/lib/python3.14/site-packages/matplotlib/mpl-data/fonts/ttf/DejaVuSerif.ttf', index=0, name='DejaVu Serif', style='normal', variant='normal', weight=400, stretch='normal', size='scalable')) = 10.05
2026-07-21 14:55:57 runnervm3jd5f matplotlib.font_manager[2874] DEBUG findfont: score(FontEntry(fname='/home/runner/micromamba/envs/trajan/lib/python3.14/site-packages/matplotlib/mpl-data/fonts/ttf/LastResortHE-Regular.ttf', index=0, name='Last Resort High-Efficiency', style='normal', variant='normal', weight=400, stretch='normal', size='scalable')) = 10.05
2026-07-21 14:55:57 runnervm3jd5f matplotlib.font_manager[2874] DEBUG findfont: score(FontEntry(fname='/home/runner/micromamba/envs/trajan/lib/python3.14/site-packages/matplotlib/mpl-data/fonts/ttf/cmex10.ttf', index=0, name='cmex10', style='normal', variant='normal', weight=400, stretch='normal', size='scalable')) = 10.05
2026-07-21 14:55:57 runnervm3jd5f matplotlib.font_manager[2874] DEBUG findfont: score(FontEntry(fname='/home/runner/micromamba/envs/trajan/lib/python3.14/site-packages/matplotlib/mpl-data/fonts/ttf/STIXSizFiveSymReg.ttf', index=0, name='STIXSizeFiveSym', style='normal', variant='normal', weight=400, stretch='normal', size='scalable')) = 10.05
2026-07-21 14:55:57 runnervm3jd5f matplotlib.font_manager[2874] DEBUG findfont: score(FontEntry(fname='/home/runner/micromamba/envs/trajan/lib/python3.14/site-packages/matplotlib/mpl-data/fonts/ttf/STIXNonUniBol.ttf', index=0, name='STIXNonUnicode', style='normal', variant='normal', weight=700, stretch='normal', size='scalable')) = 10.335
2026-07-21 14:55:57 runnervm3jd5f matplotlib.font_manager[2874] DEBUG findfont: score(FontEntry(fname='/home/runner/micromamba/envs/trajan/lib/python3.14/site-packages/matplotlib/mpl-data/fonts/ttf/DejaVuSansDisplay.ttf', index=0, name='DejaVu Sans Display', style='normal', variant='normal', weight=400, stretch='normal', size='scalable')) = 10.05
2026-07-21 14:55:57 runnervm3jd5f matplotlib.font_manager[2874] DEBUG findfont: score(FontEntry(fname='/home/runner/micromamba/envs/trajan/lib/python3.14/site-packages/matplotlib/mpl-data/fonts/ttf/DejaVuSansMono.ttf', index=0, name='DejaVu Sans Mono', style='normal', variant='normal', weight=400, stretch='normal', size='scalable')) = 10.05
2026-07-21 14:55:57 runnervm3jd5f matplotlib.font_manager[2874] DEBUG findfont: score(FontEntry(fname='/home/runner/micromamba/envs/trajan/lib/python3.14/site-packages/matplotlib/mpl-data/fonts/ttf/cmb10.ttf', index=0, name='cmb10', style='normal', variant='normal', weight=400, stretch='normal', size='scalable')) = 10.05
2026-07-21 14:55:57 runnervm3jd5f matplotlib.font_manager[2874] DEBUG findfont: score(FontEntry(fname='/home/runner/micromamba/envs/trajan/lib/python3.14/site-packages/matplotlib/mpl-data/fonts/ttf/STIXSizTwoSymReg.ttf', index=0, name='STIXSizeTwoSym', style='normal', variant='normal', weight=400, stretch='normal', size='scalable')) = 10.05
2026-07-21 14:55:57 runnervm3jd5f matplotlib.font_manager[2874] DEBUG findfont: score(FontEntry(fname='/home/runner/micromamba/envs/trajan/lib/python3.14/site-packages/matplotlib/mpl-data/fonts/ttf/DejaVuSans.ttf', index=0, name='DejaVu Sans', style='normal', variant='normal', weight=400, stretch='normal', size='scalable')) = 0.05
2026-07-21 14:55:57 runnervm3jd5f matplotlib.font_manager[2874] DEBUG findfont: score(FontEntry(fname='/home/runner/micromamba/envs/trajan/lib/python3.14/site-packages/matplotlib/mpl-data/fonts/ttf/STIXNonUni.ttf', index=0, name='STIXNonUnicode', style='normal', variant='normal', weight=400, stretch='normal', size='scalable')) = 10.05
2026-07-21 14:55:57 runnervm3jd5f matplotlib.font_manager[2874] DEBUG findfont: score(FontEntry(fname='/home/runner/micromamba/envs/trajan/lib/python3.14/site-packages/matplotlib/mpl-data/fonts/ttf/STIXGeneralItalic.ttf', index=0, name='STIXGeneral', style='italic', variant='normal', weight=400, stretch='normal', size='scalable')) = 11.05
2026-07-21 14:55:57 runnervm3jd5f matplotlib.font_manager[2874] DEBUG findfont: score(FontEntry(fname='/home/runner/micromamba/envs/trajan/lib/python3.14/site-packages/matplotlib/mpl-data/fonts/ttf/STIXSizOneSymBol.ttf', index=0, name='STIXSizeOneSym', style='normal', variant='normal', weight=700, stretch='normal', size='scalable')) = 10.335
2026-07-21 14:55:57 runnervm3jd5f matplotlib.font_manager[2874] DEBUG findfont: score(FontEntry(fname='/home/runner/micromamba/envs/trajan/lib/python3.14/site-packages/matplotlib/mpl-data/fonts/ttf/DejaVuSansMono-Bold.ttf', index=0, name='DejaVu Sans Mono', style='normal', variant='normal', weight=700, stretch='normal', size='scalable')) = 10.335
2026-07-21 14:55:57 runnervm3jd5f matplotlib.font_manager[2874] DEBUG findfont: score(FontEntry(fname='/home/runner/micromamba/envs/trajan/lib/python3.14/site-packages/matplotlib/mpl-data/fonts/ttf/STIXSizTwoSymBol.ttf', index=0, name='STIXSizeTwoSym', style='normal', variant='normal', weight=700, stretch='normal', size='scalable')) = 10.335
2026-07-21 14:55:57 runnervm3jd5f matplotlib.font_manager[2874] DEBUG findfont: score(FontEntry(fname='/home/runner/micromamba/envs/trajan/lib/python3.14/site-packages/matplotlib/mpl-data/fonts/ttf/STIXSizThreeSymBol.ttf', index=0, name='STIXSizeThreeSym', style='normal', variant='normal', weight=700, stretch='normal', size='scalable')) = 10.335
2026-07-21 14:55:57 runnervm3jd5f matplotlib.font_manager[2874] DEBUG findfont: score(FontEntry(fname='/home/runner/micromamba/envs/trajan/lib/python3.14/site-packages/matplotlib/mpl-data/fonts/ttf/DejaVuSerif-BoldItalic.ttf', index=0, name='DejaVu Serif', style='italic', variant='normal', weight=700, stretch='normal', size='scalable')) = 11.335
2026-07-21 14:55:57 runnervm3jd5f matplotlib.font_manager[2874] DEBUG findfont: score(FontEntry(fname='/home/runner/micromamba/envs/trajan/lib/python3.14/site-packages/matplotlib/mpl-data/fonts/ttf/DejaVuSerif-Italic.ttf', index=0, name='DejaVu Serif', style='italic', variant='normal', weight=400, stretch='normal', size='scalable')) = 11.05
2026-07-21 14:55:57 runnervm3jd5f matplotlib.font_manager[2874] DEBUG findfont: score(FontEntry(fname='/home/runner/micromamba/envs/trajan/lib/python3.14/site-packages/matplotlib/mpl-data/fonts/ttf/DejaVuSans-Bold.ttf', index=0, name='DejaVu Sans', style='normal', variant='normal', weight=700, stretch='normal', size='scalable')) = 0.33499999999999996
2026-07-21 14:55:57 runnervm3jd5f matplotlib.font_manager[2874] DEBUG findfont: score(FontEntry(fname='/home/runner/micromamba/envs/trajan/lib/python3.14/site-packages/matplotlib/mpl-data/fonts/ttf/STIXSizFourSymBol.ttf', index=0, name='STIXSizeFourSym', style='normal', variant='normal', weight=700, stretch='normal', size='scalable')) = 10.335
2026-07-21 14:55:57 runnervm3jd5f matplotlib.font_manager[2874] DEBUG findfont: score(FontEntry(fname='/home/runner/micromamba/envs/trajan/lib/python3.14/site-packages/matplotlib/mpl-data/fonts/ttf/STIXSizOneSymReg.ttf', index=0, name='STIXSizeOneSym', style='normal', variant='normal', weight=400, stretch='normal', size='scalable')) = 10.05
2026-07-21 14:55:57 runnervm3jd5f matplotlib.font_manager[2874] DEBUG findfont: score(FontEntry(fname='/home/runner/micromamba/envs/trajan/lib/python3.14/site-packages/matplotlib/mpl-data/fonts/ttf/cmr10.ttf', index=0, name='cmr10', style='normal', variant='normal', weight=400, stretch='normal', size='scalable')) = 10.05
2026-07-21 14:55:57 runnervm3jd5f matplotlib.font_manager[2874] DEBUG findfont: score(FontEntry(fname='/home/runner/micromamba/envs/trajan/lib/python3.14/site-packages/matplotlib/mpl-data/fonts/ttf/STIXGeneralBol.ttf', index=0, name='STIXGeneral', style='normal', variant='normal', weight=700, stretch='normal', size='scalable')) = 10.335
2026-07-21 14:55:57 runnervm3jd5f matplotlib.font_manager[2874] DEBUG findfont: score(FontEntry(fname='/home/runner/micromamba/envs/trajan/lib/python3.14/site-packages/matplotlib/mpl-data/fonts/ttf/DejaVuSans-BoldOblique.ttf', index=0, name='DejaVu Sans', style='oblique', variant='normal', weight=700, stretch='normal', size='scalable')) = 1.335
2026-07-21 14:55:57 runnervm3jd5f matplotlib.font_manager[2874] DEBUG findfont: score(FontEntry(fname='/home/runner/micromamba/envs/trajan/lib/python3.14/site-packages/matplotlib/mpl-data/fonts/ttf/STIXSizFourSymReg.ttf', index=0, name='STIXSizeFourSym', style='normal', variant='normal', weight=400, stretch='normal', size='scalable')) = 10.05
2026-07-21 14:55:57 runnervm3jd5f matplotlib.font_manager[2874] DEBUG findfont: score(FontEntry(fname='/usr/share/fonts/truetype/lato/Lato-Black.ttf', index=0, name='Lato', style='normal', variant='normal', weight=900, stretch='normal', size='scalable')) = 10.525
2026-07-21 14:55:57 runnervm3jd5f matplotlib.font_manager[2874] DEBUG findfont: score(FontEntry(fname='/usr/share/fonts/truetype/lato/Lato-Black.ttf', index=0, name='Lato Black', style='normal', variant='normal', weight=400, stretch='normal', size='scalable')) = 10.05
2026-07-21 14:55:57 runnervm3jd5f matplotlib.font_manager[2874] DEBUG findfont: score(FontEntry(fname='/usr/share/fonts/truetype/liberation/LiberationSerif-Regular.ttf', index=0, name='Liberation Serif', style='normal', variant='normal', weight=400, stretch='normal', size='scalable')) = 10.05
2026-07-21 14:55:57 runnervm3jd5f matplotlib.font_manager[2874] DEBUG findfont: score(FontEntry(fname='/usr/share/fonts/truetype/dejavu/DejaVuSerifCondensed.ttf', index=0, name='DejaVu Serif', style='normal', variant='normal', weight=400, stretch='condensed', size='scalable')) = 10.25
2026-07-21 14:55:57 runnervm3jd5f matplotlib.font_manager[2874] DEBUG findfont: score(FontEntry(fname='/usr/share/fonts/truetype/dejavu/DejaVuSerifCondensed.ttf', index=0, name='DejaVu Serif Condensed', style='normal', variant='normal', weight=380, stretch='condensed', size='scalable')) = 10.269
2026-07-21 14:55:57 runnervm3jd5f matplotlib.font_manager[2874] DEBUG findfont: score(FontEntry(fname='/home/runner/micromamba/envs/trajan/fonts/UbuntuMono-BI.ttf', index=0, name='Ubuntu Mono', style='italic', variant='normal', weight=700, stretch='normal', size='scalable')) = 11.335
2026-07-21 14:55:57 runnervm3jd5f matplotlib.font_manager[2874] DEBUG findfont: score(FontEntry(fname='/usr/share/fonts/truetype/dejavu/DejaVuSans.ttf', index=0, name='DejaVu Sans', style='normal', variant='normal', weight=400, stretch='normal', size='scalable')) = 0.05
2026-07-21 14:55:57 runnervm3jd5f matplotlib.font_manager[2874] DEBUG findfont: score(FontEntry(fname='/usr/share/fonts/truetype/lato/Lato-Italic.ttf', index=0, name='Lato', style='italic', variant='normal', weight=400, stretch='normal', size='scalable')) = 11.05
2026-07-21 14:55:57 runnervm3jd5f matplotlib.font_manager[2874] DEBUG findfont: score(FontEntry(fname='/usr/share/fonts/truetype/liberation/LiberationSans-Italic.ttf', index=0, name='Liberation Sans', style='italic', variant='normal', weight=400, stretch='normal', size='scalable')) = 11.05
2026-07-21 14:55:57 runnervm3jd5f matplotlib.font_manager[2874] DEBUG findfont: score(FontEntry(fname='/home/runner/micromamba/envs/trajan/fonts/Ubuntu-B.ttf', index=0, name='Ubuntu', style='normal', variant='normal', weight=700, stretch='normal', size='scalable')) = 10.335
2026-07-21 14:55:57 runnervm3jd5f matplotlib.font_manager[2874] DEBUG findfont: score(FontEntry(fname='/home/runner/micromamba/envs/trajan/fonts/SourceCodePro-Semibold.ttf', index=0, name='Source Code Pro', style='normal', variant='normal', weight=600, stretch='normal', size='scalable')) = 10.24
2026-07-21 14:55:57 runnervm3jd5f matplotlib.font_manager[2874] DEBUG findfont: score(FontEntry(fname='/home/runner/micromamba/envs/trajan/fonts/SourceCodePro-Semibold.ttf', index=0, name='Source Code Pro Semibold', style='normal', variant='normal', weight=400, stretch='normal', size='scalable')) = 10.05
2026-07-21 14:55:57 runnervm3jd5f matplotlib.font_manager[2874] DEBUG findfont: score(FontEntry(fname='/home/runner/micromamba/envs/trajan/fonts/SourceCodePro-Bold.ttf', index=0, name='Source Code Pro', style='normal', variant='normal', weight=700, stretch='normal', size='scalable')) = 10.335
2026-07-21 14:55:57 runnervm3jd5f matplotlib.font_manager[2874] DEBUG findfont: score(FontEntry(fname='/home/runner/micromamba/envs/trajan/fonts/Ubuntu-MI.ttf', index=0, name='Ubuntu', style='italic', variant='normal', weight=500, stretch='normal', size='scalable')) = 11.145
2026-07-21 14:55:57 runnervm3jd5f matplotlib.font_manager[2874] DEBUG findfont: score(FontEntry(fname='/home/runner/micromamba/envs/trajan/fonts/Ubuntu-MI.ttf', index=0, name='Ubuntu Light', style='italic', variant='normal', weight=700, stretch='normal', size='scalable')) = 11.335
2026-07-21 14:55:57 runnervm3jd5f matplotlib.font_manager[2874] DEBUG findfont: score(FontEntry(fname='/usr/share/fonts/truetype/lato/Lato-Regular.ttf', index=0, name='Lato', style='normal', variant='normal', weight=400, stretch='normal', size='scalable')) = 10.05
2026-07-21 14:55:57 runnervm3jd5f matplotlib.font_manager[2874] DEBUG findfont: score(FontEntry(fname='/usr/share/fonts/truetype/lato/Lato-ThinItalic.ttf', index=0, name='Lato', style='italic', variant='normal', weight=275, stretch='normal', size='scalable')) = 11.16875
2026-07-21 14:55:57 runnervm3jd5f matplotlib.font_manager[2874] DEBUG findfont: score(FontEntry(fname='/usr/share/fonts/truetype/lato/Lato-ThinItalic.ttf', index=0, name='Lato Thin', style='italic', variant='normal', weight=400, stretch='normal', size='scalable')) = 11.05
2026-07-21 14:55:57 runnervm3jd5f matplotlib.font_manager[2874] DEBUG findfont: score(FontEntry(fname='/usr/share/fonts/truetype/lato/Lato-BlackItalic.ttf', index=0, name='Lato', style='italic', variant='normal', weight=900, stretch='normal', size='scalable')) = 11.525
2026-07-21 14:55:57 runnervm3jd5f matplotlib.font_manager[2874] DEBUG findfont: score(FontEntry(fname='/usr/share/fonts/truetype/lato/Lato-BlackItalic.ttf', index=0, name='Lato Black', style='italic', variant='normal', weight=400, stretch='normal', size='scalable')) = 11.05
2026-07-21 14:55:57 runnervm3jd5f matplotlib.font_manager[2874] DEBUG findfont: score(FontEntry(fname='/usr/share/fonts/truetype/dejavu/DejaVuSerifCondensed-Italic.ttf', index=0, name='DejaVu Serif', style='italic', variant='normal', weight=400, stretch='condensed', size='scalable')) = 11.25
2026-07-21 14:55:57 runnervm3jd5f matplotlib.font_manager[2874] DEBUG findfont: score(FontEntry(fname='/usr/share/fonts/truetype/dejavu/DejaVuSerifCondensed-Italic.ttf', index=0, name='DejaVu Serif Condensed', style='italic', variant='normal', weight=400, stretch='condensed', size='scalable')) = 11.25
2026-07-21 14:55:57 runnervm3jd5f matplotlib.font_manager[2874] DEBUG findfont: score(FontEntry(fname='/usr/share/fonts/truetype/dejavu/DejaVuSans-Bold.ttf', index=0, name='DejaVu Sans', style='normal', variant='normal', weight=700, stretch='normal', size='scalable')) = 0.33499999999999996
2026-07-21 14:55:57 runnervm3jd5f matplotlib.font_manager[2874] DEBUG findfont: score(FontEntry(fname='/home/runner/micromamba/envs/trajan/fonts/UbuntuMono-R.ttf', index=0, name='Ubuntu Mono', style='normal', variant='normal', weight=400, stretch='normal', size='scalable')) = 10.05
2026-07-21 14:55:57 runnervm3jd5f matplotlib.font_manager[2874] DEBUG findfont: score(FontEntry(fname='/usr/share/fonts/truetype/dejavu/DejaVuSerif-BoldItalic.ttf', index=0, name='DejaVu Serif', style='italic', variant='normal', weight=700, stretch='normal', size='scalable')) = 11.335
2026-07-21 14:55:57 runnervm3jd5f matplotlib.font_manager[2874] DEBUG findfont: score(FontEntry(fname='/usr/share/fonts/truetype/lato/Lato-Hairline.ttf', index=0, name='Lato', style='normal', variant='normal', weight=250, stretch='normal', size='scalable')) = 10.1925
2026-07-21 14:55:57 runnervm3jd5f matplotlib.font_manager[2874] DEBUG findfont: score(FontEntry(fname='/usr/share/fonts/truetype/lato/Lato-Hairline.ttf', index=0, name='Lato Hairline', style='normal', variant='normal', weight=400, stretch='normal', size='scalable')) = 10.05
2026-07-21 14:55:57 runnervm3jd5f matplotlib.font_manager[2874] DEBUG findfont: score(FontEntry(fname='/usr/share/fonts/truetype/lato/Lato-LightItalic.ttf', index=0, name='Lato', style='italic', variant='normal', weight=300, stretch='normal', size='scalable')) = 11.145
2026-07-21 14:55:57 runnervm3jd5f matplotlib.font_manager[2874] DEBUG findfont: score(FontEntry(fname='/usr/share/fonts/truetype/lato/Lato-LightItalic.ttf', index=0, name='Lato Light', style='italic', variant='normal', weight=400, stretch='normal', size='scalable')) = 11.05
2026-07-21 14:55:57 runnervm3jd5f matplotlib.font_manager[2874] DEBUG findfont: score(FontEntry(fname='/usr/share/fonts/truetype/dejavu/DejaVuSansCondensed-BoldOblique.ttf', index=0, name='DejaVu Sans', style='oblique', variant='normal', weight=700, stretch='condensed', size='scalable')) = 1.535
2026-07-21 14:55:57 runnervm3jd5f matplotlib.font_manager[2874] DEBUG findfont: score(FontEntry(fname='/usr/share/fonts/truetype/dejavu/DejaVuSansCondensed-BoldOblique.ttf', index=0, name='DejaVu Sans Condensed', style='oblique', variant='normal', weight=700, stretch='condensed', size='scalable')) = 11.535
2026-07-21 14:55:57 runnervm3jd5f matplotlib.font_manager[2874] DEBUG findfont: score(FontEntry(fname='/home/runner/micromamba/envs/trajan/fonts/SourceCodePro-It.ttf', index=0, name='Source Code Pro', style='italic', variant='normal', weight=400, stretch='normal', size='scalable')) = 11.05
2026-07-21 14:55:57 runnervm3jd5f matplotlib.font_manager[2874] DEBUG findfont: score(FontEntry(fname='/home/runner/micromamba/envs/trajan/fonts/SourceCodePro-ExtraLightIt.ttf', index=0, name='Source Code Pro', style='italic', variant='normal', weight=200, stretch='normal', size='scalable')) = 11.24
2026-07-21 14:55:57 runnervm3jd5f matplotlib.font_manager[2874] DEBUG findfont: score(FontEntry(fname='/home/runner/micromamba/envs/trajan/fonts/SourceCodePro-ExtraLightIt.ttf', index=0, name='Source Code Pro ExtraLight', style='italic', variant='normal', weight=400, stretch='normal', size='scalable')) = 11.05
2026-07-21 14:55:57 runnervm3jd5f matplotlib.font_manager[2874] DEBUG findfont: score(FontEntry(fname='/usr/share/fonts/truetype/lato/Lato-Medium.ttf', index=0, name='Lato', style='normal', variant='normal', weight=500, stretch='normal', size='scalable')) = 10.145
2026-07-21 14:55:57 runnervm3jd5f matplotlib.font_manager[2874] DEBUG findfont: score(FontEntry(fname='/usr/share/fonts/truetype/lato/Lato-Medium.ttf', index=0, name='Lato Medium', style='normal', variant='normal', weight=400, stretch='normal', size='scalable')) = 10.05
2026-07-21 14:55:57 runnervm3jd5f matplotlib.font_manager[2874] DEBUG findfont: score(FontEntry(fname='/usr/share/fonts/truetype/lato/Lato-BoldItalic.ttf', index=0, name='Lato', style='italic', variant='normal', weight=700, stretch='normal', size='scalable')) = 11.335
2026-07-21 14:55:57 runnervm3jd5f matplotlib.font_manager[2874] DEBUG findfont: score(FontEntry(fname='/home/runner/micromamba/envs/trajan/fonts/DejaVuSans.ttf', index=0, name='DejaVu Sans', style='normal', variant='normal', weight=400, stretch='normal', size='scalable')) = 0.05
2026-07-21 14:55:57 runnervm3jd5f matplotlib.font_manager[2874] DEBUG findfont: score(FontEntry(fname='/home/runner/micromamba/envs/trajan/fonts/UbuntuMono-B.ttf', index=0, name='Ubuntu Mono', style='normal', variant='normal', weight=700, stretch='normal', size='scalable')) = 10.335
2026-07-21 14:55:57 runnervm3jd5f matplotlib.font_manager[2874] DEBUG findfont: score(FontEntry(fname='/home/runner/micromamba/envs/trajan/fonts/SourceCodePro-LightIt.ttf', index=0, name='Source Code Pro', style='italic', variant='normal', weight=300, stretch='normal', size='scalable')) = 11.145
2026-07-21 14:55:57 runnervm3jd5f matplotlib.font_manager[2874] DEBUG findfont: score(FontEntry(fname='/home/runner/micromamba/envs/trajan/fonts/SourceCodePro-LightIt.ttf', index=0, name='Source Code Pro Light', style='italic', variant='normal', weight=400, stretch='normal', size='scalable')) = 11.05
2026-07-21 14:55:57 runnervm3jd5f matplotlib.font_manager[2874] DEBUG findfont: score(FontEntry(fname='/usr/share/fonts/truetype/liberation/LiberationSans-BoldItalic.ttf', index=0, name='Liberation Sans', style='italic', variant='normal', weight=700, stretch='normal', size='scalable')) = 11.335
2026-07-21 14:55:57 runnervm3jd5f matplotlib.font_manager[2874] DEBUG findfont: score(FontEntry(fname='/usr/share/fonts/truetype/liberation/LiberationSans-Regular.ttf', index=0, name='Liberation Sans', style='normal', variant='normal', weight=400, stretch='normal', size='scalable')) = 10.05
2026-07-21 14:55:57 runnervm3jd5f matplotlib.font_manager[2874] DEBUG findfont: score(FontEntry(fname='/usr/share/fonts/truetype/dejavu/DejaVuSansMono-Bold.ttf', index=0, name='DejaVu Sans Mono', style='normal', variant='normal', weight=700, stretch='normal', size='scalable')) = 10.335
2026-07-21 14:55:57 runnervm3jd5f matplotlib.font_manager[2874] DEBUG findfont: score(FontEntry(fname='/home/runner/micromamba/envs/trajan/fonts/SourceCodePro-BoldIt.ttf', index=0, name='Source Code Pro', style='italic', variant='normal', weight=700, stretch='normal', size='scalable')) = 11.335
2026-07-21 14:55:57 runnervm3jd5f matplotlib.font_manager[2874] DEBUG findfont: score(FontEntry(fname='/usr/share/fonts/truetype/lato/Lato-Bold.ttf', index=0, name='Lato', style='normal', variant='normal', weight=700, stretch='normal', size='scalable')) = 10.335
2026-07-21 14:55:57 runnervm3jd5f matplotlib.font_manager[2874] DEBUG findfont: score(FontEntry(fname='/usr/share/fonts/truetype/dejavu/DejaVuSansCondensed.ttf', index=0, name='DejaVu Sans', style='normal', variant='normal', weight=400, stretch='condensed', size='scalable')) = 0.25
2026-07-21 14:55:57 runnervm3jd5f matplotlib.font_manager[2874] DEBUG findfont: score(FontEntry(fname='/usr/share/fonts/truetype/dejavu/DejaVuSansCondensed.ttf', index=0, name='DejaVu Sans Condensed', style='normal', variant='normal', weight=380, stretch='condensed', size='scalable')) = 10.269
2026-07-21 14:55:57 runnervm3jd5f matplotlib.font_manager[2874] DEBUG findfont: score(FontEntry(fname='/usr/share/fonts/truetype/lato/Lato-MediumItalic.ttf', index=0, name='Lato', style='italic', variant='normal', weight=500, stretch='normal', size='scalable')) = 11.145
2026-07-21 14:55:57 runnervm3jd5f matplotlib.font_manager[2874] DEBUG findfont: score(FontEntry(fname='/usr/share/fonts/truetype/lato/Lato-MediumItalic.ttf', index=0, name='Lato Medium', style='italic', variant='normal', weight=400, stretch='normal', size='scalable')) = 11.05
2026-07-21 14:55:57 runnervm3jd5f matplotlib.font_manager[2874] DEBUG findfont: score(FontEntry(fname='/usr/share/fonts/truetype/liberation/LiberationSans-Bold.ttf', index=0, name='Liberation Sans', style='normal', variant='normal', weight=700, stretch='normal', size='scalable')) = 10.335
2026-07-21 14:55:57 runnervm3jd5f matplotlib.font_manager[2874] DEBUG findfont: score(FontEntry(fname='/usr/share/fonts/truetype/dejavu/DejaVuSerifCondensed-BoldItalic.ttf', index=0, name='DejaVu Serif', style='italic', variant='normal', weight=700, stretch='condensed', size='scalable')) = 11.535
2026-07-21 14:55:57 runnervm3jd5f matplotlib.font_manager[2874] DEBUG findfont: score(FontEntry(fname='/usr/share/fonts/truetype/dejavu/DejaVuSerifCondensed-BoldItalic.ttf', index=0, name='DejaVu Serif Condensed', style='italic', variant='normal', weight=700, stretch='condensed', size='scalable')) = 11.535
2026-07-21 14:55:57 runnervm3jd5f matplotlib.font_manager[2874] DEBUG findfont: score(FontEntry(fname='/home/runner/micromamba/envs/trajan/fonts/Ubuntu-R.ttf', index=0, name='Ubuntu', style='normal', variant='normal', weight=400, stretch='normal', size='scalable')) = 10.05
2026-07-21 14:55:57 runnervm3jd5f matplotlib.font_manager[2874] DEBUG findfont: score(FontEntry(fname='/usr/share/fonts/truetype/lato/Lato-Light.ttf', index=0, name='Lato', style='normal', variant='normal', weight=300, stretch='normal', size='scalable')) = 10.145
2026-07-21 14:55:57 runnervm3jd5f matplotlib.font_manager[2874] DEBUG findfont: score(FontEntry(fname='/usr/share/fonts/truetype/lato/Lato-Light.ttf', index=0, name='Lato Light', style='normal', variant='normal', weight=400, stretch='normal', size='scalable')) = 10.05
2026-07-21 14:55:57 runnervm3jd5f matplotlib.font_manager[2874] DEBUG findfont: score(FontEntry(fname='/usr/share/fonts/truetype/liberation/LiberationSerif-BoldItalic.ttf', index=0, name='Liberation Serif', style='italic', variant='normal', weight=700, stretch='normal', size='scalable')) = 11.335
2026-07-21 14:55:57 runnervm3jd5f matplotlib.font_manager[2874] DEBUG findfont: score(FontEntry(fname='/home/runner/micromamba/envs/trajan/fonts/Ubuntu-Th.ttf', index=0, name='Ubuntu', style='normal', variant='normal', weight=250, stretch='normal', size='scalable')) = 10.1925
2026-07-21 14:55:57 runnervm3jd5f matplotlib.font_manager[2874] DEBUG findfont: score(FontEntry(fname='/home/runner/micromamba/envs/trajan/fonts/Ubuntu-Th.ttf', index=0, name='Ubuntu Thin', style='normal', variant='normal', weight=400, stretch='normal', size='scalable')) = 10.05
2026-07-21 14:55:57 runnervm3jd5f matplotlib.font_manager[2874] DEBUG findfont: score(FontEntry(fname='/home/runner/micromamba/envs/trajan/fonts/SourceCodePro-ExtraLight.ttf', index=0, name='Source Code Pro', style='normal', variant='normal', weight=200, stretch='normal', size='scalable')) = 10.24
2026-07-21 14:55:57 runnervm3jd5f matplotlib.font_manager[2874] DEBUG findfont: score(FontEntry(fname='/home/runner/micromamba/envs/trajan/fonts/SourceCodePro-ExtraLight.ttf', index=0, name='Source Code Pro ExtraLight', style='normal', variant='normal', weight=400, stretch='normal', size='scalable')) = 10.05
2026-07-21 14:55:57 runnervm3jd5f matplotlib.font_manager[2874] DEBUG findfont: score(FontEntry(fname='/usr/share/fonts/truetype/lato/Lato-Thin.ttf', index=0, name='Lato', style='normal', variant='normal', weight=275, stretch='normal', size='scalable')) = 10.16875
2026-07-21 14:55:57 runnervm3jd5f matplotlib.font_manager[2874] DEBUG findfont: score(FontEntry(fname='/usr/share/fonts/truetype/lato/Lato-Thin.ttf', index=0, name='Lato Thin', style='normal', variant='normal', weight=400, stretch='normal', size='scalable')) = 10.05
2026-07-21 14:55:57 runnervm3jd5f matplotlib.font_manager[2874] DEBUG findfont: score(FontEntry(fname='/usr/share/fonts/truetype/liberation/LiberationSerif-Bold.ttf', index=0, name='Liberation Serif', style='normal', variant='normal', weight=700, stretch='normal', size='scalable')) = 10.335
2026-07-21 14:55:57 runnervm3jd5f matplotlib.font_manager[2874] DEBUG findfont: score(FontEntry(fname='/home/runner/micromamba/envs/trajan/fonts/Inconsolata-Regular.ttf', index=0, name='Inconsolata', style='normal', variant='normal', weight=400, stretch='normal', size='scalable')) = 10.05
2026-07-21 14:55:57 runnervm3jd5f matplotlib.font_manager[2874] DEBUG findfont: score(FontEntry(fname='/home/runner/micromamba/envs/trajan/fonts/Ubuntu-C.ttf', index=0, name='Ubuntu Condensed', style='normal', variant='normal', weight=400, stretch='condensed', size='scalable')) = 10.25
2026-07-21 14:55:57 runnervm3jd5f matplotlib.font_manager[2874] DEBUG findfont: score(FontEntry(fname='/usr/share/fonts/truetype/dejavu/DejaVuSansCondensed-Bold.ttf', index=0, name='DejaVu Sans', style='normal', variant='normal', weight=700, stretch='condensed', size='scalable')) = 0.5349999999999999
2026-07-21 14:55:57 runnervm3jd5f matplotlib.font_manager[2874] DEBUG findfont: score(FontEntry(fname='/usr/share/fonts/truetype/dejavu/DejaVuSansCondensed-Bold.ttf', index=0, name='DejaVu Sans Condensed', style='normal', variant='normal', weight=700, stretch='condensed', size='scalable')) = 10.535
2026-07-21 14:55:57 runnervm3jd5f matplotlib.font_manager[2874] DEBUG findfont: score(FontEntry(fname='/usr/share/fonts/truetype/liberation/LiberationMono-Bold.ttf', index=0, name='Liberation Mono', style='normal', variant='normal', weight=700, stretch='normal', size='scalable')) = 10.335
2026-07-21 14:55:57 runnervm3jd5f matplotlib.font_manager[2874] DEBUG findfont: score(FontEntry(fname='/home/runner/micromamba/envs/trajan/fonts/SourceCodePro-Black.ttf', index=0, name='Source Code Pro', style='normal', variant='normal', weight=900, stretch='normal', size='scalable')) = 10.525
2026-07-21 14:55:57 runnervm3jd5f matplotlib.font_manager[2874] DEBUG findfont: score(FontEntry(fname='/home/runner/micromamba/envs/trajan/fonts/SourceCodePro-Black.ttf', index=0, name='Source Code Pro Black', style='normal', variant='normal', weight=400, stretch='normal', size='scalable')) = 10.05
2026-07-21 14:55:57 runnervm3jd5f matplotlib.font_manager[2874] DEBUG findfont: score(FontEntry(fname='/home/runner/micromamba/envs/trajan/fonts/SourceCodePro-BlackIt.ttf', index=0, name='Source Code Pro', style='italic', variant='normal', weight=900, stretch='normal', size='scalable')) = 11.525
2026-07-21 14:55:57 runnervm3jd5f matplotlib.font_manager[2874] DEBUG findfont: score(FontEntry(fname='/home/runner/micromamba/envs/trajan/fonts/SourceCodePro-BlackIt.ttf', index=0, name='Source Code Pro Black', style='italic', variant='normal', weight=400, stretch='normal', size='scalable')) = 11.05
2026-07-21 14:55:57 runnervm3jd5f matplotlib.font_manager[2874] DEBUG findfont: score(FontEntry(fname='/home/runner/micromamba/envs/trajan/fonts/Ubuntu-LI.ttf', index=0, name='Ubuntu', style='italic', variant='normal', weight=300, stretch='normal', size='scalable')) = 11.145
2026-07-21 14:55:57 runnervm3jd5f matplotlib.font_manager[2874] DEBUG findfont: score(FontEntry(fname='/home/runner/micromamba/envs/trajan/fonts/Ubuntu-LI.ttf', index=0, name='Ubuntu Light', style='italic', variant='normal', weight=400, stretch='normal', size='scalable')) = 11.05
2026-07-21 14:55:57 runnervm3jd5f matplotlib.font_manager[2874] DEBUG findfont: score(FontEntry(fname='/usr/share/fonts/truetype/liberation/LiberationMono-Regular.ttf', index=0, name='Liberation Mono', style='normal', variant='normal', weight=400, stretch='normal', size='scalable')) = 10.05
2026-07-21 14:55:57 runnervm3jd5f matplotlib.font_manager[2874] DEBUG findfont: score(FontEntry(fname='/home/runner/micromamba/envs/trajan/fonts/UbuntuMono-RI.ttf', index=0, name='Ubuntu Mono', style='italic', variant='normal', weight=400, stretch='normal', size='scalable')) = 11.05
2026-07-21 14:55:57 runnervm3jd5f matplotlib.font_manager[2874] DEBUG findfont: score(FontEntry(fname='/usr/share/fonts/truetype/lato/Lato-Heavy.ttf', index=0, name='Lato', style='normal', variant='normal', weight=800, stretch='normal', size='scalable')) = 10.43
2026-07-21 14:55:57 runnervm3jd5f matplotlib.font_manager[2874] DEBUG findfont: score(FontEntry(fname='/usr/share/fonts/truetype/lato/Lato-Heavy.ttf', index=0, name='Lato Heavy', style='normal', variant='normal', weight=400, stretch='normal', size='scalable')) = 10.05
2026-07-21 14:55:57 runnervm3jd5f matplotlib.font_manager[2874] DEBUG findfont: score(FontEntry(fname='/usr/share/fonts/truetype/lato/Lato-HairlineItalic.ttf', index=0, name='Lato', style='italic', variant='normal', weight=250, stretch='normal', size='scalable')) = 11.1925
2026-07-21 14:55:57 runnervm3jd5f matplotlib.font_manager[2874] DEBUG findfont: score(FontEntry(fname='/usr/share/fonts/truetype/lato/Lato-HairlineItalic.ttf', index=0, name='Lato Hairline', style='italic', variant='normal', weight=400, stretch='normal', size='scalable')) = 11.05
2026-07-21 14:55:57 runnervm3jd5f matplotlib.font_manager[2874] DEBUG findfont: score(FontEntry(fname='/usr/share/fonts/truetype/dejavu/DejaVuSerifCondensed-Bold.ttf', index=0, name='DejaVu Serif', style='normal', variant='normal', weight=700, stretch='condensed', size='scalable')) = 10.535
2026-07-21 14:55:57 runnervm3jd5f matplotlib.font_manager[2874] DEBUG findfont: score(FontEntry(fname='/usr/share/fonts/truetype/dejavu/DejaVuSerifCondensed-Bold.ttf', index=0, name='DejaVu Serif Condensed', style='normal', variant='normal', weight=700, stretch='condensed', size='scalable')) = 10.535
2026-07-21 14:55:57 runnervm3jd5f matplotlib.font_manager[2874] DEBUG findfont: score(FontEntry(fname='/usr/share/fonts/truetype/dejavu/DejaVuSansCondensed-Oblique.ttf', index=0, name='DejaVu Sans', style='oblique', variant='normal', weight=400, stretch='condensed', size='scalable')) = 1.25
2026-07-21 14:55:57 runnervm3jd5f matplotlib.font_manager[2874] DEBUG findfont: score(FontEntry(fname='/usr/share/fonts/truetype/dejavu/DejaVuSansCondensed-Oblique.ttf', index=0, name='DejaVu Sans Condensed', style='oblique', variant='normal', weight=400, stretch='condensed', size='scalable')) = 11.25
2026-07-21 14:55:57 runnervm3jd5f matplotlib.font_manager[2874] DEBUG findfont: score(FontEntry(fname='/usr/share/fonts/truetype/lato/Lato-SemiboldItalic.ttf', index=0, name='Lato', style='italic', variant='normal', weight=600, stretch='normal', size='scalable')) = 11.24
2026-07-21 14:55:57 runnervm3jd5f matplotlib.font_manager[2874] DEBUG findfont: score(FontEntry(fname='/usr/share/fonts/truetype/lato/Lato-SemiboldItalic.ttf', index=0, name='Lato Semibold', style='italic', variant='normal', weight=400, stretch='normal', size='scalable')) = 11.05
2026-07-21 14:55:57 runnervm3jd5f matplotlib.font_manager[2874] DEBUG findfont: score(FontEntry(fname='/usr/share/fonts/truetype/lato/Lato-Semibold.ttf', index=0, name='Lato', style='normal', variant='normal', weight=600, stretch='normal', size='scalable')) = 10.24
2026-07-21 14:55:57 runnervm3jd5f matplotlib.font_manager[2874] DEBUG findfont: score(FontEntry(fname='/usr/share/fonts/truetype/lato/Lato-Semibold.ttf', index=0, name='Lato Semibold', style='normal', variant='normal', weight=400, stretch='normal', size='scalable')) = 10.05
2026-07-21 14:55:57 runnervm3jd5f matplotlib.font_manager[2874] DEBUG findfont: score(FontEntry(fname='/home/runner/micromamba/envs/trajan/fonts/Inconsolata-Bold.ttf', index=0, name='Inconsolata', style='normal', variant='normal', weight=700, stretch='normal', size='scalable')) = 10.335
2026-07-21 14:55:57 runnervm3jd5f matplotlib.font_manager[2874] DEBUG findfont: score(FontEntry(fname='/usr/share/fonts/truetype/dejavu/DejaVuSans-ExtraLight.ttf', index=0, name='DejaVu Sans', style='normal', variant='normal', weight=200, stretch='normal', size='scalable')) = 0.24
2026-07-21 14:55:57 runnervm3jd5f matplotlib.font_manager[2874] DEBUG findfont: score(FontEntry(fname='/usr/share/fonts/truetype/dejavu/DejaVuSans-ExtraLight.ttf', index=0, name='DejaVu Sans Light', style='normal', variant='normal', weight=200, stretch='normal', size='scalable')) = 10.24
2026-07-21 14:55:57 runnervm3jd5f matplotlib.font_manager[2874] DEBUG findfont: score(FontEntry(fname='/home/runner/micromamba/envs/trajan/fonts/Ubuntu-BI.ttf', index=0, name='Ubuntu', style='italic', variant='normal', weight=700, stretch='normal', size='scalable')) = 11.335
2026-07-21 14:55:57 runnervm3jd5f matplotlib.font_manager[2874] DEBUG findfont: score(FontEntry(fname='/usr/share/fonts/truetype/dejavu/DejaVuSans-BoldOblique.ttf', index=0, name='DejaVu Sans', style='oblique', variant='normal', weight=700, stretch='normal', size='scalable')) = 1.335
2026-07-21 14:55:57 runnervm3jd5f matplotlib.font_manager[2874] DEBUG findfont: score(FontEntry(fname='/home/runner/micromamba/envs/trajan/fonts/Ubuntu-RI.ttf', index=0, name='Ubuntu', style='italic', variant='normal', weight=400, stretch='normal', size='scalable')) = 11.05
2026-07-21 14:55:57 runnervm3jd5f matplotlib.font_manager[2874] DEBUG findfont: score(FontEntry(fname='/usr/share/fonts/truetype/dejavu/DejaVuSerif-Italic.ttf', index=0, name='DejaVu Serif', style='italic', variant='normal', weight=400, stretch='normal', size='scalable')) = 11.05
2026-07-21 14:55:57 runnervm3jd5f matplotlib.font_manager[2874] DEBUG findfont: score(FontEntry(fname='/home/runner/micromamba/envs/trajan/fonts/SourceCodePro-Medium.ttf', index=0, name='Source Code Pro', style='normal', variant='normal', weight=500, stretch='normal', size='scalable')) = 10.145
2026-07-21 14:55:57 runnervm3jd5f matplotlib.font_manager[2874] DEBUG findfont: score(FontEntry(fname='/home/runner/micromamba/envs/trajan/fonts/SourceCodePro-Medium.ttf', index=0, name='Source Code Pro Medium', style='normal', variant='normal', weight=400, stretch='normal', size='scalable')) = 10.05
2026-07-21 14:55:57 runnervm3jd5f matplotlib.font_manager[2874] DEBUG findfont: score(FontEntry(fname='/usr/share/fonts/truetype/lato/Lato-HeavyItalic.ttf', index=0, name='Lato', style='italic', variant='normal', weight=800, stretch='normal', size='scalable')) = 11.43
2026-07-21 14:55:57 runnervm3jd5f matplotlib.font_manager[2874] DEBUG findfont: score(FontEntry(fname='/usr/share/fonts/truetype/lato/Lato-HeavyItalic.ttf', index=0, name='Lato Heavy', style='italic', variant='normal', weight=400, stretch='normal', size='scalable')) = 11.05
2026-07-21 14:55:57 runnervm3jd5f matplotlib.font_manager[2874] DEBUG findfont: score(FontEntry(fname='/usr/share/fonts/truetype/dejavu/DejaVuSans-Oblique.ttf', index=0, name='DejaVu Sans', style='oblique', variant='normal', weight=400, stretch='normal', size='scalable')) = 1.05
2026-07-21 14:55:57 runnervm3jd5f matplotlib.font_manager[2874] DEBUG findfont: score(FontEntry(fname='/home/runner/micromamba/envs/trajan/fonts/Ubuntu-M.ttf', index=0, name='Ubuntu', style='normal', variant='normal', weight=500, stretch='normal', size='scalable')) = 10.145
2026-07-21 14:55:57 runnervm3jd5f matplotlib.font_manager[2874] DEBUG findfont: score(FontEntry(fname='/home/runner/micromamba/envs/trajan/fonts/Ubuntu-M.ttf', index=0, name='Ubuntu Light', style='normal', variant='normal', weight=700, stretch='normal', size='scalable')) = 10.335
2026-07-21 14:55:57 runnervm3jd5f matplotlib.font_manager[2874] DEBUG findfont: score(FontEntry(fname='/usr/share/fonts/truetype/liberation/LiberationMono-BoldItalic.ttf', index=0, name='Liberation Mono', style='italic', variant='normal', weight=700, stretch='normal', size='scalable')) = 11.335
2026-07-21 14:55:57 runnervm3jd5f matplotlib.font_manager[2874] DEBUG findfont: score(FontEntry(fname='/usr/share/fonts/truetype/dejavu/DejaVuSansMono.ttf', index=0, name='DejaVu Sans Mono', style='normal', variant='normal', weight=400, stretch='normal', size='scalable')) = 10.05
2026-07-21 14:55:57 runnervm3jd5f matplotlib.font_manager[2874] DEBUG findfont: score(FontEntry(fname='/usr/share/fonts/truetype/dejavu/DejaVuMathTeXGyre.ttf', index=0, name='DejaVu Math TeX Gyre', style='normal', variant='normal', weight=400, stretch='normal', size='scalable')) = 10.05
2026-07-21 14:55:57 runnervm3jd5f matplotlib.font_manager[2874] DEBUG findfont: score(FontEntry(fname='/usr/share/fonts/truetype/dejavu/DejaVuSansMono-Oblique.ttf', index=0, name='DejaVu Sans Mono', style='oblique', variant='normal', weight=400, stretch='normal', size='scalable')) = 11.05
2026-07-21 14:55:57 runnervm3jd5f matplotlib.font_manager[2874] DEBUG findfont: score(FontEntry(fname='/home/runner/micromamba/envs/trajan/fonts/Ubuntu-L.ttf', index=0, name='Ubuntu', style='normal', variant='normal', weight=300, stretch='normal', size='scalable')) = 10.145
2026-07-21 14:55:57 runnervm3jd5f matplotlib.font_manager[2874] DEBUG findfont: score(FontEntry(fname='/home/runner/micromamba/envs/trajan/fonts/Ubuntu-L.ttf', index=0, name='Ubuntu Light', style='normal', variant='normal', weight=400, stretch='normal', size='scalable')) = 10.05
2026-07-21 14:55:57 runnervm3jd5f matplotlib.font_manager[2874] DEBUG findfont: score(FontEntry(fname='/home/runner/micromamba/envs/trajan/fonts/SourceCodePro-MediumIt.ttf', index=0, name='Source Code Pro', style='italic', variant='normal', weight=500, stretch='normal', size='scalable')) = 11.145
2026-07-21 14:55:57 runnervm3jd5f matplotlib.font_manager[2874] DEBUG findfont: score(FontEntry(fname='/home/runner/micromamba/envs/trajan/fonts/SourceCodePro-MediumIt.ttf', index=0, name='Source Code Pro Medium', style='italic', variant='normal', weight=400, stretch='normal', size='scalable')) = 11.05
2026-07-21 14:55:57 runnervm3jd5f matplotlib.font_manager[2874] DEBUG findfont: score(FontEntry(fname='/home/runner/micromamba/envs/trajan/fonts/SourceCodePro-Regular.ttf', index=0, name='Source Code Pro', style='normal', variant='normal', weight=400, stretch='normal', size='scalable')) = 10.05
2026-07-21 14:55:57 runnervm3jd5f matplotlib.font_manager[2874] DEBUG findfont: score(FontEntry(fname='/home/runner/micromamba/envs/trajan/fonts/SourceCodePro-SemiboldIt.ttf', index=0, name='Source Code Pro', style='italic', variant='normal', weight=600, stretch='normal', size='scalable')) = 11.24
2026-07-21 14:55:57 runnervm3jd5f matplotlib.font_manager[2874] DEBUG findfont: score(FontEntry(fname='/home/runner/micromamba/envs/trajan/fonts/SourceCodePro-SemiboldIt.ttf', index=0, name='Source Code Pro Semibold', style='italic', variant='normal', weight=400, stretch='normal', size='scalable')) = 11.05
2026-07-21 14:55:57 runnervm3jd5f matplotlib.font_manager[2874] DEBUG findfont: score(FontEntry(fname='/usr/share/fonts/truetype/dejavu/DejaVuSerif.ttf', index=0, name='DejaVu Serif', style='normal', variant='normal', weight=400, stretch='normal', size='scalable')) = 10.05
2026-07-21 14:55:57 runnervm3jd5f matplotlib.font_manager[2874] DEBUG findfont: score(FontEntry(fname='/usr/share/fonts/truetype/dejavu/DejaVuSerif-Bold.ttf', index=0, name='DejaVu Serif', style='normal', variant='normal', weight=700, stretch='normal', size='scalable')) = 10.335
2026-07-21 14:55:57 runnervm3jd5f matplotlib.font_manager[2874] DEBUG findfont: score(FontEntry(fname='/usr/share/fonts/truetype/liberation/LiberationSerif-Italic.ttf', index=0, name='Liberation Serif', style='italic', variant='normal', weight=400, stretch='normal', size='scalable')) = 11.05
2026-07-21 14:55:57 runnervm3jd5f matplotlib.font_manager[2874] DEBUG findfont: score(FontEntry(fname='/usr/share/fonts/truetype/dejavu/DejaVuSansMono-BoldOblique.ttf', index=0, name='DejaVu Sans Mono', style='oblique', variant='normal', weight=700, stretch='normal', size='scalable')) = 11.335
2026-07-21 14:55:57 runnervm3jd5f matplotlib.font_manager[2874] DEBUG findfont: score(FontEntry(fname='/home/runner/micromamba/envs/trajan/fonts/SourceCodePro-Light.ttf', index=0, name='Source Code Pro', style='normal', variant='normal', weight=300, stretch='normal', size='scalable')) = 10.145
2026-07-21 14:55:57 runnervm3jd5f matplotlib.font_manager[2874] DEBUG findfont: score(FontEntry(fname='/home/runner/micromamba/envs/trajan/fonts/SourceCodePro-Light.ttf', index=0, name='Source Code Pro Light', style='normal', variant='normal', weight=400, stretch='normal', size='scalable')) = 10.05
2026-07-21 14:55:57 runnervm3jd5f matplotlib.font_manager[2874] DEBUG findfont: score(FontEntry(fname='/usr/share/fonts/truetype/liberation/LiberationMono-Italic.ttf', index=0, name='Liberation Mono', style='italic', variant='normal', weight=400, stretch='normal', size='scalable')) = 11.05
2026-07-21 14:55:57 runnervm3jd5f matplotlib.font_manager[2874] DEBUG findfont: Matching sans\-serif:style=normal:variant=normal:weight=normal:stretch=normal:size=10.0 to DejaVu Sans ('/home/runner/micromamba/envs/trajan/lib/python3.14/site-packages/matplotlib/mpl-data/fonts/ttf/DejaVuSans.ttf') with score of 0.050000.
2026-07-21 14:55:57 runnervm3jd5f matplotlib.font_manager[2874] DEBUG findfont: Matching STIXGeneral:style=normal:variant=normal:weight=normal:stretch=normal:size=10.0.
2026-07-21 14:55:57 runnervm3jd5f matplotlib.font_manager[2874] DEBUG findfont: score(FontEntry(fname='/home/runner/micromamba/envs/trajan/lib/python3.14/site-packages/matplotlib/mpl-data/fonts/ttf/cmmi10.ttf', index=0, name='cmmi10', style='normal', variant='normal', weight=400, stretch='normal', size='scalable')) = 10.05
2026-07-21 14:55:57 runnervm3jd5f matplotlib.font_manager[2874] DEBUG findfont: score(FontEntry(fname='/home/runner/micromamba/envs/trajan/lib/python3.14/site-packages/matplotlib/mpl-data/fonts/ttf/DejaVuSerif-Bold.ttf', index=0, name='DejaVu Serif', style='normal', variant='normal', weight=700, stretch='normal', size='scalable')) = 10.335
2026-07-21 14:55:57 runnervm3jd5f matplotlib.font_manager[2874] DEBUG findfont: score(FontEntry(fname='/home/runner/micromamba/envs/trajan/lib/python3.14/site-packages/matplotlib/mpl-data/fonts/ttf/DejaVuSans-Oblique.ttf', index=0, name='DejaVu Sans', style='oblique', variant='normal', weight=400, stretch='normal', size='scalable')) = 11.05
2026-07-21 14:55:57 runnervm3jd5f matplotlib.font_manager[2874] DEBUG findfont: score(FontEntry(fname='/home/runner/micromamba/envs/trajan/lib/python3.14/site-packages/matplotlib/mpl-data/fonts/ttf/STIXSizThreeSymReg.ttf', index=0, name='STIXSizeThreeSym', style='normal', variant='normal', weight=400, stretch='normal', size='scalable')) = 10.05
2026-07-21 14:55:57 runnervm3jd5f matplotlib.font_manager[2874] DEBUG findfont: score(FontEntry(fname='/home/runner/micromamba/envs/trajan/lib/python3.14/site-packages/matplotlib/mpl-data/fonts/ttf/STIXNonUniBolIta.ttf', index=0, name='STIXNonUnicode', style='italic', variant='normal', weight=700, stretch='normal', size='scalable')) = 11.335
2026-07-21 14:55:57 runnervm3jd5f matplotlib.font_manager[2874] DEBUG findfont: score(FontEntry(fname='/home/runner/micromamba/envs/trajan/lib/python3.14/site-packages/matplotlib/mpl-data/fonts/ttf/DejaVuSerifDisplay.ttf', index=0, name='DejaVu Serif Display', style='normal', variant='normal', weight=400, stretch='normal', size='scalable')) = 10.05
2026-07-21 14:55:57 runnervm3jd5f matplotlib.font_manager[2874] DEBUG findfont: score(FontEntry(fname='/home/runner/micromamba/envs/trajan/lib/python3.14/site-packages/matplotlib/mpl-data/fonts/ttf/cmss10.ttf', index=0, name='cmss10', style='normal', variant='normal', weight=400, stretch='normal', size='scalable')) = 10.05
2026-07-21 14:55:57 runnervm3jd5f matplotlib.font_manager[2874] DEBUG findfont: score(FontEntry(fname='/home/runner/micromamba/envs/trajan/lib/python3.14/site-packages/matplotlib/mpl-data/fonts/ttf/STIXGeneralBolIta.ttf', index=0, name='STIXGeneral', style='italic', variant='normal', weight=700, stretch='normal', size='scalable')) = 1.335
2026-07-21 14:55:57 runnervm3jd5f matplotlib.font_manager[2874] DEBUG findfont: score(FontEntry(fname='/home/runner/micromamba/envs/trajan/lib/python3.14/site-packages/matplotlib/mpl-data/fonts/ttf/cmtt10.ttf', index=0, name='cmtt10', style='normal', variant='normal', weight=400, stretch='normal', size='scalable')) = 10.05
2026-07-21 14:55:57 runnervm3jd5f matplotlib.font_manager[2874] DEBUG findfont: score(FontEntry(fname='/home/runner/micromamba/envs/trajan/lib/python3.14/site-packages/matplotlib/mpl-data/fonts/ttf/cmsy10.ttf', index=0, name='cmsy10', style='normal', variant='normal', weight=400, stretch='normal', size='scalable')) = 10.05
2026-07-21 14:55:57 runnervm3jd5f matplotlib.font_manager[2874] DEBUG findfont: score(FontEntry(fname='/home/runner/micromamba/envs/trajan/lib/python3.14/site-packages/matplotlib/mpl-data/fonts/ttf/DejaVuSansMono-Oblique.ttf', index=0, name='DejaVu Sans Mono', style='oblique', variant='normal', weight=400, stretch='normal', size='scalable')) = 11.05
2026-07-21 14:55:57 runnervm3jd5f matplotlib.font_manager[2874] DEBUG findfont: score(FontEntry(fname='/home/runner/micromamba/envs/trajan/lib/python3.14/site-packages/matplotlib/mpl-data/fonts/ttf/STIXNonUniIta.ttf', index=0, name='STIXNonUnicode', style='italic', variant='normal', weight=400, stretch='normal', size='scalable')) = 11.05
2026-07-21 14:55:57 runnervm3jd5f matplotlib.font_manager[2874] DEBUG findfont: score(FontEntry(fname='/home/runner/micromamba/envs/trajan/lib/python3.14/site-packages/matplotlib/mpl-data/fonts/ttf/STIXGeneral.ttf', index=0, name='STIXGeneral', style='normal', variant='normal', weight=400, stretch='normal', size='scalable')) = 0.05
2026-07-21 14:55:57 runnervm3jd5f matplotlib.font_manager[2874] DEBUG findfont: score(FontEntry(fname='/home/runner/micromamba/envs/trajan/lib/python3.14/site-packages/matplotlib/mpl-data/fonts/ttf/cmti10.ttf', index=0, name='cmti10', style='normal', variant='normal', weight=400, stretch='normal', size='scalable')) = 10.05
2026-07-21 14:55:57 runnervm3jd5f matplotlib.font_manager[2874] DEBUG findfont: score(FontEntry(fname='/home/runner/micromamba/envs/trajan/lib/python3.14/site-packages/matplotlib/mpl-data/fonts/ttf/DejaVuSansMono-BoldOblique.ttf', index=0, name='DejaVu Sans Mono', style='oblique', variant='normal', weight=700, stretch='normal', size='scalable')) = 11.335
2026-07-21 14:55:57 runnervm3jd5f matplotlib.font_manager[2874] DEBUG findfont: score(FontEntry(fname='/home/runner/micromamba/envs/trajan/lib/python3.14/site-packages/matplotlib/mpl-data/fonts/ttf/DejaVuSerif.ttf', index=0, name='DejaVu Serif', style='normal', variant='normal', weight=400, stretch='normal', size='scalable')) = 10.05
2026-07-21 14:55:57 runnervm3jd5f matplotlib.font_manager[2874] DEBUG findfont: score(FontEntry(fname='/home/runner/micromamba/envs/trajan/lib/python3.14/site-packages/matplotlib/mpl-data/fonts/ttf/LastResortHE-Regular.ttf', index=0, name='Last Resort High-Efficiency', style='normal', variant='normal', weight=400, stretch='normal', size='scalable')) = 10.05
2026-07-21 14:55:57 runnervm3jd5f matplotlib.font_manager[2874] DEBUG findfont: score(FontEntry(fname='/home/runner/micromamba/envs/trajan/lib/python3.14/site-packages/matplotlib/mpl-data/fonts/ttf/cmex10.ttf', index=0, name='cmex10', style='normal', variant='normal', weight=400, stretch='normal', size='scalable')) = 10.05
2026-07-21 14:55:57 runnervm3jd5f matplotlib.font_manager[2874] DEBUG findfont: score(FontEntry(fname='/home/runner/micromamba/envs/trajan/lib/python3.14/site-packages/matplotlib/mpl-data/fonts/ttf/STIXSizFiveSymReg.ttf', index=0, name='STIXSizeFiveSym', style='normal', variant='normal', weight=400, stretch='normal', size='scalable')) = 10.05
2026-07-21 14:55:57 runnervm3jd5f matplotlib.font_manager[2874] DEBUG findfont: score(FontEntry(fname='/home/runner/micromamba/envs/trajan/lib/python3.14/site-packages/matplotlib/mpl-data/fonts/ttf/STIXNonUniBol.ttf', index=0, name='STIXNonUnicode', style='normal', variant='normal', weight=700, stretch='normal', size='scalable')) = 10.335
2026-07-21 14:55:57 runnervm3jd5f matplotlib.font_manager[2874] DEBUG findfont: score(FontEntry(fname='/home/runner/micromamba/envs/trajan/lib/python3.14/site-packages/matplotlib/mpl-data/fonts/ttf/DejaVuSansDisplay.ttf', index=0, name='DejaVu Sans Display', style='normal', variant='normal', weight=400, stretch='normal', size='scalable')) = 10.05
2026-07-21 14:55:57 runnervm3jd5f matplotlib.font_manager[2874] DEBUG findfont: score(FontEntry(fname='/home/runner/micromamba/envs/trajan/lib/python3.14/site-packages/matplotlib/mpl-data/fonts/ttf/DejaVuSansMono.ttf', index=0, name='DejaVu Sans Mono', style='normal', variant='normal', weight=400, stretch='normal', size='scalable')) = 10.05
2026-07-21 14:55:57 runnervm3jd5f matplotlib.font_manager[2874] DEBUG findfont: score(FontEntry(fname='/home/runner/micromamba/envs/trajan/lib/python3.14/site-packages/matplotlib/mpl-data/fonts/ttf/cmb10.ttf', index=0, name='cmb10', style='normal', variant='normal', weight=400, stretch='normal', size='scalable')) = 10.05
2026-07-21 14:55:57 runnervm3jd5f matplotlib.font_manager[2874] DEBUG findfont: score(FontEntry(fname='/home/runner/micromamba/envs/trajan/lib/python3.14/site-packages/matplotlib/mpl-data/fonts/ttf/STIXSizTwoSymReg.ttf', index=0, name='STIXSizeTwoSym', style='normal', variant='normal', weight=400, stretch='normal', size='scalable')) = 10.05
2026-07-21 14:55:57 runnervm3jd5f matplotlib.font_manager[2874] DEBUG findfont: score(FontEntry(fname='/home/runner/micromamba/envs/trajan/lib/python3.14/site-packages/matplotlib/mpl-data/fonts/ttf/DejaVuSans.ttf', index=0, name='DejaVu Sans', style='normal', variant='normal', weight=400, stretch='normal', size='scalable')) = 10.05
2026-07-21 14:55:57 runnervm3jd5f matplotlib.font_manager[2874] DEBUG findfont: score(FontEntry(fname='/home/runner/micromamba/envs/trajan/lib/python3.14/site-packages/matplotlib/mpl-data/fonts/ttf/STIXNonUni.ttf', index=0, name='STIXNonUnicode', style='normal', variant='normal', weight=400, stretch='normal', size='scalable')) = 10.05
2026-07-21 14:55:57 runnervm3jd5f matplotlib.font_manager[2874] DEBUG findfont: score(FontEntry(fname='/home/runner/micromamba/envs/trajan/lib/python3.14/site-packages/matplotlib/mpl-data/fonts/ttf/STIXGeneralItalic.ttf', index=0, name='STIXGeneral', style='italic', variant='normal', weight=400, stretch='normal', size='scalable')) = 1.05
2026-07-21 14:55:57 runnervm3jd5f matplotlib.font_manager[2874] DEBUG findfont: score(FontEntry(fname='/home/runner/micromamba/envs/trajan/lib/python3.14/site-packages/matplotlib/mpl-data/fonts/ttf/STIXSizOneSymBol.ttf', index=0, name='STIXSizeOneSym', style='normal', variant='normal', weight=700, stretch='normal', size='scalable')) = 10.335
2026-07-21 14:55:57 runnervm3jd5f matplotlib.font_manager[2874] DEBUG findfont: score(FontEntry(fname='/home/runner/micromamba/envs/trajan/lib/python3.14/site-packages/matplotlib/mpl-data/fonts/ttf/DejaVuSansMono-Bold.ttf', index=0, name='DejaVu Sans Mono', style='normal', variant='normal', weight=700, stretch='normal', size='scalable')) = 10.335
2026-07-21 14:55:57 runnervm3jd5f matplotlib.font_manager[2874] DEBUG findfont: score(FontEntry(fname='/home/runner/micromamba/envs/trajan/lib/python3.14/site-packages/matplotlib/mpl-data/fonts/ttf/STIXSizTwoSymBol.ttf', index=0, name='STIXSizeTwoSym', style='normal', variant='normal', weight=700, stretch='normal', size='scalable')) = 10.335
2026-07-21 14:55:57 runnervm3jd5f matplotlib.font_manager[2874] DEBUG findfont: score(FontEntry(fname='/home/runner/micromamba/envs/trajan/lib/python3.14/site-packages/matplotlib/mpl-data/fonts/ttf/STIXSizThreeSymBol.ttf', index=0, name='STIXSizeThreeSym', style='normal', variant='normal', weight=700, stretch='normal', size='scalable')) = 10.335
2026-07-21 14:55:57 runnervm3jd5f matplotlib.font_manager[2874] DEBUG findfont: score(FontEntry(fname='/home/runner/micromamba/envs/trajan/lib/python3.14/site-packages/matplotlib/mpl-data/fonts/ttf/DejaVuSerif-BoldItalic.ttf', index=0, name='DejaVu Serif', style='italic', variant='normal', weight=700, stretch='normal', size='scalable')) = 11.335
2026-07-21 14:55:57 runnervm3jd5f matplotlib.font_manager[2874] DEBUG findfont: score(FontEntry(fname='/home/runner/micromamba/envs/trajan/lib/python3.14/site-packages/matplotlib/mpl-data/fonts/ttf/DejaVuSerif-Italic.ttf', index=0, name='DejaVu Serif', style='italic', variant='normal', weight=400, stretch='normal', size='scalable')) = 11.05
2026-07-21 14:55:57 runnervm3jd5f matplotlib.font_manager[2874] DEBUG findfont: score(FontEntry(fname='/home/runner/micromamba/envs/trajan/lib/python3.14/site-packages/matplotlib/mpl-data/fonts/ttf/DejaVuSans-Bold.ttf', index=0, name='DejaVu Sans', style='normal', variant='normal', weight=700, stretch='normal', size='scalable')) = 10.335
2026-07-21 14:55:57 runnervm3jd5f matplotlib.font_manager[2874] DEBUG findfont: score(FontEntry(fname='/home/runner/micromamba/envs/trajan/lib/python3.14/site-packages/matplotlib/mpl-data/fonts/ttf/STIXSizFourSymBol.ttf', index=0, name='STIXSizeFourSym', style='normal', variant='normal', weight=700, stretch='normal', size='scalable')) = 10.335
2026-07-21 14:55:57 runnervm3jd5f matplotlib.font_manager[2874] DEBUG findfont: score(FontEntry(fname='/home/runner/micromamba/envs/trajan/lib/python3.14/site-packages/matplotlib/mpl-data/fonts/ttf/STIXSizOneSymReg.ttf', index=0, name='STIXSizeOneSym', style='normal', variant='normal', weight=400, stretch='normal', size='scalable')) = 10.05
2026-07-21 14:55:57 runnervm3jd5f matplotlib.font_manager[2874] DEBUG findfont: score(FontEntry(fname='/home/runner/micromamba/envs/trajan/lib/python3.14/site-packages/matplotlib/mpl-data/fonts/ttf/cmr10.ttf', index=0, name='cmr10', style='normal', variant='normal', weight=400, stretch='normal', size='scalable')) = 10.05
2026-07-21 14:55:57 runnervm3jd5f matplotlib.font_manager[2874] DEBUG findfont: score(FontEntry(fname='/home/runner/micromamba/envs/trajan/lib/python3.14/site-packages/matplotlib/mpl-data/fonts/ttf/STIXGeneralBol.ttf', index=0, name='STIXGeneral', style='normal', variant='normal', weight=700, stretch='normal', size='scalable')) = 0.33499999999999996
2026-07-21 14:55:57 runnervm3jd5f matplotlib.font_manager[2874] DEBUG findfont: score(FontEntry(fname='/home/runner/micromamba/envs/trajan/lib/python3.14/site-packages/matplotlib/mpl-data/fonts/ttf/DejaVuSans-BoldOblique.ttf', index=0, name='DejaVu Sans', style='oblique', variant='normal', weight=700, stretch='normal', size='scalable')) = 11.335
2026-07-21 14:55:57 runnervm3jd5f matplotlib.font_manager[2874] DEBUG findfont: score(FontEntry(fname='/home/runner/micromamba/envs/trajan/lib/python3.14/site-packages/matplotlib/mpl-data/fonts/ttf/STIXSizFourSymReg.ttf', index=0, name='STIXSizeFourSym', style='normal', variant='normal', weight=400, stretch='normal', size='scalable')) = 10.05
2026-07-21 14:55:57 runnervm3jd5f matplotlib.font_manager[2874] DEBUG findfont: score(FontEntry(fname='/usr/share/fonts/truetype/lato/Lato-Black.ttf', index=0, name='Lato', style='normal', variant='normal', weight=900, stretch='normal', size='scalable')) = 10.525
2026-07-21 14:55:57 runnervm3jd5f matplotlib.font_manager[2874] DEBUG findfont: score(FontEntry(fname='/usr/share/fonts/truetype/lato/Lato-Black.ttf', index=0, name='Lato Black', style='normal', variant='normal', weight=400, stretch='normal', size='scalable')) = 10.05
2026-07-21 14:55:57 runnervm3jd5f matplotlib.font_manager[2874] DEBUG findfont: score(FontEntry(fname='/usr/share/fonts/truetype/liberation/LiberationSerif-Regular.ttf', index=0, name='Liberation Serif', style='normal', variant='normal', weight=400, stretch='normal', size='scalable')) = 10.05
2026-07-21 14:55:57 runnervm3jd5f matplotlib.font_manager[2874] DEBUG findfont: score(FontEntry(fname='/usr/share/fonts/truetype/dejavu/DejaVuSerifCondensed.ttf', index=0, name='DejaVu Serif', style='normal', variant='normal', weight=400, stretch='condensed', size='scalable')) = 10.25
2026-07-21 14:55:57 runnervm3jd5f matplotlib.font_manager[2874] DEBUG findfont: score(FontEntry(fname='/usr/share/fonts/truetype/dejavu/DejaVuSerifCondensed.ttf', index=0, name='DejaVu Serif Condensed', style='normal', variant='normal', weight=380, stretch='condensed', size='scalable')) = 10.269
2026-07-21 14:55:57 runnervm3jd5f matplotlib.font_manager[2874] DEBUG findfont: score(FontEntry(fname='/home/runner/micromamba/envs/trajan/fonts/UbuntuMono-BI.ttf', index=0, name='Ubuntu Mono', style='italic', variant='normal', weight=700, stretch='normal', size='scalable')) = 11.335
2026-07-21 14:55:57 runnervm3jd5f matplotlib.font_manager[2874] DEBUG findfont: score(FontEntry(fname='/usr/share/fonts/truetype/dejavu/DejaVuSans.ttf', index=0, name='DejaVu Sans', style='normal', variant='normal', weight=400, stretch='normal', size='scalable')) = 10.05
2026-07-21 14:55:57 runnervm3jd5f matplotlib.font_manager[2874] DEBUG findfont: score(FontEntry(fname='/usr/share/fonts/truetype/lato/Lato-Italic.ttf', index=0, name='Lato', style='italic', variant='normal', weight=400, stretch='normal', size='scalable')) = 11.05
2026-07-21 14:55:57 runnervm3jd5f matplotlib.font_manager[2874] DEBUG findfont: score(FontEntry(fname='/usr/share/fonts/truetype/liberation/LiberationSans-Italic.ttf', index=0, name='Liberation Sans', style='italic', variant='normal', weight=400, stretch='normal', size='scalable')) = 11.05
2026-07-21 14:55:57 runnervm3jd5f matplotlib.font_manager[2874] DEBUG findfont: score(FontEntry(fname='/home/runner/micromamba/envs/trajan/fonts/Ubuntu-B.ttf', index=0, name='Ubuntu', style='normal', variant='normal', weight=700, stretch='normal', size='scalable')) = 10.335
2026-07-21 14:55:57 runnervm3jd5f matplotlib.font_manager[2874] DEBUG findfont: score(FontEntry(fname='/home/runner/micromamba/envs/trajan/fonts/SourceCodePro-Semibold.ttf', index=0, name='Source Code Pro', style='normal', variant='normal', weight=600, stretch='normal', size='scalable')) = 10.24
2026-07-21 14:55:57 runnervm3jd5f matplotlib.font_manager[2874] DEBUG findfont: score(FontEntry(fname='/home/runner/micromamba/envs/trajan/fonts/SourceCodePro-Semibold.ttf', index=0, name='Source Code Pro Semibold', style='normal', variant='normal', weight=400, stretch='normal', size='scalable')) = 10.05
2026-07-21 14:55:57 runnervm3jd5f matplotlib.font_manager[2874] DEBUG findfont: score(FontEntry(fname='/home/runner/micromamba/envs/trajan/fonts/SourceCodePro-Bold.ttf', index=0, name='Source Code Pro', style='normal', variant='normal', weight=700, stretch='normal', size='scalable')) = 10.335
2026-07-21 14:55:57 runnervm3jd5f matplotlib.font_manager[2874] DEBUG findfont: score(FontEntry(fname='/home/runner/micromamba/envs/trajan/fonts/Ubuntu-MI.ttf', index=0, name='Ubuntu', style='italic', variant='normal', weight=500, stretch='normal', size='scalable')) = 11.145
2026-07-21 14:55:57 runnervm3jd5f matplotlib.font_manager[2874] DEBUG findfont: score(FontEntry(fname='/home/runner/micromamba/envs/trajan/fonts/Ubuntu-MI.ttf', index=0, name='Ubuntu Light', style='italic', variant='normal', weight=700, stretch='normal', size='scalable')) = 11.335
2026-07-21 14:55:57 runnervm3jd5f matplotlib.font_manager[2874] DEBUG findfont: score(FontEntry(fname='/usr/share/fonts/truetype/lato/Lato-Regular.ttf', index=0, name='Lato', style='normal', variant='normal', weight=400, stretch='normal', size='scalable')) = 10.05
2026-07-21 14:55:57 runnervm3jd5f matplotlib.font_manager[2874] DEBUG findfont: score(FontEntry(fname='/usr/share/fonts/truetype/lato/Lato-ThinItalic.ttf', index=0, name='Lato', style='italic', variant='normal', weight=275, stretch='normal', size='scalable')) = 11.16875
2026-07-21 14:55:57 runnervm3jd5f matplotlib.font_manager[2874] DEBUG findfont: score(FontEntry(fname='/usr/share/fonts/truetype/lato/Lato-ThinItalic.ttf', index=0, name='Lato Thin', style='italic', variant='normal', weight=400, stretch='normal', size='scalable')) = 11.05
2026-07-21 14:55:57 runnervm3jd5f matplotlib.font_manager[2874] DEBUG findfont: score(FontEntry(fname='/usr/share/fonts/truetype/lato/Lato-BlackItalic.ttf', index=0, name='Lato', style='italic', variant='normal', weight=900, stretch='normal', size='scalable')) = 11.525
2026-07-21 14:55:57 runnervm3jd5f matplotlib.font_manager[2874] DEBUG findfont: score(FontEntry(fname='/usr/share/fonts/truetype/lato/Lato-BlackItalic.ttf', index=0, name='Lato Black', style='italic', variant='normal', weight=400, stretch='normal', size='scalable')) = 11.05
2026-07-21 14:55:57 runnervm3jd5f matplotlib.font_manager[2874] DEBUG findfont: score(FontEntry(fname='/usr/share/fonts/truetype/dejavu/DejaVuSerifCondensed-Italic.ttf', index=0, name='DejaVu Serif', style='italic', variant='normal', weight=400, stretch='condensed', size='scalable')) = 11.25
2026-07-21 14:55:57 runnervm3jd5f matplotlib.font_manager[2874] DEBUG findfont: score(FontEntry(fname='/usr/share/fonts/truetype/dejavu/DejaVuSerifCondensed-Italic.ttf', index=0, name='DejaVu Serif Condensed', style='italic', variant='normal', weight=400, stretch='condensed', size='scalable')) = 11.25
2026-07-21 14:55:57 runnervm3jd5f matplotlib.font_manager[2874] DEBUG findfont: score(FontEntry(fname='/usr/share/fonts/truetype/dejavu/DejaVuSans-Bold.ttf', index=0, name='DejaVu Sans', style='normal', variant='normal', weight=700, stretch='normal', size='scalable')) = 10.335
2026-07-21 14:55:57 runnervm3jd5f matplotlib.font_manager[2874] DEBUG findfont: score(FontEntry(fname='/home/runner/micromamba/envs/trajan/fonts/UbuntuMono-R.ttf', index=0, name='Ubuntu Mono', style='normal', variant='normal', weight=400, stretch='normal', size='scalable')) = 10.05
2026-07-21 14:55:57 runnervm3jd5f matplotlib.font_manager[2874] DEBUG findfont: score(FontEntry(fname='/usr/share/fonts/truetype/dejavu/DejaVuSerif-BoldItalic.ttf', index=0, name='DejaVu Serif', style='italic', variant='normal', weight=700, stretch='normal', size='scalable')) = 11.335
2026-07-21 14:55:57 runnervm3jd5f matplotlib.font_manager[2874] DEBUG findfont: score(FontEntry(fname='/usr/share/fonts/truetype/lato/Lato-Hairline.ttf', index=0, name='Lato', style='normal', variant='normal', weight=250, stretch='normal', size='scalable')) = 10.1925
2026-07-21 14:55:57 runnervm3jd5f matplotlib.font_manager[2874] DEBUG findfont: score(FontEntry(fname='/usr/share/fonts/truetype/lato/Lato-Hairline.ttf', index=0, name='Lato Hairline', style='normal', variant='normal', weight=400, stretch='normal', size='scalable')) = 10.05
2026-07-21 14:55:57 runnervm3jd5f matplotlib.font_manager[2874] DEBUG findfont: score(FontEntry(fname='/usr/share/fonts/truetype/lato/Lato-LightItalic.ttf', index=0, name='Lato', style='italic', variant='normal', weight=300, stretch='normal', size='scalable')) = 11.145
2026-07-21 14:55:57 runnervm3jd5f matplotlib.font_manager[2874] DEBUG findfont: score(FontEntry(fname='/usr/share/fonts/truetype/lato/Lato-LightItalic.ttf', index=0, name='Lato Light', style='italic', variant='normal', weight=400, stretch='normal', size='scalable')) = 11.05
2026-07-21 14:55:57 runnervm3jd5f matplotlib.font_manager[2874] DEBUG findfont: score(FontEntry(fname='/usr/share/fonts/truetype/dejavu/DejaVuSansCondensed-BoldOblique.ttf', index=0, name='DejaVu Sans', style='oblique', variant='normal', weight=700, stretch='condensed', size='scalable')) = 11.535
2026-07-21 14:55:57 runnervm3jd5f matplotlib.font_manager[2874] DEBUG findfont: score(FontEntry(fname='/usr/share/fonts/truetype/dejavu/DejaVuSansCondensed-BoldOblique.ttf', index=0, name='DejaVu Sans Condensed', style='oblique', variant='normal', weight=700, stretch='condensed', size='scalable')) = 11.535
2026-07-21 14:55:57 runnervm3jd5f matplotlib.font_manager[2874] DEBUG findfont: score(FontEntry(fname='/home/runner/micromamba/envs/trajan/fonts/SourceCodePro-It.ttf', index=0, name='Source Code Pro', style='italic', variant='normal', weight=400, stretch='normal', size='scalable')) = 11.05
2026-07-21 14:55:57 runnervm3jd5f matplotlib.font_manager[2874] DEBUG findfont: score(FontEntry(fname='/home/runner/micromamba/envs/trajan/fonts/SourceCodePro-ExtraLightIt.ttf', index=0, name='Source Code Pro', style='italic', variant='normal', weight=200, stretch='normal', size='scalable')) = 11.24
2026-07-21 14:55:57 runnervm3jd5f matplotlib.font_manager[2874] DEBUG findfont: score(FontEntry(fname='/home/runner/micromamba/envs/trajan/fonts/SourceCodePro-ExtraLightIt.ttf', index=0, name='Source Code Pro ExtraLight', style='italic', variant='normal', weight=400, stretch='normal', size='scalable')) = 11.05
2026-07-21 14:55:57 runnervm3jd5f matplotlib.font_manager[2874] DEBUG findfont: score(FontEntry(fname='/usr/share/fonts/truetype/lato/Lato-Medium.ttf', index=0, name='Lato', style='normal', variant='normal', weight=500, stretch='normal', size='scalable')) = 10.145
2026-07-21 14:55:57 runnervm3jd5f matplotlib.font_manager[2874] DEBUG findfont: score(FontEntry(fname='/usr/share/fonts/truetype/lato/Lato-Medium.ttf', index=0, name='Lato Medium', style='normal', variant='normal', weight=400, stretch='normal', size='scalable')) = 10.05
2026-07-21 14:55:57 runnervm3jd5f matplotlib.font_manager[2874] DEBUG findfont: score(FontEntry(fname='/usr/share/fonts/truetype/lato/Lato-BoldItalic.ttf', index=0, name='Lato', style='italic', variant='normal', weight=700, stretch='normal', size='scalable')) = 11.335
2026-07-21 14:55:57 runnervm3jd5f matplotlib.font_manager[2874] DEBUG findfont: score(FontEntry(fname='/home/runner/micromamba/envs/trajan/fonts/DejaVuSans.ttf', index=0, name='DejaVu Sans', style='normal', variant='normal', weight=400, stretch='normal', size='scalable')) = 10.05
2026-07-21 14:55:57 runnervm3jd5f matplotlib.font_manager[2874] DEBUG findfont: score(FontEntry(fname='/home/runner/micromamba/envs/trajan/fonts/UbuntuMono-B.ttf', index=0, name='Ubuntu Mono', style='normal', variant='normal', weight=700, stretch='normal', size='scalable')) = 10.335
2026-07-21 14:55:57 runnervm3jd5f matplotlib.font_manager[2874] DEBUG findfont: score(FontEntry(fname='/home/runner/micromamba/envs/trajan/fonts/SourceCodePro-LightIt.ttf', index=0, name='Source Code Pro', style='italic', variant='normal', weight=300, stretch='normal', size='scalable')) = 11.145
2026-07-21 14:55:57 runnervm3jd5f matplotlib.font_manager[2874] DEBUG findfont: score(FontEntry(fname='/home/runner/micromamba/envs/trajan/fonts/SourceCodePro-LightIt.ttf', index=0, name='Source Code Pro Light', style='italic', variant='normal', weight=400, stretch='normal', size='scalable')) = 11.05
2026-07-21 14:55:57 runnervm3jd5f matplotlib.font_manager[2874] DEBUG findfont: score(FontEntry(fname='/usr/share/fonts/truetype/liberation/LiberationSans-BoldItalic.ttf', index=0, name='Liberation Sans', style='italic', variant='normal', weight=700, stretch='normal', size='scalable')) = 11.335
2026-07-21 14:55:57 runnervm3jd5f matplotlib.font_manager[2874] DEBUG findfont: score(FontEntry(fname='/usr/share/fonts/truetype/liberation/LiberationSans-Regular.ttf', index=0, name='Liberation Sans', style='normal', variant='normal', weight=400, stretch='normal', size='scalable')) = 10.05
2026-07-21 14:55:57 runnervm3jd5f matplotlib.font_manager[2874] DEBUG findfont: score(FontEntry(fname='/usr/share/fonts/truetype/dejavu/DejaVuSansMono-Bold.ttf', index=0, name='DejaVu Sans Mono', style='normal', variant='normal', weight=700, stretch='normal', size='scalable')) = 10.335
2026-07-21 14:55:57 runnervm3jd5f matplotlib.font_manager[2874] DEBUG findfont: score(FontEntry(fname='/home/runner/micromamba/envs/trajan/fonts/SourceCodePro-BoldIt.ttf', index=0, name='Source Code Pro', style='italic', variant='normal', weight=700, stretch='normal', size='scalable')) = 11.335
2026-07-21 14:55:57 runnervm3jd5f matplotlib.font_manager[2874] DEBUG findfont: score(FontEntry(fname='/usr/share/fonts/truetype/lato/Lato-Bold.ttf', index=0, name='Lato', style='normal', variant='normal', weight=700, stretch='normal', size='scalable')) = 10.335
2026-07-21 14:55:57 runnervm3jd5f matplotlib.font_manager[2874] DEBUG findfont: score(FontEntry(fname='/usr/share/fonts/truetype/dejavu/DejaVuSansCondensed.ttf', index=0, name='DejaVu Sans', style='normal', variant='normal', weight=400, stretch='condensed', size='scalable')) = 10.25
2026-07-21 14:55:57 runnervm3jd5f matplotlib.font_manager[2874] DEBUG findfont: score(FontEntry(fname='/usr/share/fonts/truetype/dejavu/DejaVuSansCondensed.ttf', index=0, name='DejaVu Sans Condensed', style='normal', variant='normal', weight=380, stretch='condensed', size='scalable')) = 10.269
2026-07-21 14:55:57 runnervm3jd5f matplotlib.font_manager[2874] DEBUG findfont: score(FontEntry(fname='/usr/share/fonts/truetype/lato/Lato-MediumItalic.ttf', index=0, name='Lato', style='italic', variant='normal', weight=500, stretch='normal', size='scalable')) = 11.145
2026-07-21 14:55:57 runnervm3jd5f matplotlib.font_manager[2874] DEBUG findfont: score(FontEntry(fname='/usr/share/fonts/truetype/lato/Lato-MediumItalic.ttf', index=0, name='Lato Medium', style='italic', variant='normal', weight=400, stretch='normal', size='scalable')) = 11.05
2026-07-21 14:55:57 runnervm3jd5f matplotlib.font_manager[2874] DEBUG findfont: score(FontEntry(fname='/usr/share/fonts/truetype/liberation/LiberationSans-Bold.ttf', index=0, name='Liberation Sans', style='normal', variant='normal', weight=700, stretch='normal', size='scalable')) = 10.335
2026-07-21 14:55:57 runnervm3jd5f matplotlib.font_manager[2874] DEBUG findfont: score(FontEntry(fname='/usr/share/fonts/truetype/dejavu/DejaVuSerifCondensed-BoldItalic.ttf', index=0, name='DejaVu Serif', style='italic', variant='normal', weight=700, stretch='condensed', size='scalable')) = 11.535
2026-07-21 14:55:57 runnervm3jd5f matplotlib.font_manager[2874] DEBUG findfont: score(FontEntry(fname='/usr/share/fonts/truetype/dejavu/DejaVuSerifCondensed-BoldItalic.ttf', index=0, name='DejaVu Serif Condensed', style='italic', variant='normal', weight=700, stretch='condensed', size='scalable')) = 11.535
2026-07-21 14:55:57 runnervm3jd5f matplotlib.font_manager[2874] DEBUG findfont: score(FontEntry(fname='/home/runner/micromamba/envs/trajan/fonts/Ubuntu-R.ttf', index=0, name='Ubuntu', style='normal', variant='normal', weight=400, stretch='normal', size='scalable')) = 10.05
2026-07-21 14:55:57 runnervm3jd5f matplotlib.font_manager[2874] DEBUG findfont: score(FontEntry(fname='/usr/share/fonts/truetype/lato/Lato-Light.ttf', index=0, name='Lato', style='normal', variant='normal', weight=300, stretch='normal', size='scalable')) = 10.145
2026-07-21 14:55:57 runnervm3jd5f matplotlib.font_manager[2874] DEBUG findfont: score(FontEntry(fname='/usr/share/fonts/truetype/lato/Lato-Light.ttf', index=0, name='Lato Light', style='normal', variant='normal', weight=400, stretch='normal', size='scalable')) = 10.05
2026-07-21 14:55:57 runnervm3jd5f matplotlib.font_manager[2874] DEBUG findfont: score(FontEntry(fname='/usr/share/fonts/truetype/liberation/LiberationSerif-BoldItalic.ttf', index=0, name='Liberation Serif', style='italic', variant='normal', weight=700, stretch='normal', size='scalable')) = 11.335
2026-07-21 14:55:57 runnervm3jd5f matplotlib.font_manager[2874] DEBUG findfont: score(FontEntry(fname='/home/runner/micromamba/envs/trajan/fonts/Ubuntu-Th.ttf', index=0, name='Ubuntu', style='normal', variant='normal', weight=250, stretch='normal', size='scalable')) = 10.1925
2026-07-21 14:55:57 runnervm3jd5f matplotlib.font_manager[2874] DEBUG findfont: score(FontEntry(fname='/home/runner/micromamba/envs/trajan/fonts/Ubuntu-Th.ttf', index=0, name='Ubuntu Thin', style='normal', variant='normal', weight=400, stretch='normal', size='scalable')) = 10.05
2026-07-21 14:55:57 runnervm3jd5f matplotlib.font_manager[2874] DEBUG findfont: score(FontEntry(fname='/home/runner/micromamba/envs/trajan/fonts/SourceCodePro-ExtraLight.ttf', index=0, name='Source Code Pro', style='normal', variant='normal', weight=200, stretch='normal', size='scalable')) = 10.24
2026-07-21 14:55:57 runnervm3jd5f matplotlib.font_manager[2874] DEBUG findfont: score(FontEntry(fname='/home/runner/micromamba/envs/trajan/fonts/SourceCodePro-ExtraLight.ttf', index=0, name='Source Code Pro ExtraLight', style='normal', variant='normal', weight=400, stretch='normal', size='scalable')) = 10.05
2026-07-21 14:55:57 runnervm3jd5f matplotlib.font_manager[2874] DEBUG findfont: score(FontEntry(fname='/usr/share/fonts/truetype/lato/Lato-Thin.ttf', index=0, name='Lato', style='normal', variant='normal', weight=275, stretch='normal', size='scalable')) = 10.16875
2026-07-21 14:55:57 runnervm3jd5f matplotlib.font_manager[2874] DEBUG findfont: score(FontEntry(fname='/usr/share/fonts/truetype/lato/Lato-Thin.ttf', index=0, name='Lato Thin', style='normal', variant='normal', weight=400, stretch='normal', size='scalable')) = 10.05
2026-07-21 14:55:57 runnervm3jd5f matplotlib.font_manager[2874] DEBUG findfont: score(FontEntry(fname='/usr/share/fonts/truetype/liberation/LiberationSerif-Bold.ttf', index=0, name='Liberation Serif', style='normal', variant='normal', weight=700, stretch='normal', size='scalable')) = 10.335
2026-07-21 14:55:57 runnervm3jd5f matplotlib.font_manager[2874] DEBUG findfont: score(FontEntry(fname='/home/runner/micromamba/envs/trajan/fonts/Inconsolata-Regular.ttf', index=0, name='Inconsolata', style='normal', variant='normal', weight=400, stretch='normal', size='scalable')) = 10.05
2026-07-21 14:55:57 runnervm3jd5f matplotlib.font_manager[2874] DEBUG findfont: score(FontEntry(fname='/home/runner/micromamba/envs/trajan/fonts/Ubuntu-C.ttf', index=0, name='Ubuntu Condensed', style='normal', variant='normal', weight=400, stretch='condensed', size='scalable')) = 10.25
2026-07-21 14:55:57 runnervm3jd5f matplotlib.font_manager[2874] DEBUG findfont: score(FontEntry(fname='/usr/share/fonts/truetype/dejavu/DejaVuSansCondensed-Bold.ttf', index=0, name='DejaVu Sans', style='normal', variant='normal', weight=700, stretch='condensed', size='scalable')) = 10.535
2026-07-21 14:55:57 runnervm3jd5f matplotlib.font_manager[2874] DEBUG findfont: score(FontEntry(fname='/usr/share/fonts/truetype/dejavu/DejaVuSansCondensed-Bold.ttf', index=0, name='DejaVu Sans Condensed', style='normal', variant='normal', weight=700, stretch='condensed', size='scalable')) = 10.535
2026-07-21 14:55:57 runnervm3jd5f matplotlib.font_manager[2874] DEBUG findfont: score(FontEntry(fname='/usr/share/fonts/truetype/liberation/LiberationMono-Bold.ttf', index=0, name='Liberation Mono', style='normal', variant='normal', weight=700, stretch='normal', size='scalable')) = 10.335
2026-07-21 14:55:57 runnervm3jd5f matplotlib.font_manager[2874] DEBUG findfont: score(FontEntry(fname='/home/runner/micromamba/envs/trajan/fonts/SourceCodePro-Black.ttf', index=0, name='Source Code Pro', style='normal', variant='normal', weight=900, stretch='normal', size='scalable')) = 10.525
2026-07-21 14:55:57 runnervm3jd5f matplotlib.font_manager[2874] DEBUG findfont: score(FontEntry(fname='/home/runner/micromamba/envs/trajan/fonts/SourceCodePro-Black.ttf', index=0, name='Source Code Pro Black', style='normal', variant='normal', weight=400, stretch='normal', size='scalable')) = 10.05
2026-07-21 14:55:57 runnervm3jd5f matplotlib.font_manager[2874] DEBUG findfont: score(FontEntry(fname='/home/runner/micromamba/envs/trajan/fonts/SourceCodePro-BlackIt.ttf', index=0, name='Source Code Pro', style='italic', variant='normal', weight=900, stretch='normal', size='scalable')) = 11.525
2026-07-21 14:55:57 runnervm3jd5f matplotlib.font_manager[2874] DEBUG findfont: score(FontEntry(fname='/home/runner/micromamba/envs/trajan/fonts/SourceCodePro-BlackIt.ttf', index=0, name='Source Code Pro Black', style='italic', variant='normal', weight=400, stretch='normal', size='scalable')) = 11.05
2026-07-21 14:55:57 runnervm3jd5f matplotlib.font_manager[2874] DEBUG findfont: score(FontEntry(fname='/home/runner/micromamba/envs/trajan/fonts/Ubuntu-LI.ttf', index=0, name='Ubuntu', style='italic', variant='normal', weight=300, stretch='normal', size='scalable')) = 11.145
2026-07-21 14:55:57 runnervm3jd5f matplotlib.font_manager[2874] DEBUG findfont: score(FontEntry(fname='/home/runner/micromamba/envs/trajan/fonts/Ubuntu-LI.ttf', index=0, name='Ubuntu Light', style='italic', variant='normal', weight=400, stretch='normal', size='scalable')) = 11.05
2026-07-21 14:55:57 runnervm3jd5f matplotlib.font_manager[2874] DEBUG findfont: score(FontEntry(fname='/usr/share/fonts/truetype/liberation/LiberationMono-Regular.ttf', index=0, name='Liberation Mono', style='normal', variant='normal', weight=400, stretch='normal', size='scalable')) = 10.05
2026-07-21 14:55:57 runnervm3jd5f matplotlib.font_manager[2874] DEBUG findfont: score(FontEntry(fname='/home/runner/micromamba/envs/trajan/fonts/UbuntuMono-RI.ttf', index=0, name='Ubuntu Mono', style='italic', variant='normal', weight=400, stretch='normal', size='scalable')) = 11.05
2026-07-21 14:55:57 runnervm3jd5f matplotlib.font_manager[2874] DEBUG findfont: score(FontEntry(fname='/usr/share/fonts/truetype/lato/Lato-Heavy.ttf', index=0, name='Lato', style='normal', variant='normal', weight=800, stretch='normal', size='scalable')) = 10.43
2026-07-21 14:55:57 runnervm3jd5f matplotlib.font_manager[2874] DEBUG findfont: score(FontEntry(fname='/usr/share/fonts/truetype/lato/Lato-Heavy.ttf', index=0, name='Lato Heavy', style='normal', variant='normal', weight=400, stretch='normal', size='scalable')) = 10.05
2026-07-21 14:55:57 runnervm3jd5f matplotlib.font_manager[2874] DEBUG findfont: score(FontEntry(fname='/usr/share/fonts/truetype/lato/Lato-HairlineItalic.ttf', index=0, name='Lato', style='italic', variant='normal', weight=250, stretch='normal', size='scalable')) = 11.1925
2026-07-21 14:55:57 runnervm3jd5f matplotlib.font_manager[2874] DEBUG findfont: score(FontEntry(fname='/usr/share/fonts/truetype/lato/Lato-HairlineItalic.ttf', index=0, name='Lato Hairline', style='italic', variant='normal', weight=400, stretch='normal', size='scalable')) = 11.05
2026-07-21 14:55:57 runnervm3jd5f matplotlib.font_manager[2874] DEBUG findfont: score(FontEntry(fname='/usr/share/fonts/truetype/dejavu/DejaVuSerifCondensed-Bold.ttf', index=0, name='DejaVu Serif', style='normal', variant='normal', weight=700, stretch='condensed', size='scalable')) = 10.535
2026-07-21 14:55:57 runnervm3jd5f matplotlib.font_manager[2874] DEBUG findfont: score(FontEntry(fname='/usr/share/fonts/truetype/dejavu/DejaVuSerifCondensed-Bold.ttf', index=0, name='DejaVu Serif Condensed', style='normal', variant='normal', weight=700, stretch='condensed', size='scalable')) = 10.535
2026-07-21 14:55:57 runnervm3jd5f matplotlib.font_manager[2874] DEBUG findfont: score(FontEntry(fname='/usr/share/fonts/truetype/dejavu/DejaVuSansCondensed-Oblique.ttf', index=0, name='DejaVu Sans', style='oblique', variant='normal', weight=400, stretch='condensed', size='scalable')) = 11.25
2026-07-21 14:55:57 runnervm3jd5f matplotlib.font_manager[2874] DEBUG findfont: score(FontEntry(fname='/usr/share/fonts/truetype/dejavu/DejaVuSansCondensed-Oblique.ttf', index=0, name='DejaVu Sans Condensed', style='oblique', variant='normal', weight=400, stretch='condensed', size='scalable')) = 11.25
2026-07-21 14:55:57 runnervm3jd5f matplotlib.font_manager[2874] DEBUG findfont: score(FontEntry(fname='/usr/share/fonts/truetype/lato/Lato-SemiboldItalic.ttf', index=0, name='Lato', style='italic', variant='normal', weight=600, stretch='normal', size='scalable')) = 11.24
2026-07-21 14:55:57 runnervm3jd5f matplotlib.font_manager[2874] DEBUG findfont: score(FontEntry(fname='/usr/share/fonts/truetype/lato/Lato-SemiboldItalic.ttf', index=0, name='Lato Semibold', style='italic', variant='normal', weight=400, stretch='normal', size='scalable')) = 11.05
2026-07-21 14:55:57 runnervm3jd5f matplotlib.font_manager[2874] DEBUG findfont: score(FontEntry(fname='/usr/share/fonts/truetype/lato/Lato-Semibold.ttf', index=0, name='Lato', style='normal', variant='normal', weight=600, stretch='normal', size='scalable')) = 10.24
2026-07-21 14:55:57 runnervm3jd5f matplotlib.font_manager[2874] DEBUG findfont: score(FontEntry(fname='/usr/share/fonts/truetype/lato/Lato-Semibold.ttf', index=0, name='Lato Semibold', style='normal', variant='normal', weight=400, stretch='normal', size='scalable')) = 10.05
2026-07-21 14:55:57 runnervm3jd5f matplotlib.font_manager[2874] DEBUG findfont: score(FontEntry(fname='/home/runner/micromamba/envs/trajan/fonts/Inconsolata-Bold.ttf', index=0, name='Inconsolata', style='normal', variant='normal', weight=700, stretch='normal', size='scalable')) = 10.335
2026-07-21 14:55:57 runnervm3jd5f matplotlib.font_manager[2874] DEBUG findfont: score(FontEntry(fname='/usr/share/fonts/truetype/dejavu/DejaVuSans-ExtraLight.ttf', index=0, name='DejaVu Sans', style='normal', variant='normal', weight=200, stretch='normal', size='scalable')) = 10.24
2026-07-21 14:55:57 runnervm3jd5f matplotlib.font_manager[2874] DEBUG findfont: score(FontEntry(fname='/usr/share/fonts/truetype/dejavu/DejaVuSans-ExtraLight.ttf', index=0, name='DejaVu Sans Light', style='normal', variant='normal', weight=200, stretch='normal', size='scalable')) = 10.24
2026-07-21 14:55:57 runnervm3jd5f matplotlib.font_manager[2874] DEBUG findfont: score(FontEntry(fname='/home/runner/micromamba/envs/trajan/fonts/Ubuntu-BI.ttf', index=0, name='Ubuntu', style='italic', variant='normal', weight=700, stretch='normal', size='scalable')) = 11.335
2026-07-21 14:55:57 runnervm3jd5f matplotlib.font_manager[2874] DEBUG findfont: score(FontEntry(fname='/usr/share/fonts/truetype/dejavu/DejaVuSans-BoldOblique.ttf', index=0, name='DejaVu Sans', style='oblique', variant='normal', weight=700, stretch='normal', size='scalable')) = 11.335
2026-07-21 14:55:57 runnervm3jd5f matplotlib.font_manager[2874] DEBUG findfont: score(FontEntry(fname='/home/runner/micromamba/envs/trajan/fonts/Ubuntu-RI.ttf', index=0, name='Ubuntu', style='italic', variant='normal', weight=400, stretch='normal', size='scalable')) = 11.05
2026-07-21 14:55:57 runnervm3jd5f matplotlib.font_manager[2874] DEBUG findfont: score(FontEntry(fname='/usr/share/fonts/truetype/dejavu/DejaVuSerif-Italic.ttf', index=0, name='DejaVu Serif', style='italic', variant='normal', weight=400, stretch='normal', size='scalable')) = 11.05
2026-07-21 14:55:57 runnervm3jd5f matplotlib.font_manager[2874] DEBUG findfont: score(FontEntry(fname='/home/runner/micromamba/envs/trajan/fonts/SourceCodePro-Medium.ttf', index=0, name='Source Code Pro', style='normal', variant='normal', weight=500, stretch='normal', size='scalable')) = 10.145
2026-07-21 14:55:57 runnervm3jd5f matplotlib.font_manager[2874] DEBUG findfont: score(FontEntry(fname='/home/runner/micromamba/envs/trajan/fonts/SourceCodePro-Medium.ttf', index=0, name='Source Code Pro Medium', style='normal', variant='normal', weight=400, stretch='normal', size='scalable')) = 10.05
2026-07-21 14:55:57 runnervm3jd5f matplotlib.font_manager[2874] DEBUG findfont: score(FontEntry(fname='/usr/share/fonts/truetype/lato/Lato-HeavyItalic.ttf', index=0, name='Lato', style='italic', variant='normal', weight=800, stretch='normal', size='scalable')) = 11.43
2026-07-21 14:55:57 runnervm3jd5f matplotlib.font_manager[2874] DEBUG findfont: score(FontEntry(fname='/usr/share/fonts/truetype/lato/Lato-HeavyItalic.ttf', index=0, name='Lato Heavy', style='italic', variant='normal', weight=400, stretch='normal', size='scalable')) = 11.05
2026-07-21 14:55:57 runnervm3jd5f matplotlib.font_manager[2874] DEBUG findfont: score(FontEntry(fname='/usr/share/fonts/truetype/dejavu/DejaVuSans-Oblique.ttf', index=0, name='DejaVu Sans', style='oblique', variant='normal', weight=400, stretch='normal', size='scalable')) = 11.05
2026-07-21 14:55:57 runnervm3jd5f matplotlib.font_manager[2874] DEBUG findfont: score(FontEntry(fname='/home/runner/micromamba/envs/trajan/fonts/Ubuntu-M.ttf', index=0, name='Ubuntu', style='normal', variant='normal', weight=500, stretch='normal', size='scalable')) = 10.145
2026-07-21 14:55:57 runnervm3jd5f matplotlib.font_manager[2874] DEBUG findfont: score(FontEntry(fname='/home/runner/micromamba/envs/trajan/fonts/Ubuntu-M.ttf', index=0, name='Ubuntu Light', style='normal', variant='normal', weight=700, stretch='normal', size='scalable')) = 10.335
2026-07-21 14:55:57 runnervm3jd5f matplotlib.font_manager[2874] DEBUG findfont: score(FontEntry(fname='/usr/share/fonts/truetype/liberation/LiberationMono-BoldItalic.ttf', index=0, name='Liberation Mono', style='italic', variant='normal', weight=700, stretch='normal', size='scalable')) = 11.335
2026-07-21 14:55:57 runnervm3jd5f matplotlib.font_manager[2874] DEBUG findfont: score(FontEntry(fname='/usr/share/fonts/truetype/dejavu/DejaVuSansMono.ttf', index=0, name='DejaVu Sans Mono', style='normal', variant='normal', weight=400, stretch='normal', size='scalable')) = 10.05
2026-07-21 14:55:57 runnervm3jd5f matplotlib.font_manager[2874] DEBUG findfont: score(FontEntry(fname='/usr/share/fonts/truetype/dejavu/DejaVuMathTeXGyre.ttf', index=0, name='DejaVu Math TeX Gyre', style='normal', variant='normal', weight=400, stretch='normal', size='scalable')) = 10.05
2026-07-21 14:55:57 runnervm3jd5f matplotlib.font_manager[2874] DEBUG findfont: score(FontEntry(fname='/usr/share/fonts/truetype/dejavu/DejaVuSansMono-Oblique.ttf', index=0, name='DejaVu Sans Mono', style='oblique', variant='normal', weight=400, stretch='normal', size='scalable')) = 11.05
2026-07-21 14:55:57 runnervm3jd5f matplotlib.font_manager[2874] DEBUG findfont: score(FontEntry(fname='/home/runner/micromamba/envs/trajan/fonts/Ubuntu-L.ttf', index=0, name='Ubuntu', style='normal', variant='normal', weight=300, stretch='normal', size='scalable')) = 10.145
2026-07-21 14:55:57 runnervm3jd5f matplotlib.font_manager[2874] DEBUG findfont: score(FontEntry(fname='/home/runner/micromamba/envs/trajan/fonts/Ubuntu-L.ttf', index=0, name='Ubuntu Light', style='normal', variant='normal', weight=400, stretch='normal', size='scalable')) = 10.05
2026-07-21 14:55:57 runnervm3jd5f matplotlib.font_manager[2874] DEBUG findfont: score(FontEntry(fname='/home/runner/micromamba/envs/trajan/fonts/SourceCodePro-MediumIt.ttf', index=0, name='Source Code Pro', style='italic', variant='normal', weight=500, stretch='normal', size='scalable')) = 11.145
2026-07-21 14:55:57 runnervm3jd5f matplotlib.font_manager[2874] DEBUG findfont: score(FontEntry(fname='/home/runner/micromamba/envs/trajan/fonts/SourceCodePro-MediumIt.ttf', index=0, name='Source Code Pro Medium', style='italic', variant='normal', weight=400, stretch='normal', size='scalable')) = 11.05
2026-07-21 14:55:57 runnervm3jd5f matplotlib.font_manager[2874] DEBUG findfont: score(FontEntry(fname='/home/runner/micromamba/envs/trajan/fonts/SourceCodePro-Regular.ttf', index=0, name='Source Code Pro', style='normal', variant='normal', weight=400, stretch='normal', size='scalable')) = 10.05
2026-07-21 14:55:57 runnervm3jd5f matplotlib.font_manager[2874] DEBUG findfont: score(FontEntry(fname='/home/runner/micromamba/envs/trajan/fonts/SourceCodePro-SemiboldIt.ttf', index=0, name='Source Code Pro', style='italic', variant='normal', weight=600, stretch='normal', size='scalable')) = 11.24
2026-07-21 14:55:57 runnervm3jd5f matplotlib.font_manager[2874] DEBUG findfont: score(FontEntry(fname='/home/runner/micromamba/envs/trajan/fonts/SourceCodePro-SemiboldIt.ttf', index=0, name='Source Code Pro Semibold', style='italic', variant='normal', weight=400, stretch='normal', size='scalable')) = 11.05
2026-07-21 14:55:57 runnervm3jd5f matplotlib.font_manager[2874] DEBUG findfont: score(FontEntry(fname='/usr/share/fonts/truetype/dejavu/DejaVuSerif.ttf', index=0, name='DejaVu Serif', style='normal', variant='normal', weight=400, stretch='normal', size='scalable')) = 10.05
2026-07-21 14:55:57 runnervm3jd5f matplotlib.font_manager[2874] DEBUG findfont: score(FontEntry(fname='/usr/share/fonts/truetype/dejavu/DejaVuSerif-Bold.ttf', index=0, name='DejaVu Serif', style='normal', variant='normal', weight=700, stretch='normal', size='scalable')) = 10.335
2026-07-21 14:55:57 runnervm3jd5f matplotlib.font_manager[2874] DEBUG findfont: score(FontEntry(fname='/usr/share/fonts/truetype/liberation/LiberationSerif-Italic.ttf', index=0, name='Liberation Serif', style='italic', variant='normal', weight=400, stretch='normal', size='scalable')) = 11.05
2026-07-21 14:55:57 runnervm3jd5f matplotlib.font_manager[2874] DEBUG findfont: score(FontEntry(fname='/usr/share/fonts/truetype/dejavu/DejaVuSansMono-BoldOblique.ttf', index=0, name='DejaVu Sans Mono', style='oblique', variant='normal', weight=700, stretch='normal', size='scalable')) = 11.335
2026-07-21 14:55:57 runnervm3jd5f matplotlib.font_manager[2874] DEBUG findfont: score(FontEntry(fname='/home/runner/micromamba/envs/trajan/fonts/SourceCodePro-Light.ttf', index=0, name='Source Code Pro', style='normal', variant='normal', weight=300, stretch='normal', size='scalable')) = 10.145
2026-07-21 14:55:57 runnervm3jd5f matplotlib.font_manager[2874] DEBUG findfont: score(FontEntry(fname='/home/runner/micromamba/envs/trajan/fonts/SourceCodePro-Light.ttf', index=0, name='Source Code Pro Light', style='normal', variant='normal', weight=400, stretch='normal', size='scalable')) = 10.05
2026-07-21 14:55:57 runnervm3jd5f matplotlib.font_manager[2874] DEBUG findfont: score(FontEntry(fname='/usr/share/fonts/truetype/liberation/LiberationMono-Italic.ttf', index=0, name='Liberation Mono', style='italic', variant='normal', weight=400, stretch='normal', size='scalable')) = 11.05
2026-07-21 14:55:57 runnervm3jd5f matplotlib.font_manager[2874] DEBUG findfont: Matching STIXGeneral:style=normal:variant=normal:weight=normal:stretch=normal:size=10.0 to STIXGeneral ('/home/runner/micromamba/envs/trajan/lib/python3.14/site-packages/matplotlib/mpl-data/fonts/ttf/STIXGeneral.ttf') with score of 0.050000.
2026-07-21 14:55:57 runnervm3jd5f matplotlib.font_manager[2874] DEBUG findfont: Matching STIXGeneral:style=italic:variant=normal:weight=normal:stretch=normal:size=10.0.
2026-07-21 14:55:57 runnervm3jd5f matplotlib.font_manager[2874] DEBUG findfont: score(FontEntry(fname='/home/runner/micromamba/envs/trajan/lib/python3.14/site-packages/matplotlib/mpl-data/fonts/ttf/cmmi10.ttf', index=0, name='cmmi10', style='normal', variant='normal', weight=400, stretch='normal', size='scalable')) = 11.05
2026-07-21 14:55:57 runnervm3jd5f matplotlib.font_manager[2874] DEBUG findfont: score(FontEntry(fname='/home/runner/micromamba/envs/trajan/lib/python3.14/site-packages/matplotlib/mpl-data/fonts/ttf/DejaVuSerif-Bold.ttf', index=0, name='DejaVu Serif', style='normal', variant='normal', weight=700, stretch='normal', size='scalable')) = 11.335
2026-07-21 14:55:57 runnervm3jd5f matplotlib.font_manager[2874] DEBUG findfont: score(FontEntry(fname='/home/runner/micromamba/envs/trajan/lib/python3.14/site-packages/matplotlib/mpl-data/fonts/ttf/DejaVuSans-Oblique.ttf', index=0, name='DejaVu Sans', style='oblique', variant='normal', weight=400, stretch='normal', size='scalable')) = 10.15
2026-07-21 14:55:57 runnervm3jd5f matplotlib.font_manager[2874] DEBUG findfont: score(FontEntry(fname='/home/runner/micromamba/envs/trajan/lib/python3.14/site-packages/matplotlib/mpl-data/fonts/ttf/STIXSizThreeSymReg.ttf', index=0, name='STIXSizeThreeSym', style='normal', variant='normal', weight=400, stretch='normal', size='scalable')) = 11.05
2026-07-21 14:55:57 runnervm3jd5f matplotlib.font_manager[2874] DEBUG findfont: score(FontEntry(fname='/home/runner/micromamba/envs/trajan/lib/python3.14/site-packages/matplotlib/mpl-data/fonts/ttf/STIXNonUniBolIta.ttf', index=0, name='STIXNonUnicode', style='italic', variant='normal', weight=700, stretch='normal', size='scalable')) = 10.335
2026-07-21 14:55:57 runnervm3jd5f matplotlib.font_manager[2874] DEBUG findfont: score(FontEntry(fname='/home/runner/micromamba/envs/trajan/lib/python3.14/site-packages/matplotlib/mpl-data/fonts/ttf/DejaVuSerifDisplay.ttf', index=0, name='DejaVu Serif Display', style='normal', variant='normal', weight=400, stretch='normal', size='scalable')) = 11.05
2026-07-21 14:55:57 runnervm3jd5f matplotlib.font_manager[2874] DEBUG findfont: score(FontEntry(fname='/home/runner/micromamba/envs/trajan/lib/python3.14/site-packages/matplotlib/mpl-data/fonts/ttf/cmss10.ttf', index=0, name='cmss10', style='normal', variant='normal', weight=400, stretch='normal', size='scalable')) = 11.05
2026-07-21 14:55:57 runnervm3jd5f matplotlib.font_manager[2874] DEBUG findfont: score(FontEntry(fname='/home/runner/micromamba/envs/trajan/lib/python3.14/site-packages/matplotlib/mpl-data/fonts/ttf/STIXGeneralBolIta.ttf', index=0, name='STIXGeneral', style='italic', variant='normal', weight=700, stretch='normal', size='scalable')) = 0.33499999999999996
2026-07-21 14:55:57 runnervm3jd5f matplotlib.font_manager[2874] DEBUG findfont: score(FontEntry(fname='/home/runner/micromamba/envs/trajan/lib/python3.14/site-packages/matplotlib/mpl-data/fonts/ttf/cmtt10.ttf', index=0, name='cmtt10', style='normal', variant='normal', weight=400, stretch='normal', size='scalable')) = 11.05
2026-07-21 14:55:57 runnervm3jd5f matplotlib.font_manager[2874] DEBUG findfont: score(FontEntry(fname='/home/runner/micromamba/envs/trajan/lib/python3.14/site-packages/matplotlib/mpl-data/fonts/ttf/cmsy10.ttf', index=0, name='cmsy10', style='normal', variant='normal', weight=400, stretch='normal', size='scalable')) = 11.05
2026-07-21 14:55:57 runnervm3jd5f matplotlib.font_manager[2874] DEBUG findfont: score(FontEntry(fname='/home/runner/micromamba/envs/trajan/lib/python3.14/site-packages/matplotlib/mpl-data/fonts/ttf/DejaVuSansMono-Oblique.ttf', index=0, name='DejaVu Sans Mono', style='oblique', variant='normal', weight=400, stretch='normal', size='scalable')) = 10.15
2026-07-21 14:55:57 runnervm3jd5f matplotlib.font_manager[2874] DEBUG findfont: score(FontEntry(fname='/home/runner/micromamba/envs/trajan/lib/python3.14/site-packages/matplotlib/mpl-data/fonts/ttf/STIXNonUniIta.ttf', index=0, name='STIXNonUnicode', style='italic', variant='normal', weight=400, stretch='normal', size='scalable')) = 10.05
2026-07-21 14:55:57 runnervm3jd5f matplotlib.font_manager[2874] DEBUG findfont: score(FontEntry(fname='/home/runner/micromamba/envs/trajan/lib/python3.14/site-packages/matplotlib/mpl-data/fonts/ttf/STIXGeneral.ttf', index=0, name='STIXGeneral', style='normal', variant='normal', weight=400, stretch='normal', size='scalable')) = 1.05
2026-07-21 14:55:57 runnervm3jd5f matplotlib.font_manager[2874] DEBUG findfont: score(FontEntry(fname='/home/runner/micromamba/envs/trajan/lib/python3.14/site-packages/matplotlib/mpl-data/fonts/ttf/cmti10.ttf', index=0, name='cmti10', style='normal', variant='normal', weight=400, stretch='normal', size='scalable')) = 11.05
2026-07-21 14:55:57 runnervm3jd5f matplotlib.font_manager[2874] DEBUG findfont: score(FontEntry(fname='/home/runner/micromamba/envs/trajan/lib/python3.14/site-packages/matplotlib/mpl-data/fonts/ttf/DejaVuSansMono-BoldOblique.ttf', index=0, name='DejaVu Sans Mono', style='oblique', variant='normal', weight=700, stretch='normal', size='scalable')) = 10.434999999999999
2026-07-21 14:55:57 runnervm3jd5f matplotlib.font_manager[2874] DEBUG findfont: score(FontEntry(fname='/home/runner/micromamba/envs/trajan/lib/python3.14/site-packages/matplotlib/mpl-data/fonts/ttf/DejaVuSerif.ttf', index=0, name='DejaVu Serif', style='normal', variant='normal', weight=400, stretch='normal', size='scalable')) = 11.05
2026-07-21 14:55:57 runnervm3jd5f matplotlib.font_manager[2874] DEBUG findfont: score(FontEntry(fname='/home/runner/micromamba/envs/trajan/lib/python3.14/site-packages/matplotlib/mpl-data/fonts/ttf/LastResortHE-Regular.ttf', index=0, name='Last Resort High-Efficiency', style='normal', variant='normal', weight=400, stretch='normal', size='scalable')) = 11.05
2026-07-21 14:55:57 runnervm3jd5f matplotlib.font_manager[2874] DEBUG findfont: score(FontEntry(fname='/home/runner/micromamba/envs/trajan/lib/python3.14/site-packages/matplotlib/mpl-data/fonts/ttf/cmex10.ttf', index=0, name='cmex10', style='normal', variant='normal', weight=400, stretch='normal', size='scalable')) = 11.05
2026-07-21 14:55:57 runnervm3jd5f matplotlib.font_manager[2874] DEBUG findfont: score(FontEntry(fname='/home/runner/micromamba/envs/trajan/lib/python3.14/site-packages/matplotlib/mpl-data/fonts/ttf/STIXSizFiveSymReg.ttf', index=0, name='STIXSizeFiveSym', style='normal', variant='normal', weight=400, stretch='normal', size='scalable')) = 11.05
2026-07-21 14:55:57 runnervm3jd5f matplotlib.font_manager[2874] DEBUG findfont: score(FontEntry(fname='/home/runner/micromamba/envs/trajan/lib/python3.14/site-packages/matplotlib/mpl-data/fonts/ttf/STIXNonUniBol.ttf', index=0, name='STIXNonUnicode', style='normal', variant='normal', weight=700, stretch='normal', size='scalable')) = 11.335
2026-07-21 14:55:57 runnervm3jd5f matplotlib.font_manager[2874] DEBUG findfont: score(FontEntry(fname='/home/runner/micromamba/envs/trajan/lib/python3.14/site-packages/matplotlib/mpl-data/fonts/ttf/DejaVuSansDisplay.ttf', index=0, name='DejaVu Sans Display', style='normal', variant='normal', weight=400, stretch='normal', size='scalable')) = 11.05
2026-07-21 14:55:57 runnervm3jd5f matplotlib.font_manager[2874] DEBUG findfont: score(FontEntry(fname='/home/runner/micromamba/envs/trajan/lib/python3.14/site-packages/matplotlib/mpl-data/fonts/ttf/DejaVuSansMono.ttf', index=0, name='DejaVu Sans Mono', style='normal', variant='normal', weight=400, stretch='normal', size='scalable')) = 11.05
2026-07-21 14:55:57 runnervm3jd5f matplotlib.font_manager[2874] DEBUG findfont: score(FontEntry(fname='/home/runner/micromamba/envs/trajan/lib/python3.14/site-packages/matplotlib/mpl-data/fonts/ttf/cmb10.ttf', index=0, name='cmb10', style='normal', variant='normal', weight=400, stretch='normal', size='scalable')) = 11.05
2026-07-21 14:55:57 runnervm3jd5f matplotlib.font_manager[2874] DEBUG findfont: score(FontEntry(fname='/home/runner/micromamba/envs/trajan/lib/python3.14/site-packages/matplotlib/mpl-data/fonts/ttf/STIXSizTwoSymReg.ttf', index=0, name='STIXSizeTwoSym', style='normal', variant='normal', weight=400, stretch='normal', size='scalable')) = 11.05
2026-07-21 14:55:57 runnervm3jd5f matplotlib.font_manager[2874] DEBUG findfont: score(FontEntry(fname='/home/runner/micromamba/envs/trajan/lib/python3.14/site-packages/matplotlib/mpl-data/fonts/ttf/DejaVuSans.ttf', index=0, name='DejaVu Sans', style='normal', variant='normal', weight=400, stretch='normal', size='scalable')) = 11.05
2026-07-21 14:55:57 runnervm3jd5f matplotlib.font_manager[2874] DEBUG findfont: score(FontEntry(fname='/home/runner/micromamba/envs/trajan/lib/python3.14/site-packages/matplotlib/mpl-data/fonts/ttf/STIXNonUni.ttf', index=0, name='STIXNonUnicode', style='normal', variant='normal', weight=400, stretch='normal', size='scalable')) = 11.05
2026-07-21 14:55:57 runnervm3jd5f matplotlib.font_manager[2874] DEBUG findfont: score(FontEntry(fname='/home/runner/micromamba/envs/trajan/lib/python3.14/site-packages/matplotlib/mpl-data/fonts/ttf/STIXGeneralItalic.ttf', index=0, name='STIXGeneral', style='italic', variant='normal', weight=400, stretch='normal', size='scalable')) = 0.05
2026-07-21 14:55:57 runnervm3jd5f matplotlib.font_manager[2874] DEBUG findfont: score(FontEntry(fname='/home/runner/micromamba/envs/trajan/lib/python3.14/site-packages/matplotlib/mpl-data/fonts/ttf/STIXSizOneSymBol.ttf', index=0, name='STIXSizeOneSym', style='normal', variant='normal', weight=700, stretch='normal', size='scalable')) = 11.335
2026-07-21 14:55:57 runnervm3jd5f matplotlib.font_manager[2874] DEBUG findfont: score(FontEntry(fname='/home/runner/micromamba/envs/trajan/lib/python3.14/site-packages/matplotlib/mpl-data/fonts/ttf/DejaVuSansMono-Bold.ttf', index=0, name='DejaVu Sans Mono', style='normal', variant='normal', weight=700, stretch='normal', size='scalable')) = 11.335
2026-07-21 14:55:57 runnervm3jd5f matplotlib.font_manager[2874] DEBUG findfont: score(FontEntry(fname='/home/runner/micromamba/envs/trajan/lib/python3.14/site-packages/matplotlib/mpl-data/fonts/ttf/STIXSizTwoSymBol.ttf', index=0, name='STIXSizeTwoSym', style='normal', variant='normal', weight=700, stretch='normal', size='scalable')) = 11.335
2026-07-21 14:55:57 runnervm3jd5f matplotlib.font_manager[2874] DEBUG findfont: score(FontEntry(fname='/home/runner/micromamba/envs/trajan/lib/python3.14/site-packages/matplotlib/mpl-data/fonts/ttf/STIXSizThreeSymBol.ttf', index=0, name='STIXSizeThreeSym', style='normal', variant='normal', weight=700, stretch='normal', size='scalable')) = 11.335
2026-07-21 14:55:57 runnervm3jd5f matplotlib.font_manager[2874] DEBUG findfont: score(FontEntry(fname='/home/runner/micromamba/envs/trajan/lib/python3.14/site-packages/matplotlib/mpl-data/fonts/ttf/DejaVuSerif-BoldItalic.ttf', index=0, name='DejaVu Serif', style='italic', variant='normal', weight=700, stretch='normal', size='scalable')) = 10.335
2026-07-21 14:55:57 runnervm3jd5f matplotlib.font_manager[2874] DEBUG findfont: score(FontEntry(fname='/home/runner/micromamba/envs/trajan/lib/python3.14/site-packages/matplotlib/mpl-data/fonts/ttf/DejaVuSerif-Italic.ttf', index=0, name='DejaVu Serif', style='italic', variant='normal', weight=400, stretch='normal', size='scalable')) = 10.05
2026-07-21 14:55:57 runnervm3jd5f matplotlib.font_manager[2874] DEBUG findfont: score(FontEntry(fname='/home/runner/micromamba/envs/trajan/lib/python3.14/site-packages/matplotlib/mpl-data/fonts/ttf/DejaVuSans-Bold.ttf', index=0, name='DejaVu Sans', style='normal', variant='normal', weight=700, stretch='normal', size='scalable')) = 11.335
2026-07-21 14:55:57 runnervm3jd5f matplotlib.font_manager[2874] DEBUG findfont: score(FontEntry(fname='/home/runner/micromamba/envs/trajan/lib/python3.14/site-packages/matplotlib/mpl-data/fonts/ttf/STIXSizFourSymBol.ttf', index=0, name='STIXSizeFourSym', style='normal', variant='normal', weight=700, stretch='normal', size='scalable')) = 11.335
2026-07-21 14:55:57 runnervm3jd5f matplotlib.font_manager[2874] DEBUG findfont: score(FontEntry(fname='/home/runner/micromamba/envs/trajan/lib/python3.14/site-packages/matplotlib/mpl-data/fonts/ttf/STIXSizOneSymReg.ttf', index=0, name='STIXSizeOneSym', style='normal', variant='normal', weight=400, stretch='normal', size='scalable')) = 11.05
2026-07-21 14:55:57 runnervm3jd5f matplotlib.font_manager[2874] DEBUG findfont: score(FontEntry(fname='/home/runner/micromamba/envs/trajan/lib/python3.14/site-packages/matplotlib/mpl-data/fonts/ttf/cmr10.ttf', index=0, name='cmr10', style='normal', variant='normal', weight=400, stretch='normal', size='scalable')) = 11.05
2026-07-21 14:55:57 runnervm3jd5f matplotlib.font_manager[2874] DEBUG findfont: score(FontEntry(fname='/home/runner/micromamba/envs/trajan/lib/python3.14/site-packages/matplotlib/mpl-data/fonts/ttf/STIXGeneralBol.ttf', index=0, name='STIXGeneral', style='normal', variant='normal', weight=700, stretch='normal', size='scalable')) = 1.335
2026-07-21 14:55:57 runnervm3jd5f matplotlib.font_manager[2874] DEBUG findfont: score(FontEntry(fname='/home/runner/micromamba/envs/trajan/lib/python3.14/site-packages/matplotlib/mpl-data/fonts/ttf/DejaVuSans-BoldOblique.ttf', index=0, name='DejaVu Sans', style='oblique', variant='normal', weight=700, stretch='normal', size='scalable')) = 10.434999999999999
2026-07-21 14:55:57 runnervm3jd5f matplotlib.font_manager[2874] DEBUG findfont: score(FontEntry(fname='/home/runner/micromamba/envs/trajan/lib/python3.14/site-packages/matplotlib/mpl-data/fonts/ttf/STIXSizFourSymReg.ttf', index=0, name='STIXSizeFourSym', style='normal', variant='normal', weight=400, stretch='normal', size='scalable')) = 11.05
2026-07-21 14:55:57 runnervm3jd5f matplotlib.font_manager[2874] DEBUG findfont: score(FontEntry(fname='/usr/share/fonts/truetype/lato/Lato-Black.ttf', index=0, name='Lato', style='normal', variant='normal', weight=900, stretch='normal', size='scalable')) = 11.525
2026-07-21 14:55:57 runnervm3jd5f matplotlib.font_manager[2874] DEBUG findfont: score(FontEntry(fname='/usr/share/fonts/truetype/lato/Lato-Black.ttf', index=0, name='Lato Black', style='normal', variant='normal', weight=400, stretch='normal', size='scalable')) = 11.05
2026-07-21 14:55:57 runnervm3jd5f matplotlib.font_manager[2874] DEBUG findfont: score(FontEntry(fname='/usr/share/fonts/truetype/liberation/LiberationSerif-Regular.ttf', index=0, name='Liberation Serif', style='normal', variant='normal', weight=400, stretch='normal', size='scalable')) = 11.05
2026-07-21 14:55:57 runnervm3jd5f matplotlib.font_manager[2874] DEBUG findfont: score(FontEntry(fname='/usr/share/fonts/truetype/dejavu/DejaVuSerifCondensed.ttf', index=0, name='DejaVu Serif', style='normal', variant='normal', weight=400, stretch='condensed', size='scalable')) = 11.25
2026-07-21 14:55:57 runnervm3jd5f matplotlib.font_manager[2874] DEBUG findfont: score(FontEntry(fname='/usr/share/fonts/truetype/dejavu/DejaVuSerifCondensed.ttf', index=0, name='DejaVu Serif Condensed', style='normal', variant='normal', weight=380, stretch='condensed', size='scalable')) = 11.269
2026-07-21 14:55:57 runnervm3jd5f matplotlib.font_manager[2874] DEBUG findfont: score(FontEntry(fname='/home/runner/micromamba/envs/trajan/fonts/UbuntuMono-BI.ttf', index=0, name='Ubuntu Mono', style='italic', variant='normal', weight=700, stretch='normal', size='scalable')) = 10.335
2026-07-21 14:55:57 runnervm3jd5f matplotlib.font_manager[2874] DEBUG findfont: score(FontEntry(fname='/usr/share/fonts/truetype/dejavu/DejaVuSans.ttf', index=0, name='DejaVu Sans', style='normal', variant='normal', weight=400, stretch='normal', size='scalable')) = 11.05
2026-07-21 14:55:57 runnervm3jd5f matplotlib.font_manager[2874] DEBUG findfont: score(FontEntry(fname='/usr/share/fonts/truetype/lato/Lato-Italic.ttf', index=0, name='Lato', style='italic', variant='normal', weight=400, stretch='normal', size='scalable')) = 10.05
2026-07-21 14:55:57 runnervm3jd5f matplotlib.font_manager[2874] DEBUG findfont: score(FontEntry(fname='/usr/share/fonts/truetype/liberation/LiberationSans-Italic.ttf', index=0, name='Liberation Sans', style='italic', variant='normal', weight=400, stretch='normal', size='scalable')) = 10.05
2026-07-21 14:55:57 runnervm3jd5f matplotlib.font_manager[2874] DEBUG findfont: score(FontEntry(fname='/home/runner/micromamba/envs/trajan/fonts/Ubuntu-B.ttf', index=0, name='Ubuntu', style='normal', variant='normal', weight=700, stretch='normal', size='scalable')) = 11.335
2026-07-21 14:55:57 runnervm3jd5f matplotlib.font_manager[2874] DEBUG findfont: score(FontEntry(fname='/home/runner/micromamba/envs/trajan/fonts/SourceCodePro-Semibold.ttf', index=0, name='Source Code Pro', style='normal', variant='normal', weight=600, stretch='normal', size='scalable')) = 11.24
2026-07-21 14:55:57 runnervm3jd5f matplotlib.font_manager[2874] DEBUG findfont: score(FontEntry(fname='/home/runner/micromamba/envs/trajan/fonts/SourceCodePro-Semibold.ttf', index=0, name='Source Code Pro Semibold', style='normal', variant='normal', weight=400, stretch='normal', size='scalable')) = 11.05
2026-07-21 14:55:57 runnervm3jd5f matplotlib.font_manager[2874] DEBUG findfont: score(FontEntry(fname='/home/runner/micromamba/envs/trajan/fonts/SourceCodePro-Bold.ttf', index=0, name='Source Code Pro', style='normal', variant='normal', weight=700, stretch='normal', size='scalable')) = 11.335
2026-07-21 14:55:57 runnervm3jd5f matplotlib.font_manager[2874] DEBUG findfont: score(FontEntry(fname='/home/runner/micromamba/envs/trajan/fonts/Ubuntu-MI.ttf', index=0, name='Ubuntu', style='italic', variant='normal', weight=500, stretch='normal', size='scalable')) = 10.145
2026-07-21 14:55:57 runnervm3jd5f matplotlib.font_manager[2874] DEBUG findfont: score(FontEntry(fname='/home/runner/micromamba/envs/trajan/fonts/Ubuntu-MI.ttf', index=0, name='Ubuntu Light', style='italic', variant='normal', weight=700, stretch='normal', size='scalable')) = 10.335
2026-07-21 14:55:57 runnervm3jd5f matplotlib.font_manager[2874] DEBUG findfont: score(FontEntry(fname='/usr/share/fonts/truetype/lato/Lato-Regular.ttf', index=0, name='Lato', style='normal', variant='normal', weight=400, stretch='normal', size='scalable')) = 11.05
2026-07-21 14:55:57 runnervm3jd5f matplotlib.font_manager[2874] DEBUG findfont: score(FontEntry(fname='/usr/share/fonts/truetype/lato/Lato-ThinItalic.ttf', index=0, name='Lato', style='italic', variant='normal', weight=275, stretch='normal', size='scalable')) = 10.16875
2026-07-21 14:55:57 runnervm3jd5f matplotlib.font_manager[2874] DEBUG findfont: score(FontEntry(fname='/usr/share/fonts/truetype/lato/Lato-ThinItalic.ttf', index=0, name='Lato Thin', style='italic', variant='normal', weight=400, stretch='normal', size='scalable')) = 10.05
2026-07-21 14:55:57 runnervm3jd5f matplotlib.font_manager[2874] DEBUG findfont: score(FontEntry(fname='/usr/share/fonts/truetype/lato/Lato-BlackItalic.ttf', index=0, name='Lato', style='italic', variant='normal', weight=900, stretch='normal', size='scalable')) = 10.525
2026-07-21 14:55:57 runnervm3jd5f matplotlib.font_manager[2874] DEBUG findfont: score(FontEntry(fname='/usr/share/fonts/truetype/lato/Lato-BlackItalic.ttf', index=0, name='Lato Black', style='italic', variant='normal', weight=400, stretch='normal', size='scalable')) = 10.05
2026-07-21 14:55:57 runnervm3jd5f matplotlib.font_manager[2874] DEBUG findfont: score(FontEntry(fname='/usr/share/fonts/truetype/dejavu/DejaVuSerifCondensed-Italic.ttf', index=0, name='DejaVu Serif', style='italic', variant='normal', weight=400, stretch='condensed', size='scalable')) = 10.25
2026-07-21 14:55:57 runnervm3jd5f matplotlib.font_manager[2874] DEBUG findfont: score(FontEntry(fname='/usr/share/fonts/truetype/dejavu/DejaVuSerifCondensed-Italic.ttf', index=0, name='DejaVu Serif Condensed', style='italic', variant='normal', weight=400, stretch='condensed', size='scalable')) = 10.25
2026-07-21 14:55:57 runnervm3jd5f matplotlib.font_manager[2874] DEBUG findfont: score(FontEntry(fname='/usr/share/fonts/truetype/dejavu/DejaVuSans-Bold.ttf', index=0, name='DejaVu Sans', style='normal', variant='normal', weight=700, stretch='normal', size='scalable')) = 11.335
2026-07-21 14:55:57 runnervm3jd5f matplotlib.font_manager[2874] DEBUG findfont: score(FontEntry(fname='/home/runner/micromamba/envs/trajan/fonts/UbuntuMono-R.ttf', index=0, name='Ubuntu Mono', style='normal', variant='normal', weight=400, stretch='normal', size='scalable')) = 11.05
2026-07-21 14:55:57 runnervm3jd5f matplotlib.font_manager[2874] DEBUG findfont: score(FontEntry(fname='/usr/share/fonts/truetype/dejavu/DejaVuSerif-BoldItalic.ttf', index=0, name='DejaVu Serif', style='italic', variant='normal', weight=700, stretch='normal', size='scalable')) = 10.335
2026-07-21 14:55:57 runnervm3jd5f matplotlib.font_manager[2874] DEBUG findfont: score(FontEntry(fname='/usr/share/fonts/truetype/lato/Lato-Hairline.ttf', index=0, name='Lato', style='normal', variant='normal', weight=250, stretch='normal', size='scalable')) = 11.1925
2026-07-21 14:55:57 runnervm3jd5f matplotlib.font_manager[2874] DEBUG findfont: score(FontEntry(fname='/usr/share/fonts/truetype/lato/Lato-Hairline.ttf', index=0, name='Lato Hairline', style='normal', variant='normal', weight=400, stretch='normal', size='scalable')) = 11.05
2026-07-21 14:55:57 runnervm3jd5f matplotlib.font_manager[2874] DEBUG findfont: score(FontEntry(fname='/usr/share/fonts/truetype/lato/Lato-LightItalic.ttf', index=0, name='Lato', style='italic', variant='normal', weight=300, stretch='normal', size='scalable')) = 10.145
2026-07-21 14:55:57 runnervm3jd5f matplotlib.font_manager[2874] DEBUG findfont: score(FontEntry(fname='/usr/share/fonts/truetype/lato/Lato-LightItalic.ttf', index=0, name='Lato Light', style='italic', variant='normal', weight=400, stretch='normal', size='scalable')) = 10.05
2026-07-21 14:55:57 runnervm3jd5f matplotlib.font_manager[2874] DEBUG findfont: score(FontEntry(fname='/usr/share/fonts/truetype/dejavu/DejaVuSansCondensed-BoldOblique.ttf', index=0, name='DejaVu Sans', style='oblique', variant='normal', weight=700, stretch='condensed', size='scalable')) = 10.634999999999998
2026-07-21 14:55:57 runnervm3jd5f matplotlib.font_manager[2874] DEBUG findfont: score(FontEntry(fname='/usr/share/fonts/truetype/dejavu/DejaVuSansCondensed-BoldOblique.ttf', index=0, name='DejaVu Sans Condensed', style='oblique', variant='normal', weight=700, stretch='condensed', size='scalable')) = 10.634999999999998
2026-07-21 14:55:57 runnervm3jd5f matplotlib.font_manager[2874] DEBUG findfont: score(FontEntry(fname='/home/runner/micromamba/envs/trajan/fonts/SourceCodePro-It.ttf', index=0, name='Source Code Pro', style='italic', variant='normal', weight=400, stretch='normal', size='scalable')) = 10.05
2026-07-21 14:55:57 runnervm3jd5f matplotlib.font_manager[2874] DEBUG findfont: score(FontEntry(fname='/home/runner/micromamba/envs/trajan/fonts/SourceCodePro-ExtraLightIt.ttf', index=0, name='Source Code Pro', style='italic', variant='normal', weight=200, stretch='normal', size='scalable')) = 10.24
2026-07-21 14:55:57 runnervm3jd5f matplotlib.font_manager[2874] DEBUG findfont: score(FontEntry(fname='/home/runner/micromamba/envs/trajan/fonts/SourceCodePro-ExtraLightIt.ttf', index=0, name='Source Code Pro ExtraLight', style='italic', variant='normal', weight=400, stretch='normal', size='scalable')) = 10.05
2026-07-21 14:55:57 runnervm3jd5f matplotlib.font_manager[2874] DEBUG findfont: score(FontEntry(fname='/usr/share/fonts/truetype/lato/Lato-Medium.ttf', index=0, name='Lato', style='normal', variant='normal', weight=500, stretch='normal', size='scalable')) = 11.145
2026-07-21 14:55:57 runnervm3jd5f matplotlib.font_manager[2874] DEBUG findfont: score(FontEntry(fname='/usr/share/fonts/truetype/lato/Lato-Medium.ttf', index=0, name='Lato Medium', style='normal', variant='normal', weight=400, stretch='normal', size='scalable')) = 11.05
2026-07-21 14:55:57 runnervm3jd5f matplotlib.font_manager[2874] DEBUG findfont: score(FontEntry(fname='/usr/share/fonts/truetype/lato/Lato-BoldItalic.ttf', index=0, name='Lato', style='italic', variant='normal', weight=700, stretch='normal', size='scalable')) = 10.335
2026-07-21 14:55:57 runnervm3jd5f matplotlib.font_manager[2874] DEBUG findfont: score(FontEntry(fname='/home/runner/micromamba/envs/trajan/fonts/DejaVuSans.ttf', index=0, name='DejaVu Sans', style='normal', variant='normal', weight=400, stretch='normal', size='scalable')) = 11.05
2026-07-21 14:55:57 runnervm3jd5f matplotlib.font_manager[2874] DEBUG findfont: score(FontEntry(fname='/home/runner/micromamba/envs/trajan/fonts/UbuntuMono-B.ttf', index=0, name='Ubuntu Mono', style='normal', variant='normal', weight=700, stretch='normal', size='scalable')) = 11.335
2026-07-21 14:55:57 runnervm3jd5f matplotlib.font_manager[2874] DEBUG findfont: score(FontEntry(fname='/home/runner/micromamba/envs/trajan/fonts/SourceCodePro-LightIt.ttf', index=0, name='Source Code Pro', style='italic', variant='normal', weight=300, stretch='normal', size='scalable')) = 10.145
2026-07-21 14:55:57 runnervm3jd5f matplotlib.font_manager[2874] DEBUG findfont: score(FontEntry(fname='/home/runner/micromamba/envs/trajan/fonts/SourceCodePro-LightIt.ttf', index=0, name='Source Code Pro Light', style='italic', variant='normal', weight=400, stretch='normal', size='scalable')) = 10.05
2026-07-21 14:55:57 runnervm3jd5f matplotlib.font_manager[2874] DEBUG findfont: score(FontEntry(fname='/usr/share/fonts/truetype/liberation/LiberationSans-BoldItalic.ttf', index=0, name='Liberation Sans', style='italic', variant='normal', weight=700, stretch='normal', size='scalable')) = 10.335
2026-07-21 14:55:57 runnervm3jd5f matplotlib.font_manager[2874] DEBUG findfont: score(FontEntry(fname='/usr/share/fonts/truetype/liberation/LiberationSans-Regular.ttf', index=0, name='Liberation Sans', style='normal', variant='normal', weight=400, stretch='normal', size='scalable')) = 11.05
2026-07-21 14:55:57 runnervm3jd5f matplotlib.font_manager[2874] DEBUG findfont: score(FontEntry(fname='/usr/share/fonts/truetype/dejavu/DejaVuSansMono-Bold.ttf', index=0, name='DejaVu Sans Mono', style='normal', variant='normal', weight=700, stretch='normal', size='scalable')) = 11.335
2026-07-21 14:55:57 runnervm3jd5f matplotlib.font_manager[2874] DEBUG findfont: score(FontEntry(fname='/home/runner/micromamba/envs/trajan/fonts/SourceCodePro-BoldIt.ttf', index=0, name='Source Code Pro', style='italic', variant='normal', weight=700, stretch='normal', size='scalable')) = 10.335
2026-07-21 14:55:57 runnervm3jd5f matplotlib.font_manager[2874] DEBUG findfont: score(FontEntry(fname='/usr/share/fonts/truetype/lato/Lato-Bold.ttf', index=0, name='Lato', style='normal', variant='normal', weight=700, stretch='normal', size='scalable')) = 11.335
2026-07-21 14:55:57 runnervm3jd5f matplotlib.font_manager[2874] DEBUG findfont: score(FontEntry(fname='/usr/share/fonts/truetype/dejavu/DejaVuSansCondensed.ttf', index=0, name='DejaVu Sans', style='normal', variant='normal', weight=400, stretch='condensed', size='scalable')) = 11.25
2026-07-21 14:55:57 runnervm3jd5f matplotlib.font_manager[2874] DEBUG findfont: score(FontEntry(fname='/usr/share/fonts/truetype/dejavu/DejaVuSansCondensed.ttf', index=0, name='DejaVu Sans Condensed', style='normal', variant='normal', weight=380, stretch='condensed', size='scalable')) = 11.269
2026-07-21 14:55:57 runnervm3jd5f matplotlib.font_manager[2874] DEBUG findfont: score(FontEntry(fname='/usr/share/fonts/truetype/lato/Lato-MediumItalic.ttf', index=0, name='Lato', style='italic', variant='normal', weight=500, stretch='normal', size='scalable')) = 10.145
2026-07-21 14:55:57 runnervm3jd5f matplotlib.font_manager[2874] DEBUG findfont: score(FontEntry(fname='/usr/share/fonts/truetype/lato/Lato-MediumItalic.ttf', index=0, name='Lato Medium', style='italic', variant='normal', weight=400, stretch='normal', size='scalable')) = 10.05
2026-07-21 14:55:57 runnervm3jd5f matplotlib.font_manager[2874] DEBUG findfont: score(FontEntry(fname='/usr/share/fonts/truetype/liberation/LiberationSans-Bold.ttf', index=0, name='Liberation Sans', style='normal', variant='normal', weight=700, stretch='normal', size='scalable')) = 11.335
2026-07-21 14:55:57 runnervm3jd5f matplotlib.font_manager[2874] DEBUG findfont: score(FontEntry(fname='/usr/share/fonts/truetype/dejavu/DejaVuSerifCondensed-BoldItalic.ttf', index=0, name='DejaVu Serif', style='italic', variant='normal', weight=700, stretch='condensed', size='scalable')) = 10.535
2026-07-21 14:55:57 runnervm3jd5f matplotlib.font_manager[2874] DEBUG findfont: score(FontEntry(fname='/usr/share/fonts/truetype/dejavu/DejaVuSerifCondensed-BoldItalic.ttf', index=0, name='DejaVu Serif Condensed', style='italic', variant='normal', weight=700, stretch='condensed', size='scalable')) = 10.535
2026-07-21 14:55:57 runnervm3jd5f matplotlib.font_manager[2874] DEBUG findfont: score(FontEntry(fname='/home/runner/micromamba/envs/trajan/fonts/Ubuntu-R.ttf', index=0, name='Ubuntu', style='normal', variant='normal', weight=400, stretch='normal', size='scalable')) = 11.05
2026-07-21 14:55:57 runnervm3jd5f matplotlib.font_manager[2874] DEBUG findfont: score(FontEntry(fname='/usr/share/fonts/truetype/lato/Lato-Light.ttf', index=0, name='Lato', style='normal', variant='normal', weight=300, stretch='normal', size='scalable')) = 11.145
2026-07-21 14:55:57 runnervm3jd5f matplotlib.font_manager[2874] DEBUG findfont: score(FontEntry(fname='/usr/share/fonts/truetype/lato/Lato-Light.ttf', index=0, name='Lato Light', style='normal', variant='normal', weight=400, stretch='normal', size='scalable')) = 11.05
2026-07-21 14:55:57 runnervm3jd5f matplotlib.font_manager[2874] DEBUG findfont: score(FontEntry(fname='/usr/share/fonts/truetype/liberation/LiberationSerif-BoldItalic.ttf', index=0, name='Liberation Serif', style='italic', variant='normal', weight=700, stretch='normal', size='scalable')) = 10.335
2026-07-21 14:55:57 runnervm3jd5f matplotlib.font_manager[2874] DEBUG findfont: score(FontEntry(fname='/home/runner/micromamba/envs/trajan/fonts/Ubuntu-Th.ttf', index=0, name='Ubuntu', style='normal', variant='normal', weight=250, stretch='normal', size='scalable')) = 11.1925
2026-07-21 14:55:57 runnervm3jd5f matplotlib.font_manager[2874] DEBUG findfont: score(FontEntry(fname='/home/runner/micromamba/envs/trajan/fonts/Ubuntu-Th.ttf', index=0, name='Ubuntu Thin', style='normal', variant='normal', weight=400, stretch='normal', size='scalable')) = 11.05
2026-07-21 14:55:57 runnervm3jd5f matplotlib.font_manager[2874] DEBUG findfont: score(FontEntry(fname='/home/runner/micromamba/envs/trajan/fonts/SourceCodePro-ExtraLight.ttf', index=0, name='Source Code Pro', style='normal', variant='normal', weight=200, stretch='normal', size='scalable')) = 11.24
2026-07-21 14:55:57 runnervm3jd5f matplotlib.font_manager[2874] DEBUG findfont: score(FontEntry(fname='/home/runner/micromamba/envs/trajan/fonts/SourceCodePro-ExtraLight.ttf', index=0, name='Source Code Pro ExtraLight', style='normal', variant='normal', weight=400, stretch='normal', size='scalable')) = 11.05
2026-07-21 14:55:57 runnervm3jd5f matplotlib.font_manager[2874] DEBUG findfont: score(FontEntry(fname='/usr/share/fonts/truetype/lato/Lato-Thin.ttf', index=0, name='Lato', style='normal', variant='normal', weight=275, stretch='normal', size='scalable')) = 11.16875
2026-07-21 14:55:57 runnervm3jd5f matplotlib.font_manager[2874] DEBUG findfont: score(FontEntry(fname='/usr/share/fonts/truetype/lato/Lato-Thin.ttf', index=0, name='Lato Thin', style='normal', variant='normal', weight=400, stretch='normal', size='scalable')) = 11.05
2026-07-21 14:55:57 runnervm3jd5f matplotlib.font_manager[2874] DEBUG findfont: score(FontEntry(fname='/usr/share/fonts/truetype/liberation/LiberationSerif-Bold.ttf', index=0, name='Liberation Serif', style='normal', variant='normal', weight=700, stretch='normal', size='scalable')) = 11.335
2026-07-21 14:55:57 runnervm3jd5f matplotlib.font_manager[2874] DEBUG findfont: score(FontEntry(fname='/home/runner/micromamba/envs/trajan/fonts/Inconsolata-Regular.ttf', index=0, name='Inconsolata', style='normal', variant='normal', weight=400, stretch='normal', size='scalable')) = 11.05
2026-07-21 14:55:57 runnervm3jd5f matplotlib.font_manager[2874] DEBUG findfont: score(FontEntry(fname='/home/runner/micromamba/envs/trajan/fonts/Ubuntu-C.ttf', index=0, name='Ubuntu Condensed', style='normal', variant='normal', weight=400, stretch='condensed', size='scalable')) = 11.25
2026-07-21 14:55:57 runnervm3jd5f matplotlib.font_manager[2874] DEBUG findfont: score(FontEntry(fname='/usr/share/fonts/truetype/dejavu/DejaVuSansCondensed-Bold.ttf', index=0, name='DejaVu Sans', style='normal', variant='normal', weight=700, stretch='condensed', size='scalable')) = 11.535
2026-07-21 14:55:57 runnervm3jd5f matplotlib.font_manager[2874] DEBUG findfont: score(FontEntry(fname='/usr/share/fonts/truetype/dejavu/DejaVuSansCondensed-Bold.ttf', index=0, name='DejaVu Sans Condensed', style='normal', variant='normal', weight=700, stretch='condensed', size='scalable')) = 11.535
2026-07-21 14:55:57 runnervm3jd5f matplotlib.font_manager[2874] DEBUG findfont: score(FontEntry(fname='/usr/share/fonts/truetype/liberation/LiberationMono-Bold.ttf', index=0, name='Liberation Mono', style='normal', variant='normal', weight=700, stretch='normal', size='scalable')) = 11.335
2026-07-21 14:55:57 runnervm3jd5f matplotlib.font_manager[2874] DEBUG findfont: score(FontEntry(fname='/home/runner/micromamba/envs/trajan/fonts/SourceCodePro-Black.ttf', index=0, name='Source Code Pro', style='normal', variant='normal', weight=900, stretch='normal', size='scalable')) = 11.525
2026-07-21 14:55:57 runnervm3jd5f matplotlib.font_manager[2874] DEBUG findfont: score(FontEntry(fname='/home/runner/micromamba/envs/trajan/fonts/SourceCodePro-Black.ttf', index=0, name='Source Code Pro Black', style='normal', variant='normal', weight=400, stretch='normal', size='scalable')) = 11.05
2026-07-21 14:55:57 runnervm3jd5f matplotlib.font_manager[2874] DEBUG findfont: score(FontEntry(fname='/home/runner/micromamba/envs/trajan/fonts/SourceCodePro-BlackIt.ttf', index=0, name='Source Code Pro', style='italic', variant='normal', weight=900, stretch='normal', size='scalable')) = 10.525
2026-07-21 14:55:57 runnervm3jd5f matplotlib.font_manager[2874] DEBUG findfont: score(FontEntry(fname='/home/runner/micromamba/envs/trajan/fonts/SourceCodePro-BlackIt.ttf', index=0, name='Source Code Pro Black', style='italic', variant='normal', weight=400, stretch='normal', size='scalable')) = 10.05
2026-07-21 14:55:57 runnervm3jd5f matplotlib.font_manager[2874] DEBUG findfont: score(FontEntry(fname='/home/runner/micromamba/envs/trajan/fonts/Ubuntu-LI.ttf', index=0, name='Ubuntu', style='italic', variant='normal', weight=300, stretch='normal', size='scalable')) = 10.145
2026-07-21 14:55:57 runnervm3jd5f matplotlib.font_manager[2874] DEBUG findfont: score(FontEntry(fname='/home/runner/micromamba/envs/trajan/fonts/Ubuntu-LI.ttf', index=0, name='Ubuntu Light', style='italic', variant='normal', weight=400, stretch='normal', size='scalable')) = 10.05
2026-07-21 14:55:57 runnervm3jd5f matplotlib.font_manager[2874] DEBUG findfont: score(FontEntry(fname='/usr/share/fonts/truetype/liberation/LiberationMono-Regular.ttf', index=0, name='Liberation Mono', style='normal', variant='normal', weight=400, stretch='normal', size='scalable')) = 11.05
2026-07-21 14:55:57 runnervm3jd5f matplotlib.font_manager[2874] DEBUG findfont: score(FontEntry(fname='/home/runner/micromamba/envs/trajan/fonts/UbuntuMono-RI.ttf', index=0, name='Ubuntu Mono', style='italic', variant='normal', weight=400, stretch='normal', size='scalable')) = 10.05
2026-07-21 14:55:57 runnervm3jd5f matplotlib.font_manager[2874] DEBUG findfont: score(FontEntry(fname='/usr/share/fonts/truetype/lato/Lato-Heavy.ttf', index=0, name='Lato', style='normal', variant='normal', weight=800, stretch='normal', size='scalable')) = 11.43
2026-07-21 14:55:57 runnervm3jd5f matplotlib.font_manager[2874] DEBUG findfont: score(FontEntry(fname='/usr/share/fonts/truetype/lato/Lato-Heavy.ttf', index=0, name='Lato Heavy', style='normal', variant='normal', weight=400, stretch='normal', size='scalable')) = 11.05
2026-07-21 14:55:57 runnervm3jd5f matplotlib.font_manager[2874] DEBUG findfont: score(FontEntry(fname='/usr/share/fonts/truetype/lato/Lato-HairlineItalic.ttf', index=0, name='Lato', style='italic', variant='normal', weight=250, stretch='normal', size='scalable')) = 10.1925
2026-07-21 14:55:57 runnervm3jd5f matplotlib.font_manager[2874] DEBUG findfont: score(FontEntry(fname='/usr/share/fonts/truetype/lato/Lato-HairlineItalic.ttf', index=0, name='Lato Hairline', style='italic', variant='normal', weight=400, stretch='normal', size='scalable')) = 10.05
2026-07-21 14:55:57 runnervm3jd5f matplotlib.font_manager[2874] DEBUG findfont: score(FontEntry(fname='/usr/share/fonts/truetype/dejavu/DejaVuSerifCondensed-Bold.ttf', index=0, name='DejaVu Serif', style='normal', variant='normal', weight=700, stretch='condensed', size='scalable')) = 11.535
2026-07-21 14:55:57 runnervm3jd5f matplotlib.font_manager[2874] DEBUG findfont: score(FontEntry(fname='/usr/share/fonts/truetype/dejavu/DejaVuSerifCondensed-Bold.ttf', index=0, name='DejaVu Serif Condensed', style='normal', variant='normal', weight=700, stretch='condensed', size='scalable')) = 11.535
2026-07-21 14:55:57 runnervm3jd5f matplotlib.font_manager[2874] DEBUG findfont: score(FontEntry(fname='/usr/share/fonts/truetype/dejavu/DejaVuSansCondensed-Oblique.ttf', index=0, name='DejaVu Sans', style='oblique', variant='normal', weight=400, stretch='condensed', size='scalable')) = 10.35
2026-07-21 14:55:57 runnervm3jd5f matplotlib.font_manager[2874] DEBUG findfont: score(FontEntry(fname='/usr/share/fonts/truetype/dejavu/DejaVuSansCondensed-Oblique.ttf', index=0, name='DejaVu Sans Condensed', style='oblique', variant='normal', weight=400, stretch='condensed', size='scalable')) = 10.35
2026-07-21 14:55:57 runnervm3jd5f matplotlib.font_manager[2874] DEBUG findfont: score(FontEntry(fname='/usr/share/fonts/truetype/lato/Lato-SemiboldItalic.ttf', index=0, name='Lato', style='italic', variant='normal', weight=600, stretch='normal', size='scalable')) = 10.24
2026-07-21 14:55:57 runnervm3jd5f matplotlib.font_manager[2874] DEBUG findfont: score(FontEntry(fname='/usr/share/fonts/truetype/lato/Lato-SemiboldItalic.ttf', index=0, name='Lato Semibold', style='italic', variant='normal', weight=400, stretch='normal', size='scalable')) = 10.05
2026-07-21 14:55:57 runnervm3jd5f matplotlib.font_manager[2874] DEBUG findfont: score(FontEntry(fname='/usr/share/fonts/truetype/lato/Lato-Semibold.ttf', index=0, name='Lato', style='normal', variant='normal', weight=600, stretch='normal', size='scalable')) = 11.24
2026-07-21 14:55:57 runnervm3jd5f matplotlib.font_manager[2874] DEBUG findfont: score(FontEntry(fname='/usr/share/fonts/truetype/lato/Lato-Semibold.ttf', index=0, name='Lato Semibold', style='normal', variant='normal', weight=400, stretch='normal', size='scalable')) = 11.05
2026-07-21 14:55:57 runnervm3jd5f matplotlib.font_manager[2874] DEBUG findfont: score(FontEntry(fname='/home/runner/micromamba/envs/trajan/fonts/Inconsolata-Bold.ttf', index=0, name='Inconsolata', style='normal', variant='normal', weight=700, stretch='normal', size='scalable')) = 11.335
2026-07-21 14:55:57 runnervm3jd5f matplotlib.font_manager[2874] DEBUG findfont: score(FontEntry(fname='/usr/share/fonts/truetype/dejavu/DejaVuSans-ExtraLight.ttf', index=0, name='DejaVu Sans', style='normal', variant='normal', weight=200, stretch='normal', size='scalable')) = 11.24
2026-07-21 14:55:57 runnervm3jd5f matplotlib.font_manager[2874] DEBUG findfont: score(FontEntry(fname='/usr/share/fonts/truetype/dejavu/DejaVuSans-ExtraLight.ttf', index=0, name='DejaVu Sans Light', style='normal', variant='normal', weight=200, stretch='normal', size='scalable')) = 11.24
2026-07-21 14:55:57 runnervm3jd5f matplotlib.font_manager[2874] DEBUG findfont: score(FontEntry(fname='/home/runner/micromamba/envs/trajan/fonts/Ubuntu-BI.ttf', index=0, name='Ubuntu', style='italic', variant='normal', weight=700, stretch='normal', size='scalable')) = 10.335
2026-07-21 14:55:57 runnervm3jd5f matplotlib.font_manager[2874] DEBUG findfont: score(FontEntry(fname='/usr/share/fonts/truetype/dejavu/DejaVuSans-BoldOblique.ttf', index=0, name='DejaVu Sans', style='oblique', variant='normal', weight=700, stretch='normal', size='scalable')) = 10.434999999999999
2026-07-21 14:55:57 runnervm3jd5f matplotlib.font_manager[2874] DEBUG findfont: score(FontEntry(fname='/home/runner/micromamba/envs/trajan/fonts/Ubuntu-RI.ttf', index=0, name='Ubuntu', style='italic', variant='normal', weight=400, stretch='normal', size='scalable')) = 10.05
2026-07-21 14:55:57 runnervm3jd5f matplotlib.font_manager[2874] DEBUG findfont: score(FontEntry(fname='/usr/share/fonts/truetype/dejavu/DejaVuSerif-Italic.ttf', index=0, name='DejaVu Serif', style='italic', variant='normal', weight=400, stretch='normal', size='scalable')) = 10.05
2026-07-21 14:55:57 runnervm3jd5f matplotlib.font_manager[2874] DEBUG findfont: score(FontEntry(fname='/home/runner/micromamba/envs/trajan/fonts/SourceCodePro-Medium.ttf', index=0, name='Source Code Pro', style='normal', variant='normal', weight=500, stretch='normal', size='scalable')) = 11.145
2026-07-21 14:55:57 runnervm3jd5f matplotlib.font_manager[2874] DEBUG findfont: score(FontEntry(fname='/home/runner/micromamba/envs/trajan/fonts/SourceCodePro-Medium.ttf', index=0, name='Source Code Pro Medium', style='normal', variant='normal', weight=400, stretch='normal', size='scalable')) = 11.05
2026-07-21 14:55:57 runnervm3jd5f matplotlib.font_manager[2874] DEBUG findfont: score(FontEntry(fname='/usr/share/fonts/truetype/lato/Lato-HeavyItalic.ttf', index=0, name='Lato', style='italic', variant='normal', weight=800, stretch='normal', size='scalable')) = 10.43
2026-07-21 14:55:57 runnervm3jd5f matplotlib.font_manager[2874] DEBUG findfont: score(FontEntry(fname='/usr/share/fonts/truetype/lato/Lato-HeavyItalic.ttf', index=0, name='Lato Heavy', style='italic', variant='normal', weight=400, stretch='normal', size='scalable')) = 10.05
2026-07-21 14:55:57 runnervm3jd5f matplotlib.font_manager[2874] DEBUG findfont: score(FontEntry(fname='/usr/share/fonts/truetype/dejavu/DejaVuSans-Oblique.ttf', index=0, name='DejaVu Sans', style='oblique', variant='normal', weight=400, stretch='normal', size='scalable')) = 10.15
2026-07-21 14:55:57 runnervm3jd5f matplotlib.font_manager[2874] DEBUG findfont: score(FontEntry(fname='/home/runner/micromamba/envs/trajan/fonts/Ubuntu-M.ttf', index=0, name='Ubuntu', style='normal', variant='normal', weight=500, stretch='normal', size='scalable')) = 11.145
2026-07-21 14:55:57 runnervm3jd5f matplotlib.font_manager[2874] DEBUG findfont: score(FontEntry(fname='/home/runner/micromamba/envs/trajan/fonts/Ubuntu-M.ttf', index=0, name='Ubuntu Light', style='normal', variant='normal', weight=700, stretch='normal', size='scalable')) = 11.335
2026-07-21 14:55:57 runnervm3jd5f matplotlib.font_manager[2874] DEBUG findfont: score(FontEntry(fname='/usr/share/fonts/truetype/liberation/LiberationMono-BoldItalic.ttf', index=0, name='Liberation Mono', style='italic', variant='normal', weight=700, stretch='normal', size='scalable')) = 10.335
2026-07-21 14:55:57 runnervm3jd5f matplotlib.font_manager[2874] DEBUG findfont: score(FontEntry(fname='/usr/share/fonts/truetype/dejavu/DejaVuSansMono.ttf', index=0, name='DejaVu Sans Mono', style='normal', variant='normal', weight=400, stretch='normal', size='scalable')) = 11.05
2026-07-21 14:55:57 runnervm3jd5f matplotlib.font_manager[2874] DEBUG findfont: score(FontEntry(fname='/usr/share/fonts/truetype/dejavu/DejaVuMathTeXGyre.ttf', index=0, name='DejaVu Math TeX Gyre', style='normal', variant='normal', weight=400, stretch='normal', size='scalable')) = 11.05
2026-07-21 14:55:57 runnervm3jd5f matplotlib.font_manager[2874] DEBUG findfont: score(FontEntry(fname='/usr/share/fonts/truetype/dejavu/DejaVuSansMono-Oblique.ttf', index=0, name='DejaVu Sans Mono', style='oblique', variant='normal', weight=400, stretch='normal', size='scalable')) = 10.15
2026-07-21 14:55:57 runnervm3jd5f matplotlib.font_manager[2874] DEBUG findfont: score(FontEntry(fname='/home/runner/micromamba/envs/trajan/fonts/Ubuntu-L.ttf', index=0, name='Ubuntu', style='normal', variant='normal', weight=300, stretch='normal', size='scalable')) = 11.145
2026-07-21 14:55:57 runnervm3jd5f matplotlib.font_manager[2874] DEBUG findfont: score(FontEntry(fname='/home/runner/micromamba/envs/trajan/fonts/Ubuntu-L.ttf', index=0, name='Ubuntu Light', style='normal', variant='normal', weight=400, stretch='normal', size='scalable')) = 11.05
2026-07-21 14:55:57 runnervm3jd5f matplotlib.font_manager[2874] DEBUG findfont: score(FontEntry(fname='/home/runner/micromamba/envs/trajan/fonts/SourceCodePro-MediumIt.ttf', index=0, name='Source Code Pro', style='italic', variant='normal', weight=500, stretch='normal', size='scalable')) = 10.145
2026-07-21 14:55:57 runnervm3jd5f matplotlib.font_manager[2874] DEBUG findfont: score(FontEntry(fname='/home/runner/micromamba/envs/trajan/fonts/SourceCodePro-MediumIt.ttf', index=0, name='Source Code Pro Medium', style='italic', variant='normal', weight=400, stretch='normal', size='scalable')) = 10.05
2026-07-21 14:55:57 runnervm3jd5f matplotlib.font_manager[2874] DEBUG findfont: score(FontEntry(fname='/home/runner/micromamba/envs/trajan/fonts/SourceCodePro-Regular.ttf', index=0, name='Source Code Pro', style='normal', variant='normal', weight=400, stretch='normal', size='scalable')) = 11.05
2026-07-21 14:55:57 runnervm3jd5f matplotlib.font_manager[2874] DEBUG findfont: score(FontEntry(fname='/home/runner/micromamba/envs/trajan/fonts/SourceCodePro-SemiboldIt.ttf', index=0, name='Source Code Pro', style='italic', variant='normal', weight=600, stretch='normal', size='scalable')) = 10.24
2026-07-21 14:55:57 runnervm3jd5f matplotlib.font_manager[2874] DEBUG findfont: score(FontEntry(fname='/home/runner/micromamba/envs/trajan/fonts/SourceCodePro-SemiboldIt.ttf', index=0, name='Source Code Pro Semibold', style='italic', variant='normal', weight=400, stretch='normal', size='scalable')) = 10.05
2026-07-21 14:55:57 runnervm3jd5f matplotlib.font_manager[2874] DEBUG findfont: score(FontEntry(fname='/usr/share/fonts/truetype/dejavu/DejaVuSerif.ttf', index=0, name='DejaVu Serif', style='normal', variant='normal', weight=400, stretch='normal', size='scalable')) = 11.05
2026-07-21 14:55:57 runnervm3jd5f matplotlib.font_manager[2874] DEBUG findfont: score(FontEntry(fname='/usr/share/fonts/truetype/dejavu/DejaVuSerif-Bold.ttf', index=0, name='DejaVu Serif', style='normal', variant='normal', weight=700, stretch='normal', size='scalable')) = 11.335
2026-07-21 14:55:57 runnervm3jd5f matplotlib.font_manager[2874] DEBUG findfont: score(FontEntry(fname='/usr/share/fonts/truetype/liberation/LiberationSerif-Italic.ttf', index=0, name='Liberation Serif', style='italic', variant='normal', weight=400, stretch='normal', size='scalable')) = 10.05
2026-07-21 14:55:57 runnervm3jd5f matplotlib.font_manager[2874] DEBUG findfont: score(FontEntry(fname='/usr/share/fonts/truetype/dejavu/DejaVuSansMono-BoldOblique.ttf', index=0, name='DejaVu Sans Mono', style='oblique', variant='normal', weight=700, stretch='normal', size='scalable')) = 10.434999999999999
2026-07-21 14:55:57 runnervm3jd5f matplotlib.font_manager[2874] DEBUG findfont: score(FontEntry(fname='/home/runner/micromamba/envs/trajan/fonts/SourceCodePro-Light.ttf', index=0, name='Source Code Pro', style='normal', variant='normal', weight=300, stretch='normal', size='scalable')) = 11.145
2026-07-21 14:55:57 runnervm3jd5f matplotlib.font_manager[2874] DEBUG findfont: score(FontEntry(fname='/home/runner/micromamba/envs/trajan/fonts/SourceCodePro-Light.ttf', index=0, name='Source Code Pro Light', style='normal', variant='normal', weight=400, stretch='normal', size='scalable')) = 11.05
2026-07-21 14:55:57 runnervm3jd5f matplotlib.font_manager[2874] DEBUG findfont: score(FontEntry(fname='/usr/share/fonts/truetype/liberation/LiberationMono-Italic.ttf', index=0, name='Liberation Mono', style='italic', variant='normal', weight=400, stretch='normal', size='scalable')) = 10.05
2026-07-21 14:55:57 runnervm3jd5f matplotlib.font_manager[2874] DEBUG findfont: Matching STIXGeneral:style=italic:variant=normal:weight=normal:stretch=normal:size=10.0 to STIXGeneral ('/home/runner/micromamba/envs/trajan/lib/python3.14/site-packages/matplotlib/mpl-data/fonts/ttf/STIXGeneralItalic.ttf') with score of 0.050000.
2026-07-21 14:55:57 runnervm3jd5f matplotlib.font_manager[2874] DEBUG findfont: Matching STIXGeneral:style=normal:variant=normal:weight=bold:stretch=normal:size=10.0.
2026-07-21 14:55:57 runnervm3jd5f matplotlib.font_manager[2874] DEBUG findfont: score(FontEntry(fname='/home/runner/micromamba/envs/trajan/lib/python3.14/site-packages/matplotlib/mpl-data/fonts/ttf/cmmi10.ttf', index=0, name='cmmi10', style='normal', variant='normal', weight=400, stretch='normal', size='scalable')) = 10.335
2026-07-21 14:55:57 runnervm3jd5f matplotlib.font_manager[2874] DEBUG findfont: score(FontEntry(fname='/home/runner/micromamba/envs/trajan/lib/python3.14/site-packages/matplotlib/mpl-data/fonts/ttf/DejaVuSerif-Bold.ttf', index=0, name='DejaVu Serif', style='normal', variant='normal', weight=700, stretch='normal', size='scalable')) = 10.05
2026-07-21 14:55:57 runnervm3jd5f matplotlib.font_manager[2874] DEBUG findfont: score(FontEntry(fname='/home/runner/micromamba/envs/trajan/lib/python3.14/site-packages/matplotlib/mpl-data/fonts/ttf/DejaVuSans-Oblique.ttf', index=0, name='DejaVu Sans', style='oblique', variant='normal', weight=400, stretch='normal', size='scalable')) = 11.335
2026-07-21 14:55:57 runnervm3jd5f matplotlib.font_manager[2874] DEBUG findfont: score(FontEntry(fname='/home/runner/micromamba/envs/trajan/lib/python3.14/site-packages/matplotlib/mpl-data/fonts/ttf/STIXSizThreeSymReg.ttf', index=0, name='STIXSizeThreeSym', style='normal', variant='normal', weight=400, stretch='normal', size='scalable')) = 10.335
2026-07-21 14:55:57 runnervm3jd5f matplotlib.font_manager[2874] DEBUG findfont: score(FontEntry(fname='/home/runner/micromamba/envs/trajan/lib/python3.14/site-packages/matplotlib/mpl-data/fonts/ttf/STIXNonUniBolIta.ttf', index=0, name='STIXNonUnicode', style='italic', variant='normal', weight=700, stretch='normal', size='scalable')) = 11.05
2026-07-21 14:55:57 runnervm3jd5f matplotlib.font_manager[2874] DEBUG findfont: score(FontEntry(fname='/home/runner/micromamba/envs/trajan/lib/python3.14/site-packages/matplotlib/mpl-data/fonts/ttf/DejaVuSerifDisplay.ttf', index=0, name='DejaVu Serif Display', style='normal', variant='normal', weight=400, stretch='normal', size='scalable')) = 10.335
2026-07-21 14:55:57 runnervm3jd5f matplotlib.font_manager[2874] DEBUG findfont: score(FontEntry(fname='/home/runner/micromamba/envs/trajan/lib/python3.14/site-packages/matplotlib/mpl-data/fonts/ttf/cmss10.ttf', index=0, name='cmss10', style='normal', variant='normal', weight=400, stretch='normal', size='scalable')) = 10.335
2026-07-21 14:55:57 runnervm3jd5f matplotlib.font_manager[2874] DEBUG findfont: score(FontEntry(fname='/home/runner/micromamba/envs/trajan/lib/python3.14/site-packages/matplotlib/mpl-data/fonts/ttf/STIXGeneralBolIta.ttf', index=0, name='STIXGeneral', style='italic', variant='normal', weight=700, stretch='normal', size='scalable')) = 1.05
2026-07-21 14:55:57 runnervm3jd5f matplotlib.font_manager[2874] DEBUG findfont: score(FontEntry(fname='/home/runner/micromamba/envs/trajan/lib/python3.14/site-packages/matplotlib/mpl-data/fonts/ttf/cmtt10.ttf', index=0, name='cmtt10', style='normal', variant='normal', weight=400, stretch='normal', size='scalable')) = 10.335
2026-07-21 14:55:57 runnervm3jd5f matplotlib.font_manager[2874] DEBUG findfont: score(FontEntry(fname='/home/runner/micromamba/envs/trajan/lib/python3.14/site-packages/matplotlib/mpl-data/fonts/ttf/cmsy10.ttf', index=0, name='cmsy10', style='normal', variant='normal', weight=400, stretch='normal', size='scalable')) = 10.335
2026-07-21 14:55:57 runnervm3jd5f matplotlib.font_manager[2874] DEBUG findfont: score(FontEntry(fname='/home/runner/micromamba/envs/trajan/lib/python3.14/site-packages/matplotlib/mpl-data/fonts/ttf/DejaVuSansMono-Oblique.ttf', index=0, name='DejaVu Sans Mono', style='oblique', variant='normal', weight=400, stretch='normal', size='scalable')) = 11.335
2026-07-21 14:55:57 runnervm3jd5f matplotlib.font_manager[2874] DEBUG findfont: score(FontEntry(fname='/home/runner/micromamba/envs/trajan/lib/python3.14/site-packages/matplotlib/mpl-data/fonts/ttf/STIXNonUniIta.ttf', index=0, name='STIXNonUnicode', style='italic', variant='normal', weight=400, stretch='normal', size='scalable')) = 11.335
2026-07-21 14:55:57 runnervm3jd5f matplotlib.font_manager[2874] DEBUG findfont: score(FontEntry(fname='/home/runner/micromamba/envs/trajan/lib/python3.14/site-packages/matplotlib/mpl-data/fonts/ttf/STIXGeneral.ttf', index=0, name='STIXGeneral', style='normal', variant='normal', weight=400, stretch='normal', size='scalable')) = 0.33499999999999996
2026-07-21 14:55:57 runnervm3jd5f matplotlib.font_manager[2874] DEBUG findfont: score(FontEntry(fname='/home/runner/micromamba/envs/trajan/lib/python3.14/site-packages/matplotlib/mpl-data/fonts/ttf/cmti10.ttf', index=0, name='cmti10', style='normal', variant='normal', weight=400, stretch='normal', size='scalable')) = 10.335
2026-07-21 14:55:57 runnervm3jd5f matplotlib.font_manager[2874] DEBUG findfont: score(FontEntry(fname='/home/runner/micromamba/envs/trajan/lib/python3.14/site-packages/matplotlib/mpl-data/fonts/ttf/DejaVuSansMono-BoldOblique.ttf', index=0, name='DejaVu Sans Mono', style='oblique', variant='normal', weight=700, stretch='normal', size='scalable')) = 11.05
2026-07-21 14:55:57 runnervm3jd5f matplotlib.font_manager[2874] DEBUG findfont: score(FontEntry(fname='/home/runner/micromamba/envs/trajan/lib/python3.14/site-packages/matplotlib/mpl-data/fonts/ttf/DejaVuSerif.ttf', index=0, name='DejaVu Serif', style='normal', variant='normal', weight=400, stretch='normal', size='scalable')) = 10.335
2026-07-21 14:55:57 runnervm3jd5f matplotlib.font_manager[2874] DEBUG findfont: score(FontEntry(fname='/home/runner/micromamba/envs/trajan/lib/python3.14/site-packages/matplotlib/mpl-data/fonts/ttf/LastResortHE-Regular.ttf', index=0, name='Last Resort High-Efficiency', style='normal', variant='normal', weight=400, stretch='normal', size='scalable')) = 10.335
2026-07-21 14:55:57 runnervm3jd5f matplotlib.font_manager[2874] DEBUG findfont: score(FontEntry(fname='/home/runner/micromamba/envs/trajan/lib/python3.14/site-packages/matplotlib/mpl-data/fonts/ttf/cmex10.ttf', index=0, name='cmex10', style='normal', variant='normal', weight=400, stretch='normal', size='scalable')) = 10.335
2026-07-21 14:55:57 runnervm3jd5f matplotlib.font_manager[2874] DEBUG findfont: score(FontEntry(fname='/home/runner/micromamba/envs/trajan/lib/python3.14/site-packages/matplotlib/mpl-data/fonts/ttf/STIXSizFiveSymReg.ttf', index=0, name='STIXSizeFiveSym', style='normal', variant='normal', weight=400, stretch='normal', size='scalable')) = 10.335
2026-07-21 14:55:57 runnervm3jd5f matplotlib.font_manager[2874] DEBUG findfont: score(FontEntry(fname='/home/runner/micromamba/envs/trajan/lib/python3.14/site-packages/matplotlib/mpl-data/fonts/ttf/STIXNonUniBol.ttf', index=0, name='STIXNonUnicode', style='normal', variant='normal', weight=700, stretch='normal', size='scalable')) = 10.05
2026-07-21 14:55:57 runnervm3jd5f matplotlib.font_manager[2874] DEBUG findfont: score(FontEntry(fname='/home/runner/micromamba/envs/trajan/lib/python3.14/site-packages/matplotlib/mpl-data/fonts/ttf/DejaVuSansDisplay.ttf', index=0, name='DejaVu Sans Display', style='normal', variant='normal', weight=400, stretch='normal', size='scalable')) = 10.335
2026-07-21 14:55:57 runnervm3jd5f matplotlib.font_manager[2874] DEBUG findfont: score(FontEntry(fname='/home/runner/micromamba/envs/trajan/lib/python3.14/site-packages/matplotlib/mpl-data/fonts/ttf/DejaVuSansMono.ttf', index=0, name='DejaVu Sans Mono', style='normal', variant='normal', weight=400, stretch='normal', size='scalable')) = 10.335
2026-07-21 14:55:57 runnervm3jd5f matplotlib.font_manager[2874] DEBUG findfont: score(FontEntry(fname='/home/runner/micromamba/envs/trajan/lib/python3.14/site-packages/matplotlib/mpl-data/fonts/ttf/cmb10.ttf', index=0, name='cmb10', style='normal', variant='normal', weight=400, stretch='normal', size='scalable')) = 10.335
2026-07-21 14:55:57 runnervm3jd5f matplotlib.font_manager[2874] DEBUG findfont: score(FontEntry(fname='/home/runner/micromamba/envs/trajan/lib/python3.14/site-packages/matplotlib/mpl-data/fonts/ttf/STIXSizTwoSymReg.ttf', index=0, name='STIXSizeTwoSym', style='normal', variant='normal', weight=400, stretch='normal', size='scalable')) = 10.335
2026-07-21 14:55:57 runnervm3jd5f matplotlib.font_manager[2874] DEBUG findfont: score(FontEntry(fname='/home/runner/micromamba/envs/trajan/lib/python3.14/site-packages/matplotlib/mpl-data/fonts/ttf/DejaVuSans.ttf', index=0, name='DejaVu Sans', style='normal', variant='normal', weight=400, stretch='normal', size='scalable')) = 10.335
2026-07-21 14:55:57 runnervm3jd5f matplotlib.font_manager[2874] DEBUG findfont: score(FontEntry(fname='/home/runner/micromamba/envs/trajan/lib/python3.14/site-packages/matplotlib/mpl-data/fonts/ttf/STIXNonUni.ttf', index=0, name='STIXNonUnicode', style='normal', variant='normal', weight=400, stretch='normal', size='scalable')) = 10.335
2026-07-21 14:55:57 runnervm3jd5f matplotlib.font_manager[2874] DEBUG findfont: score(FontEntry(fname='/home/runner/micromamba/envs/trajan/lib/python3.14/site-packages/matplotlib/mpl-data/fonts/ttf/STIXGeneralItalic.ttf', index=0, name='STIXGeneral', style='italic', variant='normal', weight=400, stretch='normal', size='scalable')) = 1.335
2026-07-21 14:55:57 runnervm3jd5f matplotlib.font_manager[2874] DEBUG findfont: score(FontEntry(fname='/home/runner/micromamba/envs/trajan/lib/python3.14/site-packages/matplotlib/mpl-data/fonts/ttf/STIXSizOneSymBol.ttf', index=0, name='STIXSizeOneSym', style='normal', variant='normal', weight=700, stretch='normal', size='scalable')) = 10.05
2026-07-21 14:55:57 runnervm3jd5f matplotlib.font_manager[2874] DEBUG findfont: score(FontEntry(fname='/home/runner/micromamba/envs/trajan/lib/python3.14/site-packages/matplotlib/mpl-data/fonts/ttf/DejaVuSansMono-Bold.ttf', index=0, name='DejaVu Sans Mono', style='normal', variant='normal', weight=700, stretch='normal', size='scalable')) = 10.05
2026-07-21 14:55:57 runnervm3jd5f matplotlib.font_manager[2874] DEBUG findfont: score(FontEntry(fname='/home/runner/micromamba/envs/trajan/lib/python3.14/site-packages/matplotlib/mpl-data/fonts/ttf/STIXSizTwoSymBol.ttf', index=0, name='STIXSizeTwoSym', style='normal', variant='normal', weight=700, stretch='normal', size='scalable')) = 10.05
2026-07-21 14:55:57 runnervm3jd5f matplotlib.font_manager[2874] DEBUG findfont: score(FontEntry(fname='/home/runner/micromamba/envs/trajan/lib/python3.14/site-packages/matplotlib/mpl-data/fonts/ttf/STIXSizThreeSymBol.ttf', index=0, name='STIXSizeThreeSym', style='normal', variant='normal', weight=700, stretch='normal', size='scalable')) = 10.05
2026-07-21 14:55:57 runnervm3jd5f matplotlib.font_manager[2874] DEBUG findfont: score(FontEntry(fname='/home/runner/micromamba/envs/trajan/lib/python3.14/site-packages/matplotlib/mpl-data/fonts/ttf/DejaVuSerif-BoldItalic.ttf', index=0, name='DejaVu Serif', style='italic', variant='normal', weight=700, stretch='normal', size='scalable')) = 11.05
2026-07-21 14:55:57 runnervm3jd5f matplotlib.font_manager[2874] DEBUG findfont: score(FontEntry(fname='/home/runner/micromamba/envs/trajan/lib/python3.14/site-packages/matplotlib/mpl-data/fonts/ttf/DejaVuSerif-Italic.ttf', index=0, name='DejaVu Serif', style='italic', variant='normal', weight=400, stretch='normal', size='scalable')) = 11.335
2026-07-21 14:55:57 runnervm3jd5f matplotlib.font_manager[2874] DEBUG findfont: score(FontEntry(fname='/home/runner/micromamba/envs/trajan/lib/python3.14/site-packages/matplotlib/mpl-data/fonts/ttf/DejaVuSans-Bold.ttf', index=0, name='DejaVu Sans', style='normal', variant='normal', weight=700, stretch='normal', size='scalable')) = 10.05
2026-07-21 14:55:57 runnervm3jd5f matplotlib.font_manager[2874] DEBUG findfont: score(FontEntry(fname='/home/runner/micromamba/envs/trajan/lib/python3.14/site-packages/matplotlib/mpl-data/fonts/ttf/STIXSizFourSymBol.ttf', index=0, name='STIXSizeFourSym', style='normal', variant='normal', weight=700, stretch='normal', size='scalable')) = 10.05
2026-07-21 14:55:57 runnervm3jd5f matplotlib.font_manager[2874] DEBUG findfont: score(FontEntry(fname='/home/runner/micromamba/envs/trajan/lib/python3.14/site-packages/matplotlib/mpl-data/fonts/ttf/STIXSizOneSymReg.ttf', index=0, name='STIXSizeOneSym', style='normal', variant='normal', weight=400, stretch='normal', size='scalable')) = 10.335
2026-07-21 14:55:57 runnervm3jd5f matplotlib.font_manager[2874] DEBUG findfont: score(FontEntry(fname='/home/runner/micromamba/envs/trajan/lib/python3.14/site-packages/matplotlib/mpl-data/fonts/ttf/cmr10.ttf', index=0, name='cmr10', style='normal', variant='normal', weight=400, stretch='normal', size='scalable')) = 10.335
2026-07-21 14:55:57 runnervm3jd5f matplotlib.font_manager[2874] DEBUG findfont: score(FontEntry(fname='/home/runner/micromamba/envs/trajan/lib/python3.14/site-packages/matplotlib/mpl-data/fonts/ttf/STIXGeneralBol.ttf', index=0, name='STIXGeneral', style='normal', variant='normal', weight=700, stretch='normal', size='scalable')) = 0.05
2026-07-21 14:55:57 runnervm3jd5f matplotlib.font_manager[2874] DEBUG findfont: score(FontEntry(fname='/home/runner/micromamba/envs/trajan/lib/python3.14/site-packages/matplotlib/mpl-data/fonts/ttf/DejaVuSans-BoldOblique.ttf', index=0, name='DejaVu Sans', style='oblique', variant='normal', weight=700, stretch='normal', size='scalable')) = 11.05
2026-07-21 14:55:57 runnervm3jd5f matplotlib.font_manager[2874] DEBUG findfont: score(FontEntry(fname='/home/runner/micromamba/envs/trajan/lib/python3.14/site-packages/matplotlib/mpl-data/fonts/ttf/STIXSizFourSymReg.ttf', index=0, name='STIXSizeFourSym', style='normal', variant='normal', weight=400, stretch='normal', size='scalable')) = 10.335
2026-07-21 14:55:57 runnervm3jd5f matplotlib.font_manager[2874] DEBUG findfont: score(FontEntry(fname='/usr/share/fonts/truetype/lato/Lato-Black.ttf', index=0, name='Lato', style='normal', variant='normal', weight=900, stretch='normal', size='scalable')) = 10.24
2026-07-21 14:55:57 runnervm3jd5f matplotlib.font_manager[2874] DEBUG findfont: score(FontEntry(fname='/usr/share/fonts/truetype/lato/Lato-Black.ttf', index=0, name='Lato Black', style='normal', variant='normal', weight=400, stretch='normal', size='scalable')) = 10.335
2026-07-21 14:55:57 runnervm3jd5f matplotlib.font_manager[2874] DEBUG findfont: score(FontEntry(fname='/usr/share/fonts/truetype/liberation/LiberationSerif-Regular.ttf', index=0, name='Liberation Serif', style='normal', variant='normal', weight=400, stretch='normal', size='scalable')) = 10.335
2026-07-21 14:55:57 runnervm3jd5f matplotlib.font_manager[2874] DEBUG findfont: score(FontEntry(fname='/usr/share/fonts/truetype/dejavu/DejaVuSerifCondensed.ttf', index=0, name='DejaVu Serif', style='normal', variant='normal', weight=400, stretch='condensed', size='scalable')) = 10.535
2026-07-21 14:55:57 runnervm3jd5f matplotlib.font_manager[2874] DEBUG findfont: score(FontEntry(fname='/usr/share/fonts/truetype/dejavu/DejaVuSerifCondensed.ttf', index=0, name='DejaVu Serif Condensed', style='normal', variant='normal', weight=380, stretch='condensed', size='scalable')) = 10.553999999999998
2026-07-21 14:55:57 runnervm3jd5f matplotlib.font_manager[2874] DEBUG findfont: score(FontEntry(fname='/home/runner/micromamba/envs/trajan/fonts/UbuntuMono-BI.ttf', index=0, name='Ubuntu Mono', style='italic', variant='normal', weight=700, stretch='normal', size='scalable')) = 11.05
2026-07-21 14:55:57 runnervm3jd5f matplotlib.font_manager[2874] DEBUG findfont: score(FontEntry(fname='/usr/share/fonts/truetype/dejavu/DejaVuSans.ttf', index=0, name='DejaVu Sans', style='normal', variant='normal', weight=400, stretch='normal', size='scalable')) = 10.335
2026-07-21 14:55:57 runnervm3jd5f matplotlib.font_manager[2874] DEBUG findfont: score(FontEntry(fname='/usr/share/fonts/truetype/lato/Lato-Italic.ttf', index=0, name='Lato', style='italic', variant='normal', weight=400, stretch='normal', size='scalable')) = 11.335
2026-07-21 14:55:57 runnervm3jd5f matplotlib.font_manager[2874] DEBUG findfont: score(FontEntry(fname='/usr/share/fonts/truetype/liberation/LiberationSans-Italic.ttf', index=0, name='Liberation Sans', style='italic', variant='normal', weight=400, stretch='normal', size='scalable')) = 11.335
2026-07-21 14:55:57 runnervm3jd5f matplotlib.font_manager[2874] DEBUG findfont: score(FontEntry(fname='/home/runner/micromamba/envs/trajan/fonts/Ubuntu-B.ttf', index=0, name='Ubuntu', style='normal', variant='normal', weight=700, stretch='normal', size='scalable')) = 10.05
2026-07-21 14:55:57 runnervm3jd5f matplotlib.font_manager[2874] DEBUG findfont: score(FontEntry(fname='/home/runner/micromamba/envs/trajan/fonts/SourceCodePro-Semibold.ttf', index=0, name='Source Code Pro', style='normal', variant='normal', weight=600, stretch='normal', size='scalable')) = 10.145
2026-07-21 14:55:57 runnervm3jd5f matplotlib.font_manager[2874] DEBUG findfont: score(FontEntry(fname='/home/runner/micromamba/envs/trajan/fonts/SourceCodePro-Semibold.ttf', index=0, name='Source Code Pro Semibold', style='normal', variant='normal', weight=400, stretch='normal', size='scalable')) = 10.335
2026-07-21 14:55:57 runnervm3jd5f matplotlib.font_manager[2874] DEBUG findfont: score(FontEntry(fname='/home/runner/micromamba/envs/trajan/fonts/SourceCodePro-Bold.ttf', index=0, name='Source Code Pro', style='normal', variant='normal', weight=700, stretch='normal', size='scalable')) = 10.05
2026-07-21 14:55:57 runnervm3jd5f matplotlib.font_manager[2874] DEBUG findfont: score(FontEntry(fname='/home/runner/micromamba/envs/trajan/fonts/Ubuntu-MI.ttf', index=0, name='Ubuntu', style='italic', variant='normal', weight=500, stretch='normal', size='scalable')) = 11.24
2026-07-21 14:55:57 runnervm3jd5f matplotlib.font_manager[2874] DEBUG findfont: score(FontEntry(fname='/home/runner/micromamba/envs/trajan/fonts/Ubuntu-MI.ttf', index=0, name='Ubuntu Light', style='italic', variant='normal', weight=700, stretch='normal', size='scalable')) = 11.05
2026-07-21 14:55:57 runnervm3jd5f matplotlib.font_manager[2874] DEBUG findfont: score(FontEntry(fname='/usr/share/fonts/truetype/lato/Lato-Regular.ttf', index=0, name='Lato', style='normal', variant='normal', weight=400, stretch='normal', size='scalable')) = 10.335
2026-07-21 14:55:57 runnervm3jd5f matplotlib.font_manager[2874] DEBUG findfont: score(FontEntry(fname='/usr/share/fonts/truetype/lato/Lato-ThinItalic.ttf', index=0, name='Lato', style='italic', variant='normal', weight=275, stretch='normal', size='scalable')) = 11.45375
2026-07-21 14:55:57 runnervm3jd5f matplotlib.font_manager[2874] DEBUG findfont: score(FontEntry(fname='/usr/share/fonts/truetype/lato/Lato-ThinItalic.ttf', index=0, name='Lato Thin', style='italic', variant='normal', weight=400, stretch='normal', size='scalable')) = 11.335
2026-07-21 14:55:57 runnervm3jd5f matplotlib.font_manager[2874] DEBUG findfont: score(FontEntry(fname='/usr/share/fonts/truetype/lato/Lato-BlackItalic.ttf', index=0, name='Lato', style='italic', variant='normal', weight=900, stretch='normal', size='scalable')) = 11.24
2026-07-21 14:55:57 runnervm3jd5f matplotlib.font_manager[2874] DEBUG findfont: score(FontEntry(fname='/usr/share/fonts/truetype/lato/Lato-BlackItalic.ttf', index=0, name='Lato Black', style='italic', variant='normal', weight=400, stretch='normal', size='scalable')) = 11.335
2026-07-21 14:55:57 runnervm3jd5f matplotlib.font_manager[2874] DEBUG findfont: score(FontEntry(fname='/usr/share/fonts/truetype/dejavu/DejaVuSerifCondensed-Italic.ttf', index=0, name='DejaVu Serif', style='italic', variant='normal', weight=400, stretch='condensed', size='scalable')) = 11.535
2026-07-21 14:55:57 runnervm3jd5f matplotlib.font_manager[2874] DEBUG findfont: score(FontEntry(fname='/usr/share/fonts/truetype/dejavu/DejaVuSerifCondensed-Italic.ttf', index=0, name='DejaVu Serif Condensed', style='italic', variant='normal', weight=400, stretch='condensed', size='scalable')) = 11.535
2026-07-21 14:55:57 runnervm3jd5f matplotlib.font_manager[2874] DEBUG findfont: score(FontEntry(fname='/usr/share/fonts/truetype/dejavu/DejaVuSans-Bold.ttf', index=0, name='DejaVu Sans', style='normal', variant='normal', weight=700, stretch='normal', size='scalable')) = 10.05
2026-07-21 14:55:57 runnervm3jd5f matplotlib.font_manager[2874] DEBUG findfont: score(FontEntry(fname='/home/runner/micromamba/envs/trajan/fonts/UbuntuMono-R.ttf', index=0, name='Ubuntu Mono', style='normal', variant='normal', weight=400, stretch='normal', size='scalable')) = 10.335
2026-07-21 14:55:57 runnervm3jd5f matplotlib.font_manager[2874] DEBUG findfont: score(FontEntry(fname='/usr/share/fonts/truetype/dejavu/DejaVuSerif-BoldItalic.ttf', index=0, name='DejaVu Serif', style='italic', variant='normal', weight=700, stretch='normal', size='scalable')) = 11.05
2026-07-21 14:55:57 runnervm3jd5f matplotlib.font_manager[2874] DEBUG findfont: score(FontEntry(fname='/usr/share/fonts/truetype/lato/Lato-Hairline.ttf', index=0, name='Lato', style='normal', variant='normal', weight=250, stretch='normal', size='scalable')) = 10.4775
2026-07-21 14:55:57 runnervm3jd5f matplotlib.font_manager[2874] DEBUG findfont: score(FontEntry(fname='/usr/share/fonts/truetype/lato/Lato-Hairline.ttf', index=0, name='Lato Hairline', style='normal', variant='normal', weight=400, stretch='normal', size='scalable')) = 10.335
2026-07-21 14:55:57 runnervm3jd5f matplotlib.font_manager[2874] DEBUG findfont: score(FontEntry(fname='/usr/share/fonts/truetype/lato/Lato-LightItalic.ttf', index=0, name='Lato', style='italic', variant='normal', weight=300, stretch='normal', size='scalable')) = 11.43
2026-07-21 14:55:57 runnervm3jd5f matplotlib.font_manager[2874] DEBUG findfont: score(FontEntry(fname='/usr/share/fonts/truetype/lato/Lato-LightItalic.ttf', index=0, name='Lato Light', style='italic', variant='normal', weight=400, stretch='normal', size='scalable')) = 11.335
2026-07-21 14:55:57 runnervm3jd5f matplotlib.font_manager[2874] DEBUG findfont: score(FontEntry(fname='/usr/share/fonts/truetype/dejavu/DejaVuSansCondensed-BoldOblique.ttf', index=0, name='DejaVu Sans', style='oblique', variant='normal', weight=700, stretch='condensed', size='scalable')) = 11.25
2026-07-21 14:55:57 runnervm3jd5f matplotlib.font_manager[2874] DEBUG findfont: score(FontEntry(fname='/usr/share/fonts/truetype/dejavu/DejaVuSansCondensed-BoldOblique.ttf', index=0, name='DejaVu Sans Condensed', style='oblique', variant='normal', weight=700, stretch='condensed', size='scalable')) = 11.25
2026-07-21 14:55:57 runnervm3jd5f matplotlib.font_manager[2874] DEBUG findfont: score(FontEntry(fname='/home/runner/micromamba/envs/trajan/fonts/SourceCodePro-It.ttf', index=0, name='Source Code Pro', style='italic', variant='normal', weight=400, stretch='normal', size='scalable')) = 11.335
2026-07-21 14:55:57 runnervm3jd5f matplotlib.font_manager[2874] DEBUG findfont: score(FontEntry(fname='/home/runner/micromamba/envs/trajan/fonts/SourceCodePro-ExtraLightIt.ttf', index=0, name='Source Code Pro', style='italic', variant='normal', weight=200, stretch='normal', size='scalable')) = 11.525
2026-07-21 14:55:57 runnervm3jd5f matplotlib.font_manager[2874] DEBUG findfont: score(FontEntry(fname='/home/runner/micromamba/envs/trajan/fonts/SourceCodePro-ExtraLightIt.ttf', index=0, name='Source Code Pro ExtraLight', style='italic', variant='normal', weight=400, stretch='normal', size='scalable')) = 11.335
2026-07-21 14:55:57 runnervm3jd5f matplotlib.font_manager[2874] DEBUG findfont: score(FontEntry(fname='/usr/share/fonts/truetype/lato/Lato-Medium.ttf', index=0, name='Lato', style='normal', variant='normal', weight=500, stretch='normal', size='scalable')) = 10.24
2026-07-21 14:55:57 runnervm3jd5f matplotlib.font_manager[2874] DEBUG findfont: score(FontEntry(fname='/usr/share/fonts/truetype/lato/Lato-Medium.ttf', index=0, name='Lato Medium', style='normal', variant='normal', weight=400, stretch='normal', size='scalable')) = 10.335
2026-07-21 14:55:57 runnervm3jd5f matplotlib.font_manager[2874] DEBUG findfont: score(FontEntry(fname='/usr/share/fonts/truetype/lato/Lato-BoldItalic.ttf', index=0, name='Lato', style='italic', variant='normal', weight=700, stretch='normal', size='scalable')) = 11.05
2026-07-21 14:55:57 runnervm3jd5f matplotlib.font_manager[2874] DEBUG findfont: score(FontEntry(fname='/home/runner/micromamba/envs/trajan/fonts/DejaVuSans.ttf', index=0, name='DejaVu Sans', style='normal', variant='normal', weight=400, stretch='normal', size='scalable')) = 10.335
2026-07-21 14:55:57 runnervm3jd5f matplotlib.font_manager[2874] DEBUG findfont: score(FontEntry(fname='/home/runner/micromamba/envs/trajan/fonts/UbuntuMono-B.ttf', index=0, name='Ubuntu Mono', style='normal', variant='normal', weight=700, stretch='normal', size='scalable')) = 10.05
2026-07-21 14:55:57 runnervm3jd5f matplotlib.font_manager[2874] DEBUG findfont: score(FontEntry(fname='/home/runner/micromamba/envs/trajan/fonts/SourceCodePro-LightIt.ttf', index=0, name='Source Code Pro', style='italic', variant='normal', weight=300, stretch='normal', size='scalable')) = 11.43
2026-07-21 14:55:57 runnervm3jd5f matplotlib.font_manager[2874] DEBUG findfont: score(FontEntry(fname='/home/runner/micromamba/envs/trajan/fonts/SourceCodePro-LightIt.ttf', index=0, name='Source Code Pro Light', style='italic', variant='normal', weight=400, stretch='normal', size='scalable')) = 11.335
2026-07-21 14:55:57 runnervm3jd5f matplotlib.font_manager[2874] DEBUG findfont: score(FontEntry(fname='/usr/share/fonts/truetype/liberation/LiberationSans-BoldItalic.ttf', index=0, name='Liberation Sans', style='italic', variant='normal', weight=700, stretch='normal', size='scalable')) = 11.05
2026-07-21 14:55:57 runnervm3jd5f matplotlib.font_manager[2874] DEBUG findfont: score(FontEntry(fname='/usr/share/fonts/truetype/liberation/LiberationSans-Regular.ttf', index=0, name='Liberation Sans', style='normal', variant='normal', weight=400, stretch='normal', size='scalable')) = 10.335
2026-07-21 14:55:57 runnervm3jd5f matplotlib.font_manager[2874] DEBUG findfont: score(FontEntry(fname='/usr/share/fonts/truetype/dejavu/DejaVuSansMono-Bold.ttf', index=0, name='DejaVu Sans Mono', style='normal', variant='normal', weight=700, stretch='normal', size='scalable')) = 10.05
2026-07-21 14:55:57 runnervm3jd5f matplotlib.font_manager[2874] DEBUG findfont: score(FontEntry(fname='/home/runner/micromamba/envs/trajan/fonts/SourceCodePro-BoldIt.ttf', index=0, name='Source Code Pro', style='italic', variant='normal', weight=700, stretch='normal', size='scalable')) = 11.05
2026-07-21 14:55:57 runnervm3jd5f matplotlib.font_manager[2874] DEBUG findfont: score(FontEntry(fname='/usr/share/fonts/truetype/lato/Lato-Bold.ttf', index=0, name='Lato', style='normal', variant='normal', weight=700, stretch='normal', size='scalable')) = 10.05
2026-07-21 14:55:57 runnervm3jd5f matplotlib.font_manager[2874] DEBUG findfont: score(FontEntry(fname='/usr/share/fonts/truetype/dejavu/DejaVuSansCondensed.ttf', index=0, name='DejaVu Sans', style='normal', variant='normal', weight=400, stretch='condensed', size='scalable')) = 10.535
2026-07-21 14:55:57 runnervm3jd5f matplotlib.font_manager[2874] DEBUG findfont: score(FontEntry(fname='/usr/share/fonts/truetype/dejavu/DejaVuSansCondensed.ttf', index=0, name='DejaVu Sans Condensed', style='normal', variant='normal', weight=380, stretch='condensed', size='scalable')) = 10.553999999999998
2026-07-21 14:55:57 runnervm3jd5f matplotlib.font_manager[2874] DEBUG findfont: score(FontEntry(fname='/usr/share/fonts/truetype/lato/Lato-MediumItalic.ttf', index=0, name='Lato', style='italic', variant='normal', weight=500, stretch='normal', size='scalable')) = 11.24
2026-07-21 14:55:57 runnervm3jd5f matplotlib.font_manager[2874] DEBUG findfont: score(FontEntry(fname='/usr/share/fonts/truetype/lato/Lato-MediumItalic.ttf', index=0, name='Lato Medium', style='italic', variant='normal', weight=400, stretch='normal', size='scalable')) = 11.335
2026-07-21 14:55:57 runnervm3jd5f matplotlib.font_manager[2874] DEBUG findfont: score(FontEntry(fname='/usr/share/fonts/truetype/liberation/LiberationSans-Bold.ttf', index=0, name='Liberation Sans', style='normal', variant='normal', weight=700, stretch='normal', size='scalable')) = 10.05
2026-07-21 14:55:57 runnervm3jd5f matplotlib.font_manager[2874] DEBUG findfont: score(FontEntry(fname='/usr/share/fonts/truetype/dejavu/DejaVuSerifCondensed-BoldItalic.ttf', index=0, name='DejaVu Serif', style='italic', variant='normal', weight=700, stretch='condensed', size='scalable')) = 11.25
2026-07-21 14:55:57 runnervm3jd5f matplotlib.font_manager[2874] DEBUG findfont: score(FontEntry(fname='/usr/share/fonts/truetype/dejavu/DejaVuSerifCondensed-BoldItalic.ttf', index=0, name='DejaVu Serif Condensed', style='italic', variant='normal', weight=700, stretch='condensed', size='scalable')) = 11.25
2026-07-21 14:55:57 runnervm3jd5f matplotlib.font_manager[2874] DEBUG findfont: score(FontEntry(fname='/home/runner/micromamba/envs/trajan/fonts/Ubuntu-R.ttf', index=0, name='Ubuntu', style='normal', variant='normal', weight=400, stretch='normal', size='scalable')) = 10.335
2026-07-21 14:55:57 runnervm3jd5f matplotlib.font_manager[2874] DEBUG findfont: score(FontEntry(fname='/usr/share/fonts/truetype/lato/Lato-Light.ttf', index=0, name='Lato', style='normal', variant='normal', weight=300, stretch='normal', size='scalable')) = 10.43
2026-07-21 14:55:57 runnervm3jd5f matplotlib.font_manager[2874] DEBUG findfont: score(FontEntry(fname='/usr/share/fonts/truetype/lato/Lato-Light.ttf', index=0, name='Lato Light', style='normal', variant='normal', weight=400, stretch='normal', size='scalable')) = 10.335
2026-07-21 14:55:57 runnervm3jd5f matplotlib.font_manager[2874] DEBUG findfont: score(FontEntry(fname='/usr/share/fonts/truetype/liberation/LiberationSerif-BoldItalic.ttf', index=0, name='Liberation Serif', style='italic', variant='normal', weight=700, stretch='normal', size='scalable')) = 11.05
2026-07-21 14:55:57 runnervm3jd5f matplotlib.font_manager[2874] DEBUG findfont: score(FontEntry(fname='/home/runner/micromamba/envs/trajan/fonts/Ubuntu-Th.ttf', index=0, name='Ubuntu', style='normal', variant='normal', weight=250, stretch='normal', size='scalable')) = 10.4775
2026-07-21 14:55:57 runnervm3jd5f matplotlib.font_manager[2874] DEBUG findfont: score(FontEntry(fname='/home/runner/micromamba/envs/trajan/fonts/Ubuntu-Th.ttf', index=0, name='Ubuntu Thin', style='normal', variant='normal', weight=400, stretch='normal', size='scalable')) = 10.335
2026-07-21 14:55:57 runnervm3jd5f matplotlib.font_manager[2874] DEBUG findfont: score(FontEntry(fname='/home/runner/micromamba/envs/trajan/fonts/SourceCodePro-ExtraLight.ttf', index=0, name='Source Code Pro', style='normal', variant='normal', weight=200, stretch='normal', size='scalable')) = 10.525
2026-07-21 14:55:57 runnervm3jd5f matplotlib.font_manager[2874] DEBUG findfont: score(FontEntry(fname='/home/runner/micromamba/envs/trajan/fonts/SourceCodePro-ExtraLight.ttf', index=0, name='Source Code Pro ExtraLight', style='normal', variant='normal', weight=400, stretch='normal', size='scalable')) = 10.335
2026-07-21 14:55:57 runnervm3jd5f matplotlib.font_manager[2874] DEBUG findfont: score(FontEntry(fname='/usr/share/fonts/truetype/lato/Lato-Thin.ttf', index=0, name='Lato', style='normal', variant='normal', weight=275, stretch='normal', size='scalable')) = 10.45375
2026-07-21 14:55:57 runnervm3jd5f matplotlib.font_manager[2874] DEBUG findfont: score(FontEntry(fname='/usr/share/fonts/truetype/lato/Lato-Thin.ttf', index=0, name='Lato Thin', style='normal', variant='normal', weight=400, stretch='normal', size='scalable')) = 10.335
2026-07-21 14:55:57 runnervm3jd5f matplotlib.font_manager[2874] DEBUG findfont: score(FontEntry(fname='/usr/share/fonts/truetype/liberation/LiberationSerif-Bold.ttf', index=0, name='Liberation Serif', style='normal', variant='normal', weight=700, stretch='normal', size='scalable')) = 10.05
2026-07-21 14:55:57 runnervm3jd5f matplotlib.font_manager[2874] DEBUG findfont: score(FontEntry(fname='/home/runner/micromamba/envs/trajan/fonts/Inconsolata-Regular.ttf', index=0, name='Inconsolata', style='normal', variant='normal', weight=400, stretch='normal', size='scalable')) = 10.335
2026-07-21 14:55:57 runnervm3jd5f matplotlib.font_manager[2874] DEBUG findfont: score(FontEntry(fname='/home/runner/micromamba/envs/trajan/fonts/Ubuntu-C.ttf', index=0, name='Ubuntu Condensed', style='normal', variant='normal', weight=400, stretch='condensed', size='scalable')) = 10.535
2026-07-21 14:55:57 runnervm3jd5f matplotlib.font_manager[2874] DEBUG findfont: score(FontEntry(fname='/usr/share/fonts/truetype/dejavu/DejaVuSansCondensed-Bold.ttf', index=0, name='DejaVu Sans', style='normal', variant='normal', weight=700, stretch='condensed', size='scalable')) = 10.25
2026-07-21 14:55:57 runnervm3jd5f matplotlib.font_manager[2874] DEBUG findfont: score(FontEntry(fname='/usr/share/fonts/truetype/dejavu/DejaVuSansCondensed-Bold.ttf', index=0, name='DejaVu Sans Condensed', style='normal', variant='normal', weight=700, stretch='condensed', size='scalable')) = 10.25
2026-07-21 14:55:57 runnervm3jd5f matplotlib.font_manager[2874] DEBUG findfont: score(FontEntry(fname='/usr/share/fonts/truetype/liberation/LiberationMono-Bold.ttf', index=0, name='Liberation Mono', style='normal', variant='normal', weight=700, stretch='normal', size='scalable')) = 10.05
2026-07-21 14:55:57 runnervm3jd5f matplotlib.font_manager[2874] DEBUG findfont: score(FontEntry(fname='/home/runner/micromamba/envs/trajan/fonts/SourceCodePro-Black.ttf', index=0, name='Source Code Pro', style='normal', variant='normal', weight=900, stretch='normal', size='scalable')) = 10.24
2026-07-21 14:55:57 runnervm3jd5f matplotlib.font_manager[2874] DEBUG findfont: score(FontEntry(fname='/home/runner/micromamba/envs/trajan/fonts/SourceCodePro-Black.ttf', index=0, name='Source Code Pro Black', style='normal', variant='normal', weight=400, stretch='normal', size='scalable')) = 10.335
2026-07-21 14:55:57 runnervm3jd5f matplotlib.font_manager[2874] DEBUG findfont: score(FontEntry(fname='/home/runner/micromamba/envs/trajan/fonts/SourceCodePro-BlackIt.ttf', index=0, name='Source Code Pro', style='italic', variant='normal', weight=900, stretch='normal', size='scalable')) = 11.24
2026-07-21 14:55:57 runnervm3jd5f matplotlib.font_manager[2874] DEBUG findfont: score(FontEntry(fname='/home/runner/micromamba/envs/trajan/fonts/SourceCodePro-BlackIt.ttf', index=0, name='Source Code Pro Black', style='italic', variant='normal', weight=400, stretch='normal', size='scalable')) = 11.335
2026-07-21 14:55:57 runnervm3jd5f matplotlib.font_manager[2874] DEBUG findfont: score(FontEntry(fname='/home/runner/micromamba/envs/trajan/fonts/Ubuntu-LI.ttf', index=0, name='Ubuntu', style='italic', variant='normal', weight=300, stretch='normal', size='scalable')) = 11.43
2026-07-21 14:55:57 runnervm3jd5f matplotlib.font_manager[2874] DEBUG findfont: score(FontEntry(fname='/home/runner/micromamba/envs/trajan/fonts/Ubuntu-LI.ttf', index=0, name='Ubuntu Light', style='italic', variant='normal', weight=400, stretch='normal', size='scalable')) = 11.335
2026-07-21 14:55:57 runnervm3jd5f matplotlib.font_manager[2874] DEBUG findfont: score(FontEntry(fname='/usr/share/fonts/truetype/liberation/LiberationMono-Regular.ttf', index=0, name='Liberation Mono', style='normal', variant='normal', weight=400, stretch='normal', size='scalable')) = 10.335
2026-07-21 14:55:57 runnervm3jd5f matplotlib.font_manager[2874] DEBUG findfont: score(FontEntry(fname='/home/runner/micromamba/envs/trajan/fonts/UbuntuMono-RI.ttf', index=0, name='Ubuntu Mono', style='italic', variant='normal', weight=400, stretch='normal', size='scalable')) = 11.335
2026-07-21 14:55:57 runnervm3jd5f matplotlib.font_manager[2874] DEBUG findfont: score(FontEntry(fname='/usr/share/fonts/truetype/lato/Lato-Heavy.ttf', index=0, name='Lato', style='normal', variant='normal', weight=800, stretch='normal', size='scalable')) = 10.145
2026-07-21 14:55:57 runnervm3jd5f matplotlib.font_manager[2874] DEBUG findfont: score(FontEntry(fname='/usr/share/fonts/truetype/lato/Lato-Heavy.ttf', index=0, name='Lato Heavy', style='normal', variant='normal', weight=400, stretch='normal', size='scalable')) = 10.335
2026-07-21 14:55:57 runnervm3jd5f matplotlib.font_manager[2874] DEBUG findfont: score(FontEntry(fname='/usr/share/fonts/truetype/lato/Lato-HairlineItalic.ttf', index=0, name='Lato', style='italic', variant='normal', weight=250, stretch='normal', size='scalable')) = 11.4775
2026-07-21 14:55:57 runnervm3jd5f matplotlib.font_manager[2874] DEBUG findfont: score(FontEntry(fname='/usr/share/fonts/truetype/lato/Lato-HairlineItalic.ttf', index=0, name='Lato Hairline', style='italic', variant='normal', weight=400, stretch='normal', size='scalable')) = 11.335
2026-07-21 14:55:57 runnervm3jd5f matplotlib.font_manager[2874] DEBUG findfont: score(FontEntry(fname='/usr/share/fonts/truetype/dejavu/DejaVuSerifCondensed-Bold.ttf', index=0, name='DejaVu Serif', style='normal', variant='normal', weight=700, stretch='condensed', size='scalable')) = 10.25
2026-07-21 14:55:57 runnervm3jd5f matplotlib.font_manager[2874] DEBUG findfont: score(FontEntry(fname='/usr/share/fonts/truetype/dejavu/DejaVuSerifCondensed-Bold.ttf', index=0, name='DejaVu Serif Condensed', style='normal', variant='normal', weight=700, stretch='condensed', size='scalable')) = 10.25
2026-07-21 14:55:57 runnervm3jd5f matplotlib.font_manager[2874] DEBUG findfont: score(FontEntry(fname='/usr/share/fonts/truetype/dejavu/DejaVuSansCondensed-Oblique.ttf', index=0, name='DejaVu Sans', style='oblique', variant='normal', weight=400, stretch='condensed', size='scalable')) = 11.535
2026-07-21 14:55:57 runnervm3jd5f matplotlib.font_manager[2874] DEBUG findfont: score(FontEntry(fname='/usr/share/fonts/truetype/dejavu/DejaVuSansCondensed-Oblique.ttf', index=0, name='DejaVu Sans Condensed', style='oblique', variant='normal', weight=400, stretch='condensed', size='scalable')) = 11.535
2026-07-21 14:55:57 runnervm3jd5f matplotlib.font_manager[2874] DEBUG findfont: score(FontEntry(fname='/usr/share/fonts/truetype/lato/Lato-SemiboldItalic.ttf', index=0, name='Lato', style='italic', variant='normal', weight=600, stretch='normal', size='scalable')) = 11.145
2026-07-21 14:55:57 runnervm3jd5f matplotlib.font_manager[2874] DEBUG findfont: score(FontEntry(fname='/usr/share/fonts/truetype/lato/Lato-SemiboldItalic.ttf', index=0, name='Lato Semibold', style='italic', variant='normal', weight=400, stretch='normal', size='scalable')) = 11.335
2026-07-21 14:55:57 runnervm3jd5f matplotlib.font_manager[2874] DEBUG findfont: score(FontEntry(fname='/usr/share/fonts/truetype/lato/Lato-Semibold.ttf', index=0, name='Lato', style='normal', variant='normal', weight=600, stretch='normal', size='scalable')) = 10.145
2026-07-21 14:55:57 runnervm3jd5f matplotlib.font_manager[2874] DEBUG findfont: score(FontEntry(fname='/usr/share/fonts/truetype/lato/Lato-Semibold.ttf', index=0, name='Lato Semibold', style='normal', variant='normal', weight=400, stretch='normal', size='scalable')) = 10.335
2026-07-21 14:55:57 runnervm3jd5f matplotlib.font_manager[2874] DEBUG findfont: score(FontEntry(fname='/home/runner/micromamba/envs/trajan/fonts/Inconsolata-Bold.ttf', index=0, name='Inconsolata', style='normal', variant='normal', weight=700, stretch='normal', size='scalable')) = 10.05
2026-07-21 14:55:57 runnervm3jd5f matplotlib.font_manager[2874] DEBUG findfont: score(FontEntry(fname='/usr/share/fonts/truetype/dejavu/DejaVuSans-ExtraLight.ttf', index=0, name='DejaVu Sans', style='normal', variant='normal', weight=200, stretch='normal', size='scalable')) = 10.525
2026-07-21 14:55:57 runnervm3jd5f matplotlib.font_manager[2874] DEBUG findfont: score(FontEntry(fname='/usr/share/fonts/truetype/dejavu/DejaVuSans-ExtraLight.ttf', index=0, name='DejaVu Sans Light', style='normal', variant='normal', weight=200, stretch='normal', size='scalable')) = 10.525
2026-07-21 14:55:57 runnervm3jd5f matplotlib.font_manager[2874] DEBUG findfont: score(FontEntry(fname='/home/runner/micromamba/envs/trajan/fonts/Ubuntu-BI.ttf', index=0, name='Ubuntu', style='italic', variant='normal', weight=700, stretch='normal', size='scalable')) = 11.05
2026-07-21 14:55:57 runnervm3jd5f matplotlib.font_manager[2874] DEBUG findfont: score(FontEntry(fname='/usr/share/fonts/truetype/dejavu/DejaVuSans-BoldOblique.ttf', index=0, name='DejaVu Sans', style='oblique', variant='normal', weight=700, stretch='normal', size='scalable')) = 11.05
2026-07-21 14:55:57 runnervm3jd5f matplotlib.font_manager[2874] DEBUG findfont: score(FontEntry(fname='/home/runner/micromamba/envs/trajan/fonts/Ubuntu-RI.ttf', index=0, name='Ubuntu', style='italic', variant='normal', weight=400, stretch='normal', size='scalable')) = 11.335
2026-07-21 14:55:57 runnervm3jd5f matplotlib.font_manager[2874] DEBUG findfont: score(FontEntry(fname='/usr/share/fonts/truetype/dejavu/DejaVuSerif-Italic.ttf', index=0, name='DejaVu Serif', style='italic', variant='normal', weight=400, stretch='normal', size='scalable')) = 11.335
2026-07-21 14:55:57 runnervm3jd5f matplotlib.font_manager[2874] DEBUG findfont: score(FontEntry(fname='/home/runner/micromamba/envs/trajan/fonts/SourceCodePro-Medium.ttf', index=0, name='Source Code Pro', style='normal', variant='normal', weight=500, stretch='normal', size='scalable')) = 10.24
2026-07-21 14:55:57 runnervm3jd5f matplotlib.font_manager[2874] DEBUG findfont: score(FontEntry(fname='/home/runner/micromamba/envs/trajan/fonts/SourceCodePro-Medium.ttf', index=0, name='Source Code Pro Medium', style='normal', variant='normal', weight=400, stretch='normal', size='scalable')) = 10.335
2026-07-21 14:55:57 runnervm3jd5f matplotlib.font_manager[2874] DEBUG findfont: score(FontEntry(fname='/usr/share/fonts/truetype/lato/Lato-HeavyItalic.ttf', index=0, name='Lato', style='italic', variant='normal', weight=800, stretch='normal', size='scalable')) = 11.145
2026-07-21 14:55:57 runnervm3jd5f matplotlib.font_manager[2874] DEBUG findfont: score(FontEntry(fname='/usr/share/fonts/truetype/lato/Lato-HeavyItalic.ttf', index=0, name='Lato Heavy', style='italic', variant='normal', weight=400, stretch='normal', size='scalable')) = 11.335
2026-07-21 14:55:57 runnervm3jd5f matplotlib.font_manager[2874] DEBUG findfont: score(FontEntry(fname='/usr/share/fonts/truetype/dejavu/DejaVuSans-Oblique.ttf', index=0, name='DejaVu Sans', style='oblique', variant='normal', weight=400, stretch='normal', size='scalable')) = 11.335
2026-07-21 14:55:57 runnervm3jd5f matplotlib.font_manager[2874] DEBUG findfont: score(FontEntry(fname='/home/runner/micromamba/envs/trajan/fonts/Ubuntu-M.ttf', index=0, name='Ubuntu', style='normal', variant='normal', weight=500, stretch='normal', size='scalable')) = 10.24
2026-07-21 14:55:57 runnervm3jd5f matplotlib.font_manager[2874] DEBUG findfont: score(FontEntry(fname='/home/runner/micromamba/envs/trajan/fonts/Ubuntu-M.ttf', index=0, name='Ubuntu Light', style='normal', variant='normal', weight=700, stretch='normal', size='scalable')) = 10.05
2026-07-21 14:55:57 runnervm3jd5f matplotlib.font_manager[2874] DEBUG findfont: score(FontEntry(fname='/usr/share/fonts/truetype/liberation/LiberationMono-BoldItalic.ttf', index=0, name='Liberation Mono', style='italic', variant='normal', weight=700, stretch='normal', size='scalable')) = 11.05
2026-07-21 14:55:57 runnervm3jd5f matplotlib.font_manager[2874] DEBUG findfont: score(FontEntry(fname='/usr/share/fonts/truetype/dejavu/DejaVuSansMono.ttf', index=0, name='DejaVu Sans Mono', style='normal', variant='normal', weight=400, stretch='normal', size='scalable')) = 10.335
2026-07-21 14:55:57 runnervm3jd5f matplotlib.font_manager[2874] DEBUG findfont: score(FontEntry(fname='/usr/share/fonts/truetype/dejavu/DejaVuMathTeXGyre.ttf', index=0, name='DejaVu Math TeX Gyre', style='normal', variant='normal', weight=400, stretch='normal', size='scalable')) = 10.335
2026-07-21 14:55:57 runnervm3jd5f matplotlib.font_manager[2874] DEBUG findfont: score(FontEntry(fname='/usr/share/fonts/truetype/dejavu/DejaVuSansMono-Oblique.ttf', index=0, name='DejaVu Sans Mono', style='oblique', variant='normal', weight=400, stretch='normal', size='scalable')) = 11.335
2026-07-21 14:55:57 runnervm3jd5f matplotlib.font_manager[2874] DEBUG findfont: score(FontEntry(fname='/home/runner/micromamba/envs/trajan/fonts/Ubuntu-L.ttf', index=0, name='Ubuntu', style='normal', variant='normal', weight=300, stretch='normal', size='scalable')) = 10.43
2026-07-21 14:55:57 runnervm3jd5f matplotlib.font_manager[2874] DEBUG findfont: score(FontEntry(fname='/home/runner/micromamba/envs/trajan/fonts/Ubuntu-L.ttf', index=0, name='Ubuntu Light', style='normal', variant='normal', weight=400, stretch='normal', size='scalable')) = 10.335
2026-07-21 14:55:57 runnervm3jd5f matplotlib.font_manager[2874] DEBUG findfont: score(FontEntry(fname='/home/runner/micromamba/envs/trajan/fonts/SourceCodePro-MediumIt.ttf', index=0, name='Source Code Pro', style='italic', variant='normal', weight=500, stretch='normal', size='scalable')) = 11.24
2026-07-21 14:55:57 runnervm3jd5f matplotlib.font_manager[2874] DEBUG findfont: score(FontEntry(fname='/home/runner/micromamba/envs/trajan/fonts/SourceCodePro-MediumIt.ttf', index=0, name='Source Code Pro Medium', style='italic', variant='normal', weight=400, stretch='normal', size='scalable')) = 11.335
2026-07-21 14:55:57 runnervm3jd5f matplotlib.font_manager[2874] DEBUG findfont: score(FontEntry(fname='/home/runner/micromamba/envs/trajan/fonts/SourceCodePro-Regular.ttf', index=0, name='Source Code Pro', style='normal', variant='normal', weight=400, stretch='normal', size='scalable')) = 10.335
2026-07-21 14:55:57 runnervm3jd5f matplotlib.font_manager[2874] DEBUG findfont: score(FontEntry(fname='/home/runner/micromamba/envs/trajan/fonts/SourceCodePro-SemiboldIt.ttf', index=0, name='Source Code Pro', style='italic', variant='normal', weight=600, stretch='normal', size='scalable')) = 11.145
2026-07-21 14:55:57 runnervm3jd5f matplotlib.font_manager[2874] DEBUG findfont: score(FontEntry(fname='/home/runner/micromamba/envs/trajan/fonts/SourceCodePro-SemiboldIt.ttf', index=0, name='Source Code Pro Semibold', style='italic', variant='normal', weight=400, stretch='normal', size='scalable')) = 11.335
2026-07-21 14:55:57 runnervm3jd5f matplotlib.font_manager[2874] DEBUG findfont: score(FontEntry(fname='/usr/share/fonts/truetype/dejavu/DejaVuSerif.ttf', index=0, name='DejaVu Serif', style='normal', variant='normal', weight=400, stretch='normal', size='scalable')) = 10.335
2026-07-21 14:55:57 runnervm3jd5f matplotlib.font_manager[2874] DEBUG findfont: score(FontEntry(fname='/usr/share/fonts/truetype/dejavu/DejaVuSerif-Bold.ttf', index=0, name='DejaVu Serif', style='normal', variant='normal', weight=700, stretch='normal', size='scalable')) = 10.05
2026-07-21 14:55:57 runnervm3jd5f matplotlib.font_manager[2874] DEBUG findfont: score(FontEntry(fname='/usr/share/fonts/truetype/liberation/LiberationSerif-Italic.ttf', index=0, name='Liberation Serif', style='italic', variant='normal', weight=400, stretch='normal', size='scalable')) = 11.335
2026-07-21 14:55:57 runnervm3jd5f matplotlib.font_manager[2874] DEBUG findfont: score(FontEntry(fname='/usr/share/fonts/truetype/dejavu/DejaVuSansMono-BoldOblique.ttf', index=0, name='DejaVu Sans Mono', style='oblique', variant='normal', weight=700, stretch='normal', size='scalable')) = 11.05
2026-07-21 14:55:57 runnervm3jd5f matplotlib.font_manager[2874] DEBUG findfont: score(FontEntry(fname='/home/runner/micromamba/envs/trajan/fonts/SourceCodePro-Light.ttf', index=0, name='Source Code Pro', style='normal', variant='normal', weight=300, stretch='normal', size='scalable')) = 10.43
2026-07-21 14:55:57 runnervm3jd5f matplotlib.font_manager[2874] DEBUG findfont: score(FontEntry(fname='/home/runner/micromamba/envs/trajan/fonts/SourceCodePro-Light.ttf', index=0, name='Source Code Pro Light', style='normal', variant='normal', weight=400, stretch='normal', size='scalable')) = 10.335
2026-07-21 14:55:57 runnervm3jd5f matplotlib.font_manager[2874] DEBUG findfont: score(FontEntry(fname='/usr/share/fonts/truetype/liberation/LiberationMono-Italic.ttf', index=0, name='Liberation Mono', style='italic', variant='normal', weight=400, stretch='normal', size='scalable')) = 11.335
2026-07-21 14:55:57 runnervm3jd5f matplotlib.font_manager[2874] DEBUG findfont: Matching STIXGeneral:style=normal:variant=normal:weight=bold:stretch=normal:size=10.0 to STIXGeneral ('/home/runner/micromamba/envs/trajan/lib/python3.14/site-packages/matplotlib/mpl-data/fonts/ttf/STIXGeneralBol.ttf') with score of 0.050000.
2026-07-21 14:55:57 runnervm3jd5f matplotlib.font_manager[2874] DEBUG findfont: Matching STIXGeneral:style=italic:variant=normal:weight=bold:stretch=normal:size=10.0.
2026-07-21 14:55:57 runnervm3jd5f matplotlib.font_manager[2874] DEBUG findfont: score(FontEntry(fname='/home/runner/micromamba/envs/trajan/lib/python3.14/site-packages/matplotlib/mpl-data/fonts/ttf/cmmi10.ttf', index=0, name='cmmi10', style='normal', variant='normal', weight=400, stretch='normal', size='scalable')) = 11.335
2026-07-21 14:55:57 runnervm3jd5f matplotlib.font_manager[2874] DEBUG findfont: score(FontEntry(fname='/home/runner/micromamba/envs/trajan/lib/python3.14/site-packages/matplotlib/mpl-data/fonts/ttf/DejaVuSerif-Bold.ttf', index=0, name='DejaVu Serif', style='normal', variant='normal', weight=700, stretch='normal', size='scalable')) = 11.05
2026-07-21 14:55:57 runnervm3jd5f matplotlib.font_manager[2874] DEBUG findfont: score(FontEntry(fname='/home/runner/micromamba/envs/trajan/lib/python3.14/site-packages/matplotlib/mpl-data/fonts/ttf/DejaVuSans-Oblique.ttf', index=0, name='DejaVu Sans', style='oblique', variant='normal', weight=400, stretch='normal', size='scalable')) = 10.434999999999999
2026-07-21 14:55:57 runnervm3jd5f matplotlib.font_manager[2874] DEBUG findfont: score(FontEntry(fname='/home/runner/micromamba/envs/trajan/lib/python3.14/site-packages/matplotlib/mpl-data/fonts/ttf/STIXSizThreeSymReg.ttf', index=0, name='STIXSizeThreeSym', style='normal', variant='normal', weight=400, stretch='normal', size='scalable')) = 11.335
2026-07-21 14:55:57 runnervm3jd5f matplotlib.font_manager[2874] DEBUG findfont: score(FontEntry(fname='/home/runner/micromamba/envs/trajan/lib/python3.14/site-packages/matplotlib/mpl-data/fonts/ttf/STIXNonUniBolIta.ttf', index=0, name='STIXNonUnicode', style='italic', variant='normal', weight=700, stretch='normal', size='scalable')) = 10.05
2026-07-21 14:55:57 runnervm3jd5f matplotlib.font_manager[2874] DEBUG findfont: score(FontEntry(fname='/home/runner/micromamba/envs/trajan/lib/python3.14/site-packages/matplotlib/mpl-data/fonts/ttf/DejaVuSerifDisplay.ttf', index=0, name='DejaVu Serif Display', style='normal', variant='normal', weight=400, stretch='normal', size='scalable')) = 11.335
2026-07-21 14:55:57 runnervm3jd5f matplotlib.font_manager[2874] DEBUG findfont: score(FontEntry(fname='/home/runner/micromamba/envs/trajan/lib/python3.14/site-packages/matplotlib/mpl-data/fonts/ttf/cmss10.ttf', index=0, name='cmss10', style='normal', variant='normal', weight=400, stretch='normal', size='scalable')) = 11.335
2026-07-21 14:55:57 runnervm3jd5f matplotlib.font_manager[2874] DEBUG findfont: score(FontEntry(fname='/home/runner/micromamba/envs/trajan/lib/python3.14/site-packages/matplotlib/mpl-data/fonts/ttf/STIXGeneralBolIta.ttf', index=0, name='STIXGeneral', style='italic', variant='normal', weight=700, stretch='normal', size='scalable')) = 0.05
2026-07-21 14:55:57 runnervm3jd5f matplotlib.font_manager[2874] DEBUG findfont: score(FontEntry(fname='/home/runner/micromamba/envs/trajan/lib/python3.14/site-packages/matplotlib/mpl-data/fonts/ttf/cmtt10.ttf', index=0, name='cmtt10', style='normal', variant='normal', weight=400, stretch='normal', size='scalable')) = 11.335
2026-07-21 14:55:57 runnervm3jd5f matplotlib.font_manager[2874] DEBUG findfont: score(FontEntry(fname='/home/runner/micromamba/envs/trajan/lib/python3.14/site-packages/matplotlib/mpl-data/fonts/ttf/cmsy10.ttf', index=0, name='cmsy10', style='normal', variant='normal', weight=400, stretch='normal', size='scalable')) = 11.335
2026-07-21 14:55:57 runnervm3jd5f matplotlib.font_manager[2874] DEBUG findfont: score(FontEntry(fname='/home/runner/micromamba/envs/trajan/lib/python3.14/site-packages/matplotlib/mpl-data/fonts/ttf/DejaVuSansMono-Oblique.ttf', index=0, name='DejaVu Sans Mono', style='oblique', variant='normal', weight=400, stretch='normal', size='scalable')) = 10.434999999999999
2026-07-21 14:55:57 runnervm3jd5f matplotlib.font_manager[2874] DEBUG findfont: score(FontEntry(fname='/home/runner/micromamba/envs/trajan/lib/python3.14/site-packages/matplotlib/mpl-data/fonts/ttf/STIXNonUniIta.ttf', index=0, name='STIXNonUnicode', style='italic', variant='normal', weight=400, stretch='normal', size='scalable')) = 10.335
2026-07-21 14:55:57 runnervm3jd5f matplotlib.font_manager[2874] DEBUG findfont: score(FontEntry(fname='/home/runner/micromamba/envs/trajan/lib/python3.14/site-packages/matplotlib/mpl-data/fonts/ttf/STIXGeneral.ttf', index=0, name='STIXGeneral', style='normal', variant='normal', weight=400, stretch='normal', size='scalable')) = 1.335
2026-07-21 14:55:57 runnervm3jd5f matplotlib.font_manager[2874] DEBUG findfont: score(FontEntry(fname='/home/runner/micromamba/envs/trajan/lib/python3.14/site-packages/matplotlib/mpl-data/fonts/ttf/cmti10.ttf', index=0, name='cmti10', style='normal', variant='normal', weight=400, stretch='normal', size='scalable')) = 11.335
2026-07-21 14:55:57 runnervm3jd5f matplotlib.font_manager[2874] DEBUG findfont: score(FontEntry(fname='/home/runner/micromamba/envs/trajan/lib/python3.14/site-packages/matplotlib/mpl-data/fonts/ttf/DejaVuSansMono-BoldOblique.ttf', index=0, name='DejaVu Sans Mono', style='oblique', variant='normal', weight=700, stretch='normal', size='scalable')) = 10.15
2026-07-21 14:55:57 runnervm3jd5f matplotlib.font_manager[2874] DEBUG findfont: score(FontEntry(fname='/home/runner/micromamba/envs/trajan/lib/python3.14/site-packages/matplotlib/mpl-data/fonts/ttf/DejaVuSerif.ttf', index=0, name='DejaVu Serif', style='normal', variant='normal', weight=400, stretch='normal', size='scalable')) = 11.335
2026-07-21 14:55:57 runnervm3jd5f matplotlib.font_manager[2874] DEBUG findfont: score(FontEntry(fname='/home/runner/micromamba/envs/trajan/lib/python3.14/site-packages/matplotlib/mpl-data/fonts/ttf/LastResortHE-Regular.ttf', index=0, name='Last Resort High-Efficiency', style='normal', variant='normal', weight=400, stretch='normal', size='scalable')) = 11.335
2026-07-21 14:55:57 runnervm3jd5f matplotlib.font_manager[2874] DEBUG findfont: score(FontEntry(fname='/home/runner/micromamba/envs/trajan/lib/python3.14/site-packages/matplotlib/mpl-data/fonts/ttf/cmex10.ttf', index=0, name='cmex10', style='normal', variant='normal', weight=400, stretch='normal', size='scalable')) = 11.335
2026-07-21 14:55:57 runnervm3jd5f matplotlib.font_manager[2874] DEBUG findfont: score(FontEntry(fname='/home/runner/micromamba/envs/trajan/lib/python3.14/site-packages/matplotlib/mpl-data/fonts/ttf/STIXSizFiveSymReg.ttf', index=0, name='STIXSizeFiveSym', style='normal', variant='normal', weight=400, stretch='normal', size='scalable')) = 11.335
2026-07-21 14:55:57 runnervm3jd5f matplotlib.font_manager[2874] DEBUG findfont: score(FontEntry(fname='/home/runner/micromamba/envs/trajan/lib/python3.14/site-packages/matplotlib/mpl-data/fonts/ttf/STIXNonUniBol.ttf', index=0, name='STIXNonUnicode', style='normal', variant='normal', weight=700, stretch='normal', size='scalable')) = 11.05
2026-07-21 14:55:57 runnervm3jd5f matplotlib.font_manager[2874] DEBUG findfont: score(FontEntry(fname='/home/runner/micromamba/envs/trajan/lib/python3.14/site-packages/matplotlib/mpl-data/fonts/ttf/DejaVuSansDisplay.ttf', index=0, name='DejaVu Sans Display', style='normal', variant='normal', weight=400, stretch='normal', size='scalable')) = 11.335
2026-07-21 14:55:57 runnervm3jd5f matplotlib.font_manager[2874] DEBUG findfont: score(FontEntry(fname='/home/runner/micromamba/envs/trajan/lib/python3.14/site-packages/matplotlib/mpl-data/fonts/ttf/DejaVuSansMono.ttf', index=0, name='DejaVu Sans Mono', style='normal', variant='normal', weight=400, stretch='normal', size='scalable')) = 11.335
2026-07-21 14:55:57 runnervm3jd5f matplotlib.font_manager[2874] DEBUG findfont: score(FontEntry(fname='/home/runner/micromamba/envs/trajan/lib/python3.14/site-packages/matplotlib/mpl-data/fonts/ttf/cmb10.ttf', index=0, name='cmb10', style='normal', variant='normal', weight=400, stretch='normal', size='scalable')) = 11.335
2026-07-21 14:55:57 runnervm3jd5f matplotlib.font_manager[2874] DEBUG findfont: score(FontEntry(fname='/home/runner/micromamba/envs/trajan/lib/python3.14/site-packages/matplotlib/mpl-data/fonts/ttf/STIXSizTwoSymReg.ttf', index=0, name='STIXSizeTwoSym', style='normal', variant='normal', weight=400, stretch='normal', size='scalable')) = 11.335
2026-07-21 14:55:57 runnervm3jd5f matplotlib.font_manager[2874] DEBUG findfont: score(FontEntry(fname='/home/runner/micromamba/envs/trajan/lib/python3.14/site-packages/matplotlib/mpl-data/fonts/ttf/DejaVuSans.ttf', index=0, name='DejaVu Sans', style='normal', variant='normal', weight=400, stretch='normal', size='scalable')) = 11.335
2026-07-21 14:55:57 runnervm3jd5f matplotlib.font_manager[2874] DEBUG findfont: score(FontEntry(fname='/home/runner/micromamba/envs/trajan/lib/python3.14/site-packages/matplotlib/mpl-data/fonts/ttf/STIXNonUni.ttf', index=0, name='STIXNonUnicode', style='normal', variant='normal', weight=400, stretch='normal', size='scalable')) = 11.335
2026-07-21 14:55:57 runnervm3jd5f matplotlib.font_manager[2874] DEBUG findfont: score(FontEntry(fname='/home/runner/micromamba/envs/trajan/lib/python3.14/site-packages/matplotlib/mpl-data/fonts/ttf/STIXGeneralItalic.ttf', index=0, name='STIXGeneral', style='italic', variant='normal', weight=400, stretch='normal', size='scalable')) = 0.33499999999999996
2026-07-21 14:55:57 runnervm3jd5f matplotlib.font_manager[2874] DEBUG findfont: score(FontEntry(fname='/home/runner/micromamba/envs/trajan/lib/python3.14/site-packages/matplotlib/mpl-data/fonts/ttf/STIXSizOneSymBol.ttf', index=0, name='STIXSizeOneSym', style='normal', variant='normal', weight=700, stretch='normal', size='scalable')) = 11.05
2026-07-21 14:55:57 runnervm3jd5f matplotlib.font_manager[2874] DEBUG findfont: score(FontEntry(fname='/home/runner/micromamba/envs/trajan/lib/python3.14/site-packages/matplotlib/mpl-data/fonts/ttf/DejaVuSansMono-Bold.ttf', index=0, name='DejaVu Sans Mono', style='normal', variant='normal', weight=700, stretch='normal', size='scalable')) = 11.05
2026-07-21 14:55:57 runnervm3jd5f matplotlib.font_manager[2874] DEBUG findfont: score(FontEntry(fname='/home/runner/micromamba/envs/trajan/lib/python3.14/site-packages/matplotlib/mpl-data/fonts/ttf/STIXSizTwoSymBol.ttf', index=0, name='STIXSizeTwoSym', style='normal', variant='normal', weight=700, stretch='normal', size='scalable')) = 11.05
2026-07-21 14:55:57 runnervm3jd5f matplotlib.font_manager[2874] DEBUG findfont: score(FontEntry(fname='/home/runner/micromamba/envs/trajan/lib/python3.14/site-packages/matplotlib/mpl-data/fonts/ttf/STIXSizThreeSymBol.ttf', index=0, name='STIXSizeThreeSym', style='normal', variant='normal', weight=700, stretch='normal', size='scalable')) = 11.05
2026-07-21 14:55:57 runnervm3jd5f matplotlib.font_manager[2874] DEBUG findfont: score(FontEntry(fname='/home/runner/micromamba/envs/trajan/lib/python3.14/site-packages/matplotlib/mpl-data/fonts/ttf/DejaVuSerif-BoldItalic.ttf', index=0, name='DejaVu Serif', style='italic', variant='normal', weight=700, stretch='normal', size='scalable')) = 10.05
2026-07-21 14:55:57 runnervm3jd5f matplotlib.font_manager[2874] DEBUG findfont: score(FontEntry(fname='/home/runner/micromamba/envs/trajan/lib/python3.14/site-packages/matplotlib/mpl-data/fonts/ttf/DejaVuSerif-Italic.ttf', index=0, name='DejaVu Serif', style='italic', variant='normal', weight=400, stretch='normal', size='scalable')) = 10.335
2026-07-21 14:55:57 runnervm3jd5f matplotlib.font_manager[2874] DEBUG findfont: score(FontEntry(fname='/home/runner/micromamba/envs/trajan/lib/python3.14/site-packages/matplotlib/mpl-data/fonts/ttf/DejaVuSans-Bold.ttf', index=0, name='DejaVu Sans', style='normal', variant='normal', weight=700, stretch='normal', size='scalable')) = 11.05
2026-07-21 14:55:57 runnervm3jd5f matplotlib.font_manager[2874] DEBUG findfont: score(FontEntry(fname='/home/runner/micromamba/envs/trajan/lib/python3.14/site-packages/matplotlib/mpl-data/fonts/ttf/STIXSizFourSymBol.ttf', index=0, name='STIXSizeFourSym', style='normal', variant='normal', weight=700, stretch='normal', size='scalable')) = 11.05
2026-07-21 14:55:57 runnervm3jd5f matplotlib.font_manager[2874] DEBUG findfont: score(FontEntry(fname='/home/runner/micromamba/envs/trajan/lib/python3.14/site-packages/matplotlib/mpl-data/fonts/ttf/STIXSizOneSymReg.ttf', index=0, name='STIXSizeOneSym', style='normal', variant='normal', weight=400, stretch='normal', size='scalable')) = 11.335
2026-07-21 14:55:57 runnervm3jd5f matplotlib.font_manager[2874] DEBUG findfont: score(FontEntry(fname='/home/runner/micromamba/envs/trajan/lib/python3.14/site-packages/matplotlib/mpl-data/fonts/ttf/cmr10.ttf', index=0, name='cmr10', style='normal', variant='normal', weight=400, stretch='normal', size='scalable')) = 11.335
2026-07-21 14:55:57 runnervm3jd5f matplotlib.font_manager[2874] DEBUG findfont: score(FontEntry(fname='/home/runner/micromamba/envs/trajan/lib/python3.14/site-packages/matplotlib/mpl-data/fonts/ttf/STIXGeneralBol.ttf', index=0, name='STIXGeneral', style='normal', variant='normal', weight=700, stretch='normal', size='scalable')) = 1.05
2026-07-21 14:55:57 runnervm3jd5f matplotlib.font_manager[2874] DEBUG findfont: score(FontEntry(fname='/home/runner/micromamba/envs/trajan/lib/python3.14/site-packages/matplotlib/mpl-data/fonts/ttf/DejaVuSans-BoldOblique.ttf', index=0, name='DejaVu Sans', style='oblique', variant='normal', weight=700, stretch='normal', size='scalable')) = 10.15
2026-07-21 14:55:57 runnervm3jd5f matplotlib.font_manager[2874] DEBUG findfont: score(FontEntry(fname='/home/runner/micromamba/envs/trajan/lib/python3.14/site-packages/matplotlib/mpl-data/fonts/ttf/STIXSizFourSymReg.ttf', index=0, name='STIXSizeFourSym', style='normal', variant='normal', weight=400, stretch='normal', size='scalable')) = 11.335
2026-07-21 14:55:57 runnervm3jd5f matplotlib.font_manager[2874] DEBUG findfont: score(FontEntry(fname='/usr/share/fonts/truetype/lato/Lato-Black.ttf', index=0, name='Lato', style='normal', variant='normal', weight=900, stretch='normal', size='scalable')) = 11.24
2026-07-21 14:55:57 runnervm3jd5f matplotlib.font_manager[2874] DEBUG findfont: score(FontEntry(fname='/usr/share/fonts/truetype/lato/Lato-Black.ttf', index=0, name='Lato Black', style='normal', variant='normal', weight=400, stretch='normal', size='scalable')) = 11.335
2026-07-21 14:55:57 runnervm3jd5f matplotlib.font_manager[2874] DEBUG findfont: score(FontEntry(fname='/usr/share/fonts/truetype/liberation/LiberationSerif-Regular.ttf', index=0, name='Liberation Serif', style='normal', variant='normal', weight=400, stretch='normal', size='scalable')) = 11.335
2026-07-21 14:55:57 runnervm3jd5f matplotlib.font_manager[2874] DEBUG findfont: score(FontEntry(fname='/usr/share/fonts/truetype/dejavu/DejaVuSerifCondensed.ttf', index=0, name='DejaVu Serif', style='normal', variant='normal', weight=400, stretch='condensed', size='scalable')) = 11.535
2026-07-21 14:55:57 runnervm3jd5f matplotlib.font_manager[2874] DEBUG findfont: score(FontEntry(fname='/usr/share/fonts/truetype/dejavu/DejaVuSerifCondensed.ttf', index=0, name='DejaVu Serif Condensed', style='normal', variant='normal', weight=380, stretch='condensed', size='scalable')) = 11.553999999999998
2026-07-21 14:55:57 runnervm3jd5f matplotlib.font_manager[2874] DEBUG findfont: score(FontEntry(fname='/home/runner/micromamba/envs/trajan/fonts/UbuntuMono-BI.ttf', index=0, name='Ubuntu Mono', style='italic', variant='normal', weight=700, stretch='normal', size='scalable')) = 10.05
2026-07-21 14:55:57 runnervm3jd5f matplotlib.font_manager[2874] DEBUG findfont: score(FontEntry(fname='/usr/share/fonts/truetype/dejavu/DejaVuSans.ttf', index=0, name='DejaVu Sans', style='normal', variant='normal', weight=400, stretch='normal', size='scalable')) = 11.335
2026-07-21 14:55:57 runnervm3jd5f matplotlib.font_manager[2874] DEBUG findfont: score(FontEntry(fname='/usr/share/fonts/truetype/lato/Lato-Italic.ttf', index=0, name='Lato', style='italic', variant='normal', weight=400, stretch='normal', size='scalable')) = 10.335
2026-07-21 14:55:57 runnervm3jd5f matplotlib.font_manager[2874] DEBUG findfont: score(FontEntry(fname='/usr/share/fonts/truetype/liberation/LiberationSans-Italic.ttf', index=0, name='Liberation Sans', style='italic', variant='normal', weight=400, stretch='normal', size='scalable')) = 10.335
2026-07-21 14:55:57 runnervm3jd5f matplotlib.font_manager[2874] DEBUG findfont: score(FontEntry(fname='/home/runner/micromamba/envs/trajan/fonts/Ubuntu-B.ttf', index=0, name='Ubuntu', style='normal', variant='normal', weight=700, stretch='normal', size='scalable')) = 11.05
2026-07-21 14:55:57 runnervm3jd5f matplotlib.font_manager[2874] DEBUG findfont: score(FontEntry(fname='/home/runner/micromamba/envs/trajan/fonts/SourceCodePro-Semibold.ttf', index=0, name='Source Code Pro', style='normal', variant='normal', weight=600, stretch='normal', size='scalable')) = 11.145
2026-07-21 14:55:57 runnervm3jd5f matplotlib.font_manager[2874] DEBUG findfont: score(FontEntry(fname='/home/runner/micromamba/envs/trajan/fonts/SourceCodePro-Semibold.ttf', index=0, name='Source Code Pro Semibold', style='normal', variant='normal', weight=400, stretch='normal', size='scalable')) = 11.335
2026-07-21 14:55:57 runnervm3jd5f matplotlib.font_manager[2874] DEBUG findfont: score(FontEntry(fname='/home/runner/micromamba/envs/trajan/fonts/SourceCodePro-Bold.ttf', index=0, name='Source Code Pro', style='normal', variant='normal', weight=700, stretch='normal', size='scalable')) = 11.05
2026-07-21 14:55:57 runnervm3jd5f matplotlib.font_manager[2874] DEBUG findfont: score(FontEntry(fname='/home/runner/micromamba/envs/trajan/fonts/Ubuntu-MI.ttf', index=0, name='Ubuntu', style='italic', variant='normal', weight=500, stretch='normal', size='scalable')) = 10.24
2026-07-21 14:55:57 runnervm3jd5f matplotlib.font_manager[2874] DEBUG findfont: score(FontEntry(fname='/home/runner/micromamba/envs/trajan/fonts/Ubuntu-MI.ttf', index=0, name='Ubuntu Light', style='italic', variant='normal', weight=700, stretch='normal', size='scalable')) = 10.05
2026-07-21 14:55:57 runnervm3jd5f matplotlib.font_manager[2874] DEBUG findfont: score(FontEntry(fname='/usr/share/fonts/truetype/lato/Lato-Regular.ttf', index=0, name='Lato', style='normal', variant='normal', weight=400, stretch='normal', size='scalable')) = 11.335
2026-07-21 14:55:57 runnervm3jd5f matplotlib.font_manager[2874] DEBUG findfont: score(FontEntry(fname='/usr/share/fonts/truetype/lato/Lato-ThinItalic.ttf', index=0, name='Lato', style='italic', variant='normal', weight=275, stretch='normal', size='scalable')) = 10.45375
2026-07-21 14:55:57 runnervm3jd5f matplotlib.font_manager[2874] DEBUG findfont: score(FontEntry(fname='/usr/share/fonts/truetype/lato/Lato-ThinItalic.ttf', index=0, name='Lato Thin', style='italic', variant='normal', weight=400, stretch='normal', size='scalable')) = 10.335
2026-07-21 14:55:57 runnervm3jd5f matplotlib.font_manager[2874] DEBUG findfont: score(FontEntry(fname='/usr/share/fonts/truetype/lato/Lato-BlackItalic.ttf', index=0, name='Lato', style='italic', variant='normal', weight=900, stretch='normal', size='scalable')) = 10.24
2026-07-21 14:55:57 runnervm3jd5f matplotlib.font_manager[2874] DEBUG findfont: score(FontEntry(fname='/usr/share/fonts/truetype/lato/Lato-BlackItalic.ttf', index=0, name='Lato Black', style='italic', variant='normal', weight=400, stretch='normal', size='scalable')) = 10.335
2026-07-21 14:55:57 runnervm3jd5f matplotlib.font_manager[2874] DEBUG findfont: score(FontEntry(fname='/usr/share/fonts/truetype/dejavu/DejaVuSerifCondensed-Italic.ttf', index=0, name='DejaVu Serif', style='italic', variant='normal', weight=400, stretch='condensed', size='scalable')) = 10.535
2026-07-21 14:55:57 runnervm3jd5f matplotlib.font_manager[2874] DEBUG findfont: score(FontEntry(fname='/usr/share/fonts/truetype/dejavu/DejaVuSerifCondensed-Italic.ttf', index=0, name='DejaVu Serif Condensed', style='italic', variant='normal', weight=400, stretch='condensed', size='scalable')) = 10.535
2026-07-21 14:55:57 runnervm3jd5f matplotlib.font_manager[2874] DEBUG findfont: score(FontEntry(fname='/usr/share/fonts/truetype/dejavu/DejaVuSans-Bold.ttf', index=0, name='DejaVu Sans', style='normal', variant='normal', weight=700, stretch='normal', size='scalable')) = 11.05
2026-07-21 14:55:57 runnervm3jd5f matplotlib.font_manager[2874] DEBUG findfont: score(FontEntry(fname='/home/runner/micromamba/envs/trajan/fonts/UbuntuMono-R.ttf', index=0, name='Ubuntu Mono', style='normal', variant='normal', weight=400, stretch='normal', size='scalable')) = 11.335
2026-07-21 14:55:57 runnervm3jd5f matplotlib.font_manager[2874] DEBUG findfont: score(FontEntry(fname='/usr/share/fonts/truetype/dejavu/DejaVuSerif-BoldItalic.ttf', index=0, name='DejaVu Serif', style='italic', variant='normal', weight=700, stretch='normal', size='scalable')) = 10.05
2026-07-21 14:55:57 runnervm3jd5f matplotlib.font_manager[2874] DEBUG findfont: score(FontEntry(fname='/usr/share/fonts/truetype/lato/Lato-Hairline.ttf', index=0, name='Lato', style='normal', variant='normal', weight=250, stretch='normal', size='scalable')) = 11.4775
2026-07-21 14:55:57 runnervm3jd5f matplotlib.font_manager[2874] DEBUG findfont: score(FontEntry(fname='/usr/share/fonts/truetype/lato/Lato-Hairline.ttf', index=0, name='Lato Hairline', style='normal', variant='normal', weight=400, stretch='normal', size='scalable')) = 11.335
2026-07-21 14:55:57 runnervm3jd5f matplotlib.font_manager[2874] DEBUG findfont: score(FontEntry(fname='/usr/share/fonts/truetype/lato/Lato-LightItalic.ttf', index=0, name='Lato', style='italic', variant='normal', weight=300, stretch='normal', size='scalable')) = 10.43
2026-07-21 14:55:57 runnervm3jd5f matplotlib.font_manager[2874] DEBUG findfont: score(FontEntry(fname='/usr/share/fonts/truetype/lato/Lato-LightItalic.ttf', index=0, name='Lato Light', style='italic', variant='normal', weight=400, stretch='normal', size='scalable')) = 10.335
2026-07-21 14:55:57 runnervm3jd5f matplotlib.font_manager[2874] DEBUG findfont: score(FontEntry(fname='/usr/share/fonts/truetype/dejavu/DejaVuSansCondensed-BoldOblique.ttf', index=0, name='DejaVu Sans', style='oblique', variant='normal', weight=700, stretch='condensed', size='scalable')) = 10.35
2026-07-21 14:55:57 runnervm3jd5f matplotlib.font_manager[2874] DEBUG findfont: score(FontEntry(fname='/usr/share/fonts/truetype/dejavu/DejaVuSansCondensed-BoldOblique.ttf', index=0, name='DejaVu Sans Condensed', style='oblique', variant='normal', weight=700, stretch='condensed', size='scalable')) = 10.35
2026-07-21 14:55:57 runnervm3jd5f matplotlib.font_manager[2874] DEBUG findfont: score(FontEntry(fname='/home/runner/micromamba/envs/trajan/fonts/SourceCodePro-It.ttf', index=0, name='Source Code Pro', style='italic', variant='normal', weight=400, stretch='normal', size='scalable')) = 10.335
2026-07-21 14:55:57 runnervm3jd5f matplotlib.font_manager[2874] DEBUG findfont: score(FontEntry(fname='/home/runner/micromamba/envs/trajan/fonts/SourceCodePro-ExtraLightIt.ttf', index=0, name='Source Code Pro', style='italic', variant='normal', weight=200, stretch='normal', size='scalable')) = 10.525
2026-07-21 14:55:57 runnervm3jd5f matplotlib.font_manager[2874] DEBUG findfont: score(FontEntry(fname='/home/runner/micromamba/envs/trajan/fonts/SourceCodePro-ExtraLightIt.ttf', index=0, name='Source Code Pro ExtraLight', style='italic', variant='normal', weight=400, stretch='normal', size='scalable')) = 10.335
2026-07-21 14:55:57 runnervm3jd5f matplotlib.font_manager[2874] DEBUG findfont: score(FontEntry(fname='/usr/share/fonts/truetype/lato/Lato-Medium.ttf', index=0, name='Lato', style='normal', variant='normal', weight=500, stretch='normal', size='scalable')) = 11.24
2026-07-21 14:55:57 runnervm3jd5f matplotlib.font_manager[2874] DEBUG findfont: score(FontEntry(fname='/usr/share/fonts/truetype/lato/Lato-Medium.ttf', index=0, name='Lato Medium', style='normal', variant='normal', weight=400, stretch='normal', size='scalable')) = 11.335
2026-07-21 14:55:57 runnervm3jd5f matplotlib.font_manager[2874] DEBUG findfont: score(FontEntry(fname='/usr/share/fonts/truetype/lato/Lato-BoldItalic.ttf', index=0, name='Lato', style='italic', variant='normal', weight=700, stretch='normal', size='scalable')) = 10.05
2026-07-21 14:55:57 runnervm3jd5f matplotlib.font_manager[2874] DEBUG findfont: score(FontEntry(fname='/home/runner/micromamba/envs/trajan/fonts/DejaVuSans.ttf', index=0, name='DejaVu Sans', style='normal', variant='normal', weight=400, stretch='normal', size='scalable')) = 11.335
2026-07-21 14:55:57 runnervm3jd5f matplotlib.font_manager[2874] DEBUG findfont: score(FontEntry(fname='/home/runner/micromamba/envs/trajan/fonts/UbuntuMono-B.ttf', index=0, name='Ubuntu Mono', style='normal', variant='normal', weight=700, stretch='normal', size='scalable')) = 11.05
2026-07-21 14:55:57 runnervm3jd5f matplotlib.font_manager[2874] DEBUG findfont: score(FontEntry(fname='/home/runner/micromamba/envs/trajan/fonts/SourceCodePro-LightIt.ttf', index=0, name='Source Code Pro', style='italic', variant='normal', weight=300, stretch='normal', size='scalable')) = 10.43
2026-07-21 14:55:57 runnervm3jd5f matplotlib.font_manager[2874] DEBUG findfont: score(FontEntry(fname='/home/runner/micromamba/envs/trajan/fonts/SourceCodePro-LightIt.ttf', index=0, name='Source Code Pro Light', style='italic', variant='normal', weight=400, stretch='normal', size='scalable')) = 10.335
2026-07-21 14:55:57 runnervm3jd5f matplotlib.font_manager[2874] DEBUG findfont: score(FontEntry(fname='/usr/share/fonts/truetype/liberation/LiberationSans-BoldItalic.ttf', index=0, name='Liberation Sans', style='italic', variant='normal', weight=700, stretch='normal', size='scalable')) = 10.05
2026-07-21 14:55:57 runnervm3jd5f matplotlib.font_manager[2874] DEBUG findfont: score(FontEntry(fname='/usr/share/fonts/truetype/liberation/LiberationSans-Regular.ttf', index=0, name='Liberation Sans', style='normal', variant='normal', weight=400, stretch='normal', size='scalable')) = 11.335
2026-07-21 14:55:57 runnervm3jd5f matplotlib.font_manager[2874] DEBUG findfont: score(FontEntry(fname='/usr/share/fonts/truetype/dejavu/DejaVuSansMono-Bold.ttf', index=0, name='DejaVu Sans Mono', style='normal', variant='normal', weight=700, stretch='normal', size='scalable')) = 11.05
2026-07-21 14:55:57 runnervm3jd5f matplotlib.font_manager[2874] DEBUG findfont: score(FontEntry(fname='/home/runner/micromamba/envs/trajan/fonts/SourceCodePro-BoldIt.ttf', index=0, name='Source Code Pro', style='italic', variant='normal', weight=700, stretch='normal', size='scalable')) = 10.05
2026-07-21 14:55:57 runnervm3jd5f matplotlib.font_manager[2874] DEBUG findfont: score(FontEntry(fname='/usr/share/fonts/truetype/lato/Lato-Bold.ttf', index=0, name='Lato', style='normal', variant='normal', weight=700, stretch='normal', size='scalable')) = 11.05
2026-07-21 14:55:57 runnervm3jd5f matplotlib.font_manager[2874] DEBUG findfont: score(FontEntry(fname='/usr/share/fonts/truetype/dejavu/DejaVuSansCondensed.ttf', index=0, name='DejaVu Sans', style='normal', variant='normal', weight=400, stretch='condensed', size='scalable')) = 11.535
2026-07-21 14:55:57 runnervm3jd5f matplotlib.font_manager[2874] DEBUG findfont: score(FontEntry(fname='/usr/share/fonts/truetype/dejavu/DejaVuSansCondensed.ttf', index=0, name='DejaVu Sans Condensed', style='normal', variant='normal', weight=380, stretch='condensed', size='scalable')) = 11.553999999999998
2026-07-21 14:55:57 runnervm3jd5f matplotlib.font_manager[2874] DEBUG findfont: score(FontEntry(fname='/usr/share/fonts/truetype/lato/Lato-MediumItalic.ttf', index=0, name='Lato', style='italic', variant='normal', weight=500, stretch='normal', size='scalable')) = 10.24
2026-07-21 14:55:57 runnervm3jd5f matplotlib.font_manager[2874] DEBUG findfont: score(FontEntry(fname='/usr/share/fonts/truetype/lato/Lato-MediumItalic.ttf', index=0, name='Lato Medium', style='italic', variant='normal', weight=400, stretch='normal', size='scalable')) = 10.335
2026-07-21 14:55:57 runnervm3jd5f matplotlib.font_manager[2874] DEBUG findfont: score(FontEntry(fname='/usr/share/fonts/truetype/liberation/LiberationSans-Bold.ttf', index=0, name='Liberation Sans', style='normal', variant='normal', weight=700, stretch='normal', size='scalable')) = 11.05
2026-07-21 14:55:57 runnervm3jd5f matplotlib.font_manager[2874] DEBUG findfont: score(FontEntry(fname='/usr/share/fonts/truetype/dejavu/DejaVuSerifCondensed-BoldItalic.ttf', index=0, name='DejaVu Serif', style='italic', variant='normal', weight=700, stretch='condensed', size='scalable')) = 10.25
2026-07-21 14:55:57 runnervm3jd5f matplotlib.font_manager[2874] DEBUG findfont: score(FontEntry(fname='/usr/share/fonts/truetype/dejavu/DejaVuSerifCondensed-BoldItalic.ttf', index=0, name='DejaVu Serif Condensed', style='italic', variant='normal', weight=700, stretch='condensed', size='scalable')) = 10.25
2026-07-21 14:55:57 runnervm3jd5f matplotlib.font_manager[2874] DEBUG findfont: score(FontEntry(fname='/home/runner/micromamba/envs/trajan/fonts/Ubuntu-R.ttf', index=0, name='Ubuntu', style='normal', variant='normal', weight=400, stretch='normal', size='scalable')) = 11.335
2026-07-21 14:55:57 runnervm3jd5f matplotlib.font_manager[2874] DEBUG findfont: score(FontEntry(fname='/usr/share/fonts/truetype/lato/Lato-Light.ttf', index=0, name='Lato', style='normal', variant='normal', weight=300, stretch='normal', size='scalable')) = 11.43
2026-07-21 14:55:57 runnervm3jd5f matplotlib.font_manager[2874] DEBUG findfont: score(FontEntry(fname='/usr/share/fonts/truetype/lato/Lato-Light.ttf', index=0, name='Lato Light', style='normal', variant='normal', weight=400, stretch='normal', size='scalable')) = 11.335
2026-07-21 14:55:57 runnervm3jd5f matplotlib.font_manager[2874] DEBUG findfont: score(FontEntry(fname='/usr/share/fonts/truetype/liberation/LiberationSerif-BoldItalic.ttf', index=0, name='Liberation Serif', style='italic', variant='normal', weight=700, stretch='normal', size='scalable')) = 10.05
2026-07-21 14:55:57 runnervm3jd5f matplotlib.font_manager[2874] DEBUG findfont: score(FontEntry(fname='/home/runner/micromamba/envs/trajan/fonts/Ubuntu-Th.ttf', index=0, name='Ubuntu', style='normal', variant='normal', weight=250, stretch='normal', size='scalable')) = 11.4775
2026-07-21 14:55:57 runnervm3jd5f matplotlib.font_manager[2874] DEBUG findfont: score(FontEntry(fname='/home/runner/micromamba/envs/trajan/fonts/Ubuntu-Th.ttf', index=0, name='Ubuntu Thin', style='normal', variant='normal', weight=400, stretch='normal', size='scalable')) = 11.335
2026-07-21 14:55:57 runnervm3jd5f matplotlib.font_manager[2874] DEBUG findfont: score(FontEntry(fname='/home/runner/micromamba/envs/trajan/fonts/SourceCodePro-ExtraLight.ttf', index=0, name='Source Code Pro', style='normal', variant='normal', weight=200, stretch='normal', size='scalable')) = 11.525
2026-07-21 14:55:57 runnervm3jd5f matplotlib.font_manager[2874] DEBUG findfont: score(FontEntry(fname='/home/runner/micromamba/envs/trajan/fonts/SourceCodePro-ExtraLight.ttf', index=0, name='Source Code Pro ExtraLight', style='normal', variant='normal', weight=400, stretch='normal', size='scalable')) = 11.335
2026-07-21 14:55:57 runnervm3jd5f matplotlib.font_manager[2874] DEBUG findfont: score(FontEntry(fname='/usr/share/fonts/truetype/lato/Lato-Thin.ttf', index=0, name='Lato', style='normal', variant='normal', weight=275, stretch='normal', size='scalable')) = 11.45375
2026-07-21 14:55:57 runnervm3jd5f matplotlib.font_manager[2874] DEBUG findfont: score(FontEntry(fname='/usr/share/fonts/truetype/lato/Lato-Thin.ttf', index=0, name='Lato Thin', style='normal', variant='normal', weight=400, stretch='normal', size='scalable')) = 11.335
2026-07-21 14:55:57 runnervm3jd5f matplotlib.font_manager[2874] DEBUG findfont: score(FontEntry(fname='/usr/share/fonts/truetype/liberation/LiberationSerif-Bold.ttf', index=0, name='Liberation Serif', style='normal', variant='normal', weight=700, stretch='normal', size='scalable')) = 11.05
2026-07-21 14:55:57 runnervm3jd5f matplotlib.font_manager[2874] DEBUG findfont: score(FontEntry(fname='/home/runner/micromamba/envs/trajan/fonts/Inconsolata-Regular.ttf', index=0, name='Inconsolata', style='normal', variant='normal', weight=400, stretch='normal', size='scalable')) = 11.335
2026-07-21 14:55:57 runnervm3jd5f matplotlib.font_manager[2874] DEBUG findfont: score(FontEntry(fname='/home/runner/micromamba/envs/trajan/fonts/Ubuntu-C.ttf', index=0, name='Ubuntu Condensed', style='normal', variant='normal', weight=400, stretch='condensed', size='scalable')) = 11.535
2026-07-21 14:55:57 runnervm3jd5f matplotlib.font_manager[2874] DEBUG findfont: score(FontEntry(fname='/usr/share/fonts/truetype/dejavu/DejaVuSansCondensed-Bold.ttf', index=0, name='DejaVu Sans', style='normal', variant='normal', weight=700, stretch='condensed', size='scalable')) = 11.25
2026-07-21 14:55:57 runnervm3jd5f matplotlib.font_manager[2874] DEBUG findfont: score(FontEntry(fname='/usr/share/fonts/truetype/dejavu/DejaVuSansCondensed-Bold.ttf', index=0, name='DejaVu Sans Condensed', style='normal', variant='normal', weight=700, stretch='condensed', size='scalable')) = 11.25
2026-07-21 14:55:57 runnervm3jd5f matplotlib.font_manager[2874] DEBUG findfont: score(FontEntry(fname='/usr/share/fonts/truetype/liberation/LiberationMono-Bold.ttf', index=0, name='Liberation Mono', style='normal', variant='normal', weight=700, stretch='normal', size='scalable')) = 11.05
2026-07-21 14:55:57 runnervm3jd5f matplotlib.font_manager[2874] DEBUG findfont: score(FontEntry(fname='/home/runner/micromamba/envs/trajan/fonts/SourceCodePro-Black.ttf', index=0, name='Source Code Pro', style='normal', variant='normal', weight=900, stretch='normal', size='scalable')) = 11.24
2026-07-21 14:55:57 runnervm3jd5f matplotlib.font_manager[2874] DEBUG findfont: score(FontEntry(fname='/home/runner/micromamba/envs/trajan/fonts/SourceCodePro-Black.ttf', index=0, name='Source Code Pro Black', style='normal', variant='normal', weight=400, stretch='normal', size='scalable')) = 11.335
2026-07-21 14:55:57 runnervm3jd5f matplotlib.font_manager[2874] DEBUG findfont: score(FontEntry(fname='/home/runner/micromamba/envs/trajan/fonts/SourceCodePro-BlackIt.ttf', index=0, name='Source Code Pro', style='italic', variant='normal', weight=900, stretch='normal', size='scalable')) = 10.24
2026-07-21 14:55:57 runnervm3jd5f matplotlib.font_manager[2874] DEBUG findfont: score(FontEntry(fname='/home/runner/micromamba/envs/trajan/fonts/SourceCodePro-BlackIt.ttf', index=0, name='Source Code Pro Black', style='italic', variant='normal', weight=400, stretch='normal', size='scalable')) = 10.335
2026-07-21 14:55:57 runnervm3jd5f matplotlib.font_manager[2874] DEBUG findfont: score(FontEntry(fname='/home/runner/micromamba/envs/trajan/fonts/Ubuntu-LI.ttf', index=0, name='Ubuntu', style='italic', variant='normal', weight=300, stretch='normal', size='scalable')) = 10.43
2026-07-21 14:55:57 runnervm3jd5f matplotlib.font_manager[2874] DEBUG findfont: score(FontEntry(fname='/home/runner/micromamba/envs/trajan/fonts/Ubuntu-LI.ttf', index=0, name='Ubuntu Light', style='italic', variant='normal', weight=400, stretch='normal', size='scalable')) = 10.335
2026-07-21 14:55:57 runnervm3jd5f matplotlib.font_manager[2874] DEBUG findfont: score(FontEntry(fname='/usr/share/fonts/truetype/liberation/LiberationMono-Regular.ttf', index=0, name='Liberation Mono', style='normal', variant='normal', weight=400, stretch='normal', size='scalable')) = 11.335
2026-07-21 14:55:57 runnervm3jd5f matplotlib.font_manager[2874] DEBUG findfont: score(FontEntry(fname='/home/runner/micromamba/envs/trajan/fonts/UbuntuMono-RI.ttf', index=0, name='Ubuntu Mono', style='italic', variant='normal', weight=400, stretch='normal', size='scalable')) = 10.335
2026-07-21 14:55:57 runnervm3jd5f matplotlib.font_manager[2874] DEBUG findfont: score(FontEntry(fname='/usr/share/fonts/truetype/lato/Lato-Heavy.ttf', index=0, name='Lato', style='normal', variant='normal', weight=800, stretch='normal', size='scalable')) = 11.145
2026-07-21 14:55:57 runnervm3jd5f matplotlib.font_manager[2874] DEBUG findfont: score(FontEntry(fname='/usr/share/fonts/truetype/lato/Lato-Heavy.ttf', index=0, name='Lato Heavy', style='normal', variant='normal', weight=400, stretch='normal', size='scalable')) = 11.335
2026-07-21 14:55:57 runnervm3jd5f matplotlib.font_manager[2874] DEBUG findfont: score(FontEntry(fname='/usr/share/fonts/truetype/lato/Lato-HairlineItalic.ttf', index=0, name='Lato', style='italic', variant='normal', weight=250, stretch='normal', size='scalable')) = 10.4775
2026-07-21 14:55:57 runnervm3jd5f matplotlib.font_manager[2874] DEBUG findfont: score(FontEntry(fname='/usr/share/fonts/truetype/lato/Lato-HairlineItalic.ttf', index=0, name='Lato Hairline', style='italic', variant='normal', weight=400, stretch='normal', size='scalable')) = 10.335
2026-07-21 14:55:57 runnervm3jd5f matplotlib.font_manager[2874] DEBUG findfont: score(FontEntry(fname='/usr/share/fonts/truetype/dejavu/DejaVuSerifCondensed-Bold.ttf', index=0, name='DejaVu Serif', style='normal', variant='normal', weight=700, stretch='condensed', size='scalable')) = 11.25
2026-07-21 14:55:57 runnervm3jd5f matplotlib.font_manager[2874] DEBUG findfont: score(FontEntry(fname='/usr/share/fonts/truetype/dejavu/DejaVuSerifCondensed-Bold.ttf', index=0, name='DejaVu Serif Condensed', style='normal', variant='normal', weight=700, stretch='condensed', size='scalable')) = 11.25
2026-07-21 14:55:57 runnervm3jd5f matplotlib.font_manager[2874] DEBUG findfont: score(FontEntry(fname='/usr/share/fonts/truetype/dejavu/DejaVuSansCondensed-Oblique.ttf', index=0, name='DejaVu Sans', style='oblique', variant='normal', weight=400, stretch='condensed', size='scalable')) = 10.634999999999998
2026-07-21 14:55:57 runnervm3jd5f matplotlib.font_manager[2874] DEBUG findfont: score(FontEntry(fname='/usr/share/fonts/truetype/dejavu/DejaVuSansCondensed-Oblique.ttf', index=0, name='DejaVu Sans Condensed', style='oblique', variant='normal', weight=400, stretch='condensed', size='scalable')) = 10.634999999999998
2026-07-21 14:55:57 runnervm3jd5f matplotlib.font_manager[2874] DEBUG findfont: score(FontEntry(fname='/usr/share/fonts/truetype/lato/Lato-SemiboldItalic.ttf', index=0, name='Lato', style='italic', variant='normal', weight=600, stretch='normal', size='scalable')) = 10.145
2026-07-21 14:55:57 runnervm3jd5f matplotlib.font_manager[2874] DEBUG findfont: score(FontEntry(fname='/usr/share/fonts/truetype/lato/Lato-SemiboldItalic.ttf', index=0, name='Lato Semibold', style='italic', variant='normal', weight=400, stretch='normal', size='scalable')) = 10.335
2026-07-21 14:55:57 runnervm3jd5f matplotlib.font_manager[2874] DEBUG findfont: score(FontEntry(fname='/usr/share/fonts/truetype/lato/Lato-Semibold.ttf', index=0, name='Lato', style='normal', variant='normal', weight=600, stretch='normal', size='scalable')) = 11.145
2026-07-21 14:55:57 runnervm3jd5f matplotlib.font_manager[2874] DEBUG findfont: score(FontEntry(fname='/usr/share/fonts/truetype/lato/Lato-Semibold.ttf', index=0, name='Lato Semibold', style='normal', variant='normal', weight=400, stretch='normal', size='scalable')) = 11.335
2026-07-21 14:55:57 runnervm3jd5f matplotlib.font_manager[2874] DEBUG findfont: score(FontEntry(fname='/home/runner/micromamba/envs/trajan/fonts/Inconsolata-Bold.ttf', index=0, name='Inconsolata', style='normal', variant='normal', weight=700, stretch='normal', size='scalable')) = 11.05
2026-07-21 14:55:57 runnervm3jd5f matplotlib.font_manager[2874] DEBUG findfont: score(FontEntry(fname='/usr/share/fonts/truetype/dejavu/DejaVuSans-ExtraLight.ttf', index=0, name='DejaVu Sans', style='normal', variant='normal', weight=200, stretch='normal', size='scalable')) = 11.525
2026-07-21 14:55:57 runnervm3jd5f matplotlib.font_manager[2874] DEBUG findfont: score(FontEntry(fname='/usr/share/fonts/truetype/dejavu/DejaVuSans-ExtraLight.ttf', index=0, name='DejaVu Sans Light', style='normal', variant='normal', weight=200, stretch='normal', size='scalable')) = 11.525
2026-07-21 14:55:57 runnervm3jd5f matplotlib.font_manager[2874] DEBUG findfont: score(FontEntry(fname='/home/runner/micromamba/envs/trajan/fonts/Ubuntu-BI.ttf', index=0, name='Ubuntu', style='italic', variant='normal', weight=700, stretch='normal', size='scalable')) = 10.05
2026-07-21 14:55:57 runnervm3jd5f matplotlib.font_manager[2874] DEBUG findfont: score(FontEntry(fname='/usr/share/fonts/truetype/dejavu/DejaVuSans-BoldOblique.ttf', index=0, name='DejaVu Sans', style='oblique', variant='normal', weight=700, stretch='normal', size='scalable')) = 10.15
2026-07-21 14:55:57 runnervm3jd5f matplotlib.font_manager[2874] DEBUG findfont: score(FontEntry(fname='/home/runner/micromamba/envs/trajan/fonts/Ubuntu-RI.ttf', index=0, name='Ubuntu', style='italic', variant='normal', weight=400, stretch='normal', size='scalable')) = 10.335
2026-07-21 14:55:57 runnervm3jd5f matplotlib.font_manager[2874] DEBUG findfont: score(FontEntry(fname='/usr/share/fonts/truetype/dejavu/DejaVuSerif-Italic.ttf', index=0, name='DejaVu Serif', style='italic', variant='normal', weight=400, stretch='normal', size='scalable')) = 10.335
2026-07-21 14:55:57 runnervm3jd5f matplotlib.font_manager[2874] DEBUG findfont: score(FontEntry(fname='/home/runner/micromamba/envs/trajan/fonts/SourceCodePro-Medium.ttf', index=0, name='Source Code Pro', style='normal', variant='normal', weight=500, stretch='normal', size='scalable')) = 11.24
2026-07-21 14:55:57 runnervm3jd5f matplotlib.font_manager[2874] DEBUG findfont: score(FontEntry(fname='/home/runner/micromamba/envs/trajan/fonts/SourceCodePro-Medium.ttf', index=0, name='Source Code Pro Medium', style='normal', variant='normal', weight=400, stretch='normal', size='scalable')) = 11.335
2026-07-21 14:55:57 runnervm3jd5f matplotlib.font_manager[2874] DEBUG findfont: score(FontEntry(fname='/usr/share/fonts/truetype/lato/Lato-HeavyItalic.ttf', index=0, name='Lato', style='italic', variant='normal', weight=800, stretch='normal', size='scalable')) = 10.145
2026-07-21 14:55:57 runnervm3jd5f matplotlib.font_manager[2874] DEBUG findfont: score(FontEntry(fname='/usr/share/fonts/truetype/lato/Lato-HeavyItalic.ttf', index=0, name='Lato Heavy', style='italic', variant='normal', weight=400, stretch='normal', size='scalable')) = 10.335
2026-07-21 14:55:57 runnervm3jd5f matplotlib.font_manager[2874] DEBUG findfont: score(FontEntry(fname='/usr/share/fonts/truetype/dejavu/DejaVuSans-Oblique.ttf', index=0, name='DejaVu Sans', style='oblique', variant='normal', weight=400, stretch='normal', size='scalable')) = 10.434999999999999
2026-07-21 14:55:57 runnervm3jd5f matplotlib.font_manager[2874] DEBUG findfont: score(FontEntry(fname='/home/runner/micromamba/envs/trajan/fonts/Ubuntu-M.ttf', index=0, name='Ubuntu', style='normal', variant='normal', weight=500, stretch='normal', size='scalable')) = 11.24
2026-07-21 14:55:57 runnervm3jd5f matplotlib.font_manager[2874] DEBUG findfont: score(FontEntry(fname='/home/runner/micromamba/envs/trajan/fonts/Ubuntu-M.ttf', index=0, name='Ubuntu Light', style='normal', variant='normal', weight=700, stretch='normal', size='scalable')) = 11.05
2026-07-21 14:55:57 runnervm3jd5f matplotlib.font_manager[2874] DEBUG findfont: score(FontEntry(fname='/usr/share/fonts/truetype/liberation/LiberationMono-BoldItalic.ttf', index=0, name='Liberation Mono', style='italic', variant='normal', weight=700, stretch='normal', size='scalable')) = 10.05
2026-07-21 14:55:57 runnervm3jd5f matplotlib.font_manager[2874] DEBUG findfont: score(FontEntry(fname='/usr/share/fonts/truetype/dejavu/DejaVuSansMono.ttf', index=0, name='DejaVu Sans Mono', style='normal', variant='normal', weight=400, stretch='normal', size='scalable')) = 11.335
2026-07-21 14:55:57 runnervm3jd5f matplotlib.font_manager[2874] DEBUG findfont: score(FontEntry(fname='/usr/share/fonts/truetype/dejavu/DejaVuMathTeXGyre.ttf', index=0, name='DejaVu Math TeX Gyre', style='normal', variant='normal', weight=400, stretch='normal', size='scalable')) = 11.335
2026-07-21 14:55:57 runnervm3jd5f matplotlib.font_manager[2874] DEBUG findfont: score(FontEntry(fname='/usr/share/fonts/truetype/dejavu/DejaVuSansMono-Oblique.ttf', index=0, name='DejaVu Sans Mono', style='oblique', variant='normal', weight=400, stretch='normal', size='scalable')) = 10.434999999999999
2026-07-21 14:55:57 runnervm3jd5f matplotlib.font_manager[2874] DEBUG findfont: score(FontEntry(fname='/home/runner/micromamba/envs/trajan/fonts/Ubuntu-L.ttf', index=0, name='Ubuntu', style='normal', variant='normal', weight=300, stretch='normal', size='scalable')) = 11.43
2026-07-21 14:55:57 runnervm3jd5f matplotlib.font_manager[2874] DEBUG findfont: score(FontEntry(fname='/home/runner/micromamba/envs/trajan/fonts/Ubuntu-L.ttf', index=0, name='Ubuntu Light', style='normal', variant='normal', weight=400, stretch='normal', size='scalable')) = 11.335
2026-07-21 14:55:57 runnervm3jd5f matplotlib.font_manager[2874] DEBUG findfont: score(FontEntry(fname='/home/runner/micromamba/envs/trajan/fonts/SourceCodePro-MediumIt.ttf', index=0, name='Source Code Pro', style='italic', variant='normal', weight=500, stretch='normal', size='scalable')) = 10.24
2026-07-21 14:55:57 runnervm3jd5f matplotlib.font_manager[2874] DEBUG findfont: score(FontEntry(fname='/home/runner/micromamba/envs/trajan/fonts/SourceCodePro-MediumIt.ttf', index=0, name='Source Code Pro Medium', style='italic', variant='normal', weight=400, stretch='normal', size='scalable')) = 10.335
2026-07-21 14:55:57 runnervm3jd5f matplotlib.font_manager[2874] DEBUG findfont: score(FontEntry(fname='/home/runner/micromamba/envs/trajan/fonts/SourceCodePro-Regular.ttf', index=0, name='Source Code Pro', style='normal', variant='normal', weight=400, stretch='normal', size='scalable')) = 11.335
2026-07-21 14:55:57 runnervm3jd5f matplotlib.font_manager[2874] DEBUG findfont: score(FontEntry(fname='/home/runner/micromamba/envs/trajan/fonts/SourceCodePro-SemiboldIt.ttf', index=0, name='Source Code Pro', style='italic', variant='normal', weight=600, stretch='normal', size='scalable')) = 10.145
2026-07-21 14:55:57 runnervm3jd5f matplotlib.font_manager[2874] DEBUG findfont: score(FontEntry(fname='/home/runner/micromamba/envs/trajan/fonts/SourceCodePro-SemiboldIt.ttf', index=0, name='Source Code Pro Semibold', style='italic', variant='normal', weight=400, stretch='normal', size='scalable')) = 10.335
2026-07-21 14:55:57 runnervm3jd5f matplotlib.font_manager[2874] DEBUG findfont: score(FontEntry(fname='/usr/share/fonts/truetype/dejavu/DejaVuSerif.ttf', index=0, name='DejaVu Serif', style='normal', variant='normal', weight=400, stretch='normal', size='scalable')) = 11.335
2026-07-21 14:55:57 runnervm3jd5f matplotlib.font_manager[2874] DEBUG findfont: score(FontEntry(fname='/usr/share/fonts/truetype/dejavu/DejaVuSerif-Bold.ttf', index=0, name='DejaVu Serif', style='normal', variant='normal', weight=700, stretch='normal', size='scalable')) = 11.05
2026-07-21 14:55:57 runnervm3jd5f matplotlib.font_manager[2874] DEBUG findfont: score(FontEntry(fname='/usr/share/fonts/truetype/liberation/LiberationSerif-Italic.ttf', index=0, name='Liberation Serif', style='italic', variant='normal', weight=400, stretch='normal', size='scalable')) = 10.335
2026-07-21 14:55:57 runnervm3jd5f matplotlib.font_manager[2874] DEBUG findfont: score(FontEntry(fname='/usr/share/fonts/truetype/dejavu/DejaVuSansMono-BoldOblique.ttf', index=0, name='DejaVu Sans Mono', style='oblique', variant='normal', weight=700, stretch='normal', size='scalable')) = 10.15
2026-07-21 14:55:57 runnervm3jd5f matplotlib.font_manager[2874] DEBUG findfont: score(FontEntry(fname='/home/runner/micromamba/envs/trajan/fonts/SourceCodePro-Light.ttf', index=0, name='Source Code Pro', style='normal', variant='normal', weight=300, stretch='normal', size='scalable')) = 11.43
2026-07-21 14:55:57 runnervm3jd5f matplotlib.font_manager[2874] DEBUG findfont: score(FontEntry(fname='/home/runner/micromamba/envs/trajan/fonts/SourceCodePro-Light.ttf', index=0, name='Source Code Pro Light', style='normal', variant='normal', weight=400, stretch='normal', size='scalable')) = 11.335
2026-07-21 14:55:57 runnervm3jd5f matplotlib.font_manager[2874] DEBUG findfont: score(FontEntry(fname='/usr/share/fonts/truetype/liberation/LiberationMono-Italic.ttf', index=0, name='Liberation Mono', style='italic', variant='normal', weight=400, stretch='normal', size='scalable')) = 10.335
2026-07-21 14:55:57 runnervm3jd5f matplotlib.font_manager[2874] DEBUG findfont: Matching STIXGeneral:style=italic:variant=normal:weight=bold:stretch=normal:size=10.0 to STIXGeneral ('/home/runner/micromamba/envs/trajan/lib/python3.14/site-packages/matplotlib/mpl-data/fonts/ttf/STIXGeneralBolIta.ttf') with score of 0.050000.
2026-07-21 14:55:57 runnervm3jd5f matplotlib.font_manager[2874] DEBUG findfont: Matching STIXNonUnicode:style=normal:variant=normal:weight=normal:stretch=normal:size=10.0.
2026-07-21 14:55:57 runnervm3jd5f matplotlib.font_manager[2874] DEBUG findfont: score(FontEntry(fname='/home/runner/micromamba/envs/trajan/lib/python3.14/site-packages/matplotlib/mpl-data/fonts/ttf/cmmi10.ttf', index=0, name='cmmi10', style='normal', variant='normal', weight=400, stretch='normal', size='scalable')) = 10.05
2026-07-21 14:55:57 runnervm3jd5f matplotlib.font_manager[2874] DEBUG findfont: score(FontEntry(fname='/home/runner/micromamba/envs/trajan/lib/python3.14/site-packages/matplotlib/mpl-data/fonts/ttf/DejaVuSerif-Bold.ttf', index=0, name='DejaVu Serif', style='normal', variant='normal', weight=700, stretch='normal', size='scalable')) = 10.335
2026-07-21 14:55:57 runnervm3jd5f matplotlib.font_manager[2874] DEBUG findfont: score(FontEntry(fname='/home/runner/micromamba/envs/trajan/lib/python3.14/site-packages/matplotlib/mpl-data/fonts/ttf/DejaVuSans-Oblique.ttf', index=0, name='DejaVu Sans', style='oblique', variant='normal', weight=400, stretch='normal', size='scalable')) = 11.05
2026-07-21 14:55:57 runnervm3jd5f matplotlib.font_manager[2874] DEBUG findfont: score(FontEntry(fname='/home/runner/micromamba/envs/trajan/lib/python3.14/site-packages/matplotlib/mpl-data/fonts/ttf/STIXSizThreeSymReg.ttf', index=0, name='STIXSizeThreeSym', style='normal', variant='normal', weight=400, stretch='normal', size='scalable')) = 10.05
2026-07-21 14:55:57 runnervm3jd5f matplotlib.font_manager[2874] DEBUG findfont: score(FontEntry(fname='/home/runner/micromamba/envs/trajan/lib/python3.14/site-packages/matplotlib/mpl-data/fonts/ttf/STIXNonUniBolIta.ttf', index=0, name='STIXNonUnicode', style='italic', variant='normal', weight=700, stretch='normal', size='scalable')) = 1.335
2026-07-21 14:55:57 runnervm3jd5f matplotlib.font_manager[2874] DEBUG findfont: score(FontEntry(fname='/home/runner/micromamba/envs/trajan/lib/python3.14/site-packages/matplotlib/mpl-data/fonts/ttf/DejaVuSerifDisplay.ttf', index=0, name='DejaVu Serif Display', style='normal', variant='normal', weight=400, stretch='normal', size='scalable')) = 10.05
2026-07-21 14:55:57 runnervm3jd5f matplotlib.font_manager[2874] DEBUG findfont: score(FontEntry(fname='/home/runner/micromamba/envs/trajan/lib/python3.14/site-packages/matplotlib/mpl-data/fonts/ttf/cmss10.ttf', index=0, name='cmss10', style='normal', variant='normal', weight=400, stretch='normal', size='scalable')) = 10.05
2026-07-21 14:55:57 runnervm3jd5f matplotlib.font_manager[2874] DEBUG findfont: score(FontEntry(fname='/home/runner/micromamba/envs/trajan/lib/python3.14/site-packages/matplotlib/mpl-data/fonts/ttf/STIXGeneralBolIta.ttf', index=0, name='STIXGeneral', style='italic', variant='normal', weight=700, stretch='normal', size='scalable')) = 11.335
2026-07-21 14:55:57 runnervm3jd5f matplotlib.font_manager[2874] DEBUG findfont: score(FontEntry(fname='/home/runner/micromamba/envs/trajan/lib/python3.14/site-packages/matplotlib/mpl-data/fonts/ttf/cmtt10.ttf', index=0, name='cmtt10', style='normal', variant='normal', weight=400, stretch='normal', size='scalable')) = 10.05
2026-07-21 14:55:57 runnervm3jd5f matplotlib.font_manager[2874] DEBUG findfont: score(FontEntry(fname='/home/runner/micromamba/envs/trajan/lib/python3.14/site-packages/matplotlib/mpl-data/fonts/ttf/cmsy10.ttf', index=0, name='cmsy10', style='normal', variant='normal', weight=400, stretch='normal', size='scalable')) = 10.05
2026-07-21 14:55:57 runnervm3jd5f matplotlib.font_manager[2874] DEBUG findfont: score(FontEntry(fname='/home/runner/micromamba/envs/trajan/lib/python3.14/site-packages/matplotlib/mpl-data/fonts/ttf/DejaVuSansMono-Oblique.ttf', index=0, name='DejaVu Sans Mono', style='oblique', variant='normal', weight=400, stretch='normal', size='scalable')) = 11.05
2026-07-21 14:55:57 runnervm3jd5f matplotlib.font_manager[2874] DEBUG findfont: score(FontEntry(fname='/home/runner/micromamba/envs/trajan/lib/python3.14/site-packages/matplotlib/mpl-data/fonts/ttf/STIXNonUniIta.ttf', index=0, name='STIXNonUnicode', style='italic', variant='normal', weight=400, stretch='normal', size='scalable')) = 1.05
2026-07-21 14:55:57 runnervm3jd5f matplotlib.font_manager[2874] DEBUG findfont: score(FontEntry(fname='/home/runner/micromamba/envs/trajan/lib/python3.14/site-packages/matplotlib/mpl-data/fonts/ttf/STIXGeneral.ttf', index=0, name='STIXGeneral', style='normal', variant='normal', weight=400, stretch='normal', size='scalable')) = 10.05
2026-07-21 14:55:57 runnervm3jd5f matplotlib.font_manager[2874] DEBUG findfont: score(FontEntry(fname='/home/runner/micromamba/envs/trajan/lib/python3.14/site-packages/matplotlib/mpl-data/fonts/ttf/cmti10.ttf', index=0, name='cmti10', style='normal', variant='normal', weight=400, stretch='normal', size='scalable')) = 10.05
2026-07-21 14:55:57 runnervm3jd5f matplotlib.font_manager[2874] DEBUG findfont: score(FontEntry(fname='/home/runner/micromamba/envs/trajan/lib/python3.14/site-packages/matplotlib/mpl-data/fonts/ttf/DejaVuSansMono-BoldOblique.ttf', index=0, name='DejaVu Sans Mono', style='oblique', variant='normal', weight=700, stretch='normal', size='scalable')) = 11.335
2026-07-21 14:55:57 runnervm3jd5f matplotlib.font_manager[2874] DEBUG findfont: score(FontEntry(fname='/home/runner/micromamba/envs/trajan/lib/python3.14/site-packages/matplotlib/mpl-data/fonts/ttf/DejaVuSerif.ttf', index=0, name='DejaVu Serif', style='normal', variant='normal', weight=400, stretch='normal', size='scalable')) = 10.05
2026-07-21 14:55:57 runnervm3jd5f matplotlib.font_manager[2874] DEBUG findfont: score(FontEntry(fname='/home/runner/micromamba/envs/trajan/lib/python3.14/site-packages/matplotlib/mpl-data/fonts/ttf/LastResortHE-Regular.ttf', index=0, name='Last Resort High-Efficiency', style='normal', variant='normal', weight=400, stretch='normal', size='scalable')) = 10.05
2026-07-21 14:55:57 runnervm3jd5f matplotlib.font_manager[2874] DEBUG findfont: score(FontEntry(fname='/home/runner/micromamba/envs/trajan/lib/python3.14/site-packages/matplotlib/mpl-data/fonts/ttf/cmex10.ttf', index=0, name='cmex10', style='normal', variant='normal', weight=400, stretch='normal', size='scalable')) = 10.05
2026-07-21 14:55:57 runnervm3jd5f matplotlib.font_manager[2874] DEBUG findfont: score(FontEntry(fname='/home/runner/micromamba/envs/trajan/lib/python3.14/site-packages/matplotlib/mpl-data/fonts/ttf/STIXSizFiveSymReg.ttf', index=0, name='STIXSizeFiveSym', style='normal', variant='normal', weight=400, stretch='normal', size='scalable')) = 10.05
2026-07-21 14:55:57 runnervm3jd5f matplotlib.font_manager[2874] DEBUG findfont: score(FontEntry(fname='/home/runner/micromamba/envs/trajan/lib/python3.14/site-packages/matplotlib/mpl-data/fonts/ttf/STIXNonUniBol.ttf', index=0, name='STIXNonUnicode', style='normal', variant='normal', weight=700, stretch='normal', size='scalable')) = 0.33499999999999996
2026-07-21 14:55:57 runnervm3jd5f matplotlib.font_manager[2874] DEBUG findfont: score(FontEntry(fname='/home/runner/micromamba/envs/trajan/lib/python3.14/site-packages/matplotlib/mpl-data/fonts/ttf/DejaVuSansDisplay.ttf', index=0, name='DejaVu Sans Display', style='normal', variant='normal', weight=400, stretch='normal', size='scalable')) = 10.05
2026-07-21 14:55:57 runnervm3jd5f matplotlib.font_manager[2874] DEBUG findfont: score(FontEntry(fname='/home/runner/micromamba/envs/trajan/lib/python3.14/site-packages/matplotlib/mpl-data/fonts/ttf/DejaVuSansMono.ttf', index=0, name='DejaVu Sans Mono', style='normal', variant='normal', weight=400, stretch='normal', size='scalable')) = 10.05
2026-07-21 14:55:57 runnervm3jd5f matplotlib.font_manager[2874] DEBUG findfont: score(FontEntry(fname='/home/runner/micromamba/envs/trajan/lib/python3.14/site-packages/matplotlib/mpl-data/fonts/ttf/cmb10.ttf', index=0, name='cmb10', style='normal', variant='normal', weight=400, stretch='normal', size='scalable')) = 10.05
2026-07-21 14:55:57 runnervm3jd5f matplotlib.font_manager[2874] DEBUG findfont: score(FontEntry(fname='/home/runner/micromamba/envs/trajan/lib/python3.14/site-packages/matplotlib/mpl-data/fonts/ttf/STIXSizTwoSymReg.ttf', index=0, name='STIXSizeTwoSym', style='normal', variant='normal', weight=400, stretch='normal', size='scalable')) = 10.05
2026-07-21 14:55:57 runnervm3jd5f matplotlib.font_manager[2874] DEBUG findfont: score(FontEntry(fname='/home/runner/micromamba/envs/trajan/lib/python3.14/site-packages/matplotlib/mpl-data/fonts/ttf/DejaVuSans.ttf', index=0, name='DejaVu Sans', style='normal', variant='normal', weight=400, stretch='normal', size='scalable')) = 10.05
2026-07-21 14:55:57 runnervm3jd5f matplotlib.font_manager[2874] DEBUG findfont: score(FontEntry(fname='/home/runner/micromamba/envs/trajan/lib/python3.14/site-packages/matplotlib/mpl-data/fonts/ttf/STIXNonUni.ttf', index=0, name='STIXNonUnicode', style='normal', variant='normal', weight=400, stretch='normal', size='scalable')) = 0.05
2026-07-21 14:55:57 runnervm3jd5f matplotlib.font_manager[2874] DEBUG findfont: score(FontEntry(fname='/home/runner/micromamba/envs/trajan/lib/python3.14/site-packages/matplotlib/mpl-data/fonts/ttf/STIXGeneralItalic.ttf', index=0, name='STIXGeneral', style='italic', variant='normal', weight=400, stretch='normal', size='scalable')) = 11.05
2026-07-21 14:55:57 runnervm3jd5f matplotlib.font_manager[2874] DEBUG findfont: score(FontEntry(fname='/home/runner/micromamba/envs/trajan/lib/python3.14/site-packages/matplotlib/mpl-data/fonts/ttf/STIXSizOneSymBol.ttf', index=0, name='STIXSizeOneSym', style='normal', variant='normal', weight=700, stretch='normal', size='scalable')) = 10.335
2026-07-21 14:55:57 runnervm3jd5f matplotlib.font_manager[2874] DEBUG findfont: score(FontEntry(fname='/home/runner/micromamba/envs/trajan/lib/python3.14/site-packages/matplotlib/mpl-data/fonts/ttf/DejaVuSansMono-Bold.ttf', index=0, name='DejaVu Sans Mono', style='normal', variant='normal', weight=700, stretch='normal', size='scalable')) = 10.335
2026-07-21 14:55:57 runnervm3jd5f matplotlib.font_manager[2874] DEBUG findfont: score(FontEntry(fname='/home/runner/micromamba/envs/trajan/lib/python3.14/site-packages/matplotlib/mpl-data/fonts/ttf/STIXSizTwoSymBol.ttf', index=0, name='STIXSizeTwoSym', style='normal', variant='normal', weight=700, stretch='normal', size='scalable')) = 10.335
2026-07-21 14:55:57 runnervm3jd5f matplotlib.font_manager[2874] DEBUG findfont: score(FontEntry(fname='/home/runner/micromamba/envs/trajan/lib/python3.14/site-packages/matplotlib/mpl-data/fonts/ttf/STIXSizThreeSymBol.ttf', index=0, name='STIXSizeThreeSym', style='normal', variant='normal', weight=700, stretch='normal', size='scalable')) = 10.335
2026-07-21 14:55:57 runnervm3jd5f matplotlib.font_manager[2874] DEBUG findfont: score(FontEntry(fname='/home/runner/micromamba/envs/trajan/lib/python3.14/site-packages/matplotlib/mpl-data/fonts/ttf/DejaVuSerif-BoldItalic.ttf', index=0, name='DejaVu Serif', style='italic', variant='normal', weight=700, stretch='normal', size='scalable')) = 11.335
2026-07-21 14:55:57 runnervm3jd5f matplotlib.font_manager[2874] DEBUG findfont: score(FontEntry(fname='/home/runner/micromamba/envs/trajan/lib/python3.14/site-packages/matplotlib/mpl-data/fonts/ttf/DejaVuSerif-Italic.ttf', index=0, name='DejaVu Serif', style='italic', variant='normal', weight=400, stretch='normal', size='scalable')) = 11.05
2026-07-21 14:55:57 runnervm3jd5f matplotlib.font_manager[2874] DEBUG findfont: score(FontEntry(fname='/home/runner/micromamba/envs/trajan/lib/python3.14/site-packages/matplotlib/mpl-data/fonts/ttf/DejaVuSans-Bold.ttf', index=0, name='DejaVu Sans', style='normal', variant='normal', weight=700, stretch='normal', size='scalable')) = 10.335
2026-07-21 14:55:57 runnervm3jd5f matplotlib.font_manager[2874] DEBUG findfont: score(FontEntry(fname='/home/runner/micromamba/envs/trajan/lib/python3.14/site-packages/matplotlib/mpl-data/fonts/ttf/STIXSizFourSymBol.ttf', index=0, name='STIXSizeFourSym', style='normal', variant='normal', weight=700, stretch='normal', size='scalable')) = 10.335
2026-07-21 14:55:57 runnervm3jd5f matplotlib.font_manager[2874] DEBUG findfont: score(FontEntry(fname='/home/runner/micromamba/envs/trajan/lib/python3.14/site-packages/matplotlib/mpl-data/fonts/ttf/STIXSizOneSymReg.ttf', index=0, name='STIXSizeOneSym', style='normal', variant='normal', weight=400, stretch='normal', size='scalable')) = 10.05
2026-07-21 14:55:57 runnervm3jd5f matplotlib.font_manager[2874] DEBUG findfont: score(FontEntry(fname='/home/runner/micromamba/envs/trajan/lib/python3.14/site-packages/matplotlib/mpl-data/fonts/ttf/cmr10.ttf', index=0, name='cmr10', style='normal', variant='normal', weight=400, stretch='normal', size='scalable')) = 10.05
2026-07-21 14:55:57 runnervm3jd5f matplotlib.font_manager[2874] DEBUG findfont: score(FontEntry(fname='/home/runner/micromamba/envs/trajan/lib/python3.14/site-packages/matplotlib/mpl-data/fonts/ttf/STIXGeneralBol.ttf', index=0, name='STIXGeneral', style='normal', variant='normal', weight=700, stretch='normal', size='scalable')) = 10.335
2026-07-21 14:55:57 runnervm3jd5f matplotlib.font_manager[2874] DEBUG findfont: score(FontEntry(fname='/home/runner/micromamba/envs/trajan/lib/python3.14/site-packages/matplotlib/mpl-data/fonts/ttf/DejaVuSans-BoldOblique.ttf', index=0, name='DejaVu Sans', style='oblique', variant='normal', weight=700, stretch='normal', size='scalable')) = 11.335
2026-07-21 14:55:57 runnervm3jd5f matplotlib.font_manager[2874] DEBUG findfont: score(FontEntry(fname='/home/runner/micromamba/envs/trajan/lib/python3.14/site-packages/matplotlib/mpl-data/fonts/ttf/STIXSizFourSymReg.ttf', index=0, name='STIXSizeFourSym', style='normal', variant='normal', weight=400, stretch='normal', size='scalable')) = 10.05
2026-07-21 14:55:57 runnervm3jd5f matplotlib.font_manager[2874] DEBUG findfont: score(FontEntry(fname='/usr/share/fonts/truetype/lato/Lato-Black.ttf', index=0, name='Lato', style='normal', variant='normal', weight=900, stretch='normal', size='scalable')) = 10.525
2026-07-21 14:55:57 runnervm3jd5f matplotlib.font_manager[2874] DEBUG findfont: score(FontEntry(fname='/usr/share/fonts/truetype/lato/Lato-Black.ttf', index=0, name='Lato Black', style='normal', variant='normal', weight=400, stretch='normal', size='scalable')) = 10.05
2026-07-21 14:55:57 runnervm3jd5f matplotlib.font_manager[2874] DEBUG findfont: score(FontEntry(fname='/usr/share/fonts/truetype/liberation/LiberationSerif-Regular.ttf', index=0, name='Liberation Serif', style='normal', variant='normal', weight=400, stretch='normal', size='scalable')) = 10.05
2026-07-21 14:55:57 runnervm3jd5f matplotlib.font_manager[2874] DEBUG findfont: score(FontEntry(fname='/usr/share/fonts/truetype/dejavu/DejaVuSerifCondensed.ttf', index=0, name='DejaVu Serif', style='normal', variant='normal', weight=400, stretch='condensed', size='scalable')) = 10.25
2026-07-21 14:55:57 runnervm3jd5f matplotlib.font_manager[2874] DEBUG findfont: score(FontEntry(fname='/usr/share/fonts/truetype/dejavu/DejaVuSerifCondensed.ttf', index=0, name='DejaVu Serif Condensed', style='normal', variant='normal', weight=380, stretch='condensed', size='scalable')) = 10.269
2026-07-21 14:55:57 runnervm3jd5f matplotlib.font_manager[2874] DEBUG findfont: score(FontEntry(fname='/home/runner/micromamba/envs/trajan/fonts/UbuntuMono-BI.ttf', index=0, name='Ubuntu Mono', style='italic', variant='normal', weight=700, stretch='normal', size='scalable')) = 11.335
2026-07-21 14:55:57 runnervm3jd5f matplotlib.font_manager[2874] DEBUG findfont: score(FontEntry(fname='/usr/share/fonts/truetype/dejavu/DejaVuSans.ttf', index=0, name='DejaVu Sans', style='normal', variant='normal', weight=400, stretch='normal', size='scalable')) = 10.05
2026-07-21 14:55:57 runnervm3jd5f matplotlib.font_manager[2874] DEBUG findfont: score(FontEntry(fname='/usr/share/fonts/truetype/lato/Lato-Italic.ttf', index=0, name='Lato', style='italic', variant='normal', weight=400, stretch='normal', size='scalable')) = 11.05
2026-07-21 14:55:57 runnervm3jd5f matplotlib.font_manager[2874] DEBUG findfont: score(FontEntry(fname='/usr/share/fonts/truetype/liberation/LiberationSans-Italic.ttf', index=0, name='Liberation Sans', style='italic', variant='normal', weight=400, stretch='normal', size='scalable')) = 11.05
2026-07-21 14:55:57 runnervm3jd5f matplotlib.font_manager[2874] DEBUG findfont: score(FontEntry(fname='/home/runner/micromamba/envs/trajan/fonts/Ubuntu-B.ttf', index=0, name='Ubuntu', style='normal', variant='normal', weight=700, stretch='normal', size='scalable')) = 10.335
2026-07-21 14:55:57 runnervm3jd5f matplotlib.font_manager[2874] DEBUG findfont: score(FontEntry(fname='/home/runner/micromamba/envs/trajan/fonts/SourceCodePro-Semibold.ttf', index=0, name='Source Code Pro', style='normal', variant='normal', weight=600, stretch='normal', size='scalable')) = 10.24
2026-07-21 14:55:57 runnervm3jd5f matplotlib.font_manager[2874] DEBUG findfont: score(FontEntry(fname='/home/runner/micromamba/envs/trajan/fonts/SourceCodePro-Semibold.ttf', index=0, name='Source Code Pro Semibold', style='normal', variant='normal', weight=400, stretch='normal', size='scalable')) = 10.05
2026-07-21 14:55:57 runnervm3jd5f matplotlib.font_manager[2874] DEBUG findfont: score(FontEntry(fname='/home/runner/micromamba/envs/trajan/fonts/SourceCodePro-Bold.ttf', index=0, name='Source Code Pro', style='normal', variant='normal', weight=700, stretch='normal', size='scalable')) = 10.335
2026-07-21 14:55:57 runnervm3jd5f matplotlib.font_manager[2874] DEBUG findfont: score(FontEntry(fname='/home/runner/micromamba/envs/trajan/fonts/Ubuntu-MI.ttf', index=0, name='Ubuntu', style='italic', variant='normal', weight=500, stretch='normal', size='scalable')) = 11.145
2026-07-21 14:55:57 runnervm3jd5f matplotlib.font_manager[2874] DEBUG findfont: score(FontEntry(fname='/home/runner/micromamba/envs/trajan/fonts/Ubuntu-MI.ttf', index=0, name='Ubuntu Light', style='italic', variant='normal', weight=700, stretch='normal', size='scalable')) = 11.335
2026-07-21 14:55:57 runnervm3jd5f matplotlib.font_manager[2874] DEBUG findfont: score(FontEntry(fname='/usr/share/fonts/truetype/lato/Lato-Regular.ttf', index=0, name='Lato', style='normal', variant='normal', weight=400, stretch='normal', size='scalable')) = 10.05
2026-07-21 14:55:57 runnervm3jd5f matplotlib.font_manager[2874] DEBUG findfont: score(FontEntry(fname='/usr/share/fonts/truetype/lato/Lato-ThinItalic.ttf', index=0, name='Lato', style='italic', variant='normal', weight=275, stretch='normal', size='scalable')) = 11.16875
2026-07-21 14:55:57 runnervm3jd5f matplotlib.font_manager[2874] DEBUG findfont: score(FontEntry(fname='/usr/share/fonts/truetype/lato/Lato-ThinItalic.ttf', index=0, name='Lato Thin', style='italic', variant='normal', weight=400, stretch='normal', size='scalable')) = 11.05
2026-07-21 14:55:57 runnervm3jd5f matplotlib.font_manager[2874] DEBUG findfont: score(FontEntry(fname='/usr/share/fonts/truetype/lato/Lato-BlackItalic.ttf', index=0, name='Lato', style='italic', variant='normal', weight=900, stretch='normal', size='scalable')) = 11.525
2026-07-21 14:55:57 runnervm3jd5f matplotlib.font_manager[2874] DEBUG findfont: score(FontEntry(fname='/usr/share/fonts/truetype/lato/Lato-BlackItalic.ttf', index=0, name='Lato Black', style='italic', variant='normal', weight=400, stretch='normal', size='scalable')) = 11.05
2026-07-21 14:55:57 runnervm3jd5f matplotlib.font_manager[2874] DEBUG findfont: score(FontEntry(fname='/usr/share/fonts/truetype/dejavu/DejaVuSerifCondensed-Italic.ttf', index=0, name='DejaVu Serif', style='italic', variant='normal', weight=400, stretch='condensed', size='scalable')) = 11.25
2026-07-21 14:55:57 runnervm3jd5f matplotlib.font_manager[2874] DEBUG findfont: score(FontEntry(fname='/usr/share/fonts/truetype/dejavu/DejaVuSerifCondensed-Italic.ttf', index=0, name='DejaVu Serif Condensed', style='italic', variant='normal', weight=400, stretch='condensed', size='scalable')) = 11.25
2026-07-21 14:55:57 runnervm3jd5f matplotlib.font_manager[2874] DEBUG findfont: score(FontEntry(fname='/usr/share/fonts/truetype/dejavu/DejaVuSans-Bold.ttf', index=0, name='DejaVu Sans', style='normal', variant='normal', weight=700, stretch='normal', size='scalable')) = 10.335
2026-07-21 14:55:57 runnervm3jd5f matplotlib.font_manager[2874] DEBUG findfont: score(FontEntry(fname='/home/runner/micromamba/envs/trajan/fonts/UbuntuMono-R.ttf', index=0, name='Ubuntu Mono', style='normal', variant='normal', weight=400, stretch='normal', size='scalable')) = 10.05
2026-07-21 14:55:57 runnervm3jd5f matplotlib.font_manager[2874] DEBUG findfont: score(FontEntry(fname='/usr/share/fonts/truetype/dejavu/DejaVuSerif-BoldItalic.ttf', index=0, name='DejaVu Serif', style='italic', variant='normal', weight=700, stretch='normal', size='scalable')) = 11.335
2026-07-21 14:55:57 runnervm3jd5f matplotlib.font_manager[2874] DEBUG findfont: score(FontEntry(fname='/usr/share/fonts/truetype/lato/Lato-Hairline.ttf', index=0, name='Lato', style='normal', variant='normal', weight=250, stretch='normal', size='scalable')) = 10.1925
2026-07-21 14:55:57 runnervm3jd5f matplotlib.font_manager[2874] DEBUG findfont: score(FontEntry(fname='/usr/share/fonts/truetype/lato/Lato-Hairline.ttf', index=0, name='Lato Hairline', style='normal', variant='normal', weight=400, stretch='normal', size='scalable')) = 10.05
2026-07-21 14:55:57 runnervm3jd5f matplotlib.font_manager[2874] DEBUG findfont: score(FontEntry(fname='/usr/share/fonts/truetype/lato/Lato-LightItalic.ttf', index=0, name='Lato', style='italic', variant='normal', weight=300, stretch='normal', size='scalable')) = 11.145
2026-07-21 14:55:57 runnervm3jd5f matplotlib.font_manager[2874] DEBUG findfont: score(FontEntry(fname='/usr/share/fonts/truetype/lato/Lato-LightItalic.ttf', index=0, name='Lato Light', style='italic', variant='normal', weight=400, stretch='normal', size='scalable')) = 11.05
2026-07-21 14:55:57 runnervm3jd5f matplotlib.font_manager[2874] DEBUG findfont: score(FontEntry(fname='/usr/share/fonts/truetype/dejavu/DejaVuSansCondensed-BoldOblique.ttf', index=0, name='DejaVu Sans', style='oblique', variant='normal', weight=700, stretch='condensed', size='scalable')) = 11.535
2026-07-21 14:55:57 runnervm3jd5f matplotlib.font_manager[2874] DEBUG findfont: score(FontEntry(fname='/usr/share/fonts/truetype/dejavu/DejaVuSansCondensed-BoldOblique.ttf', index=0, name='DejaVu Sans Condensed', style='oblique', variant='normal', weight=700, stretch='condensed', size='scalable')) = 11.535
2026-07-21 14:55:57 runnervm3jd5f matplotlib.font_manager[2874] DEBUG findfont: score(FontEntry(fname='/home/runner/micromamba/envs/trajan/fonts/SourceCodePro-It.ttf', index=0, name='Source Code Pro', style='italic', variant='normal', weight=400, stretch='normal', size='scalable')) = 11.05
2026-07-21 14:55:57 runnervm3jd5f matplotlib.font_manager[2874] DEBUG findfont: score(FontEntry(fname='/home/runner/micromamba/envs/trajan/fonts/SourceCodePro-ExtraLightIt.ttf', index=0, name='Source Code Pro', style='italic', variant='normal', weight=200, stretch='normal', size='scalable')) = 11.24
2026-07-21 14:55:57 runnervm3jd5f matplotlib.font_manager[2874] DEBUG findfont: score(FontEntry(fname='/home/runner/micromamba/envs/trajan/fonts/SourceCodePro-ExtraLightIt.ttf', index=0, name='Source Code Pro ExtraLight', style='italic', variant='normal', weight=400, stretch='normal', size='scalable')) = 11.05
2026-07-21 14:55:57 runnervm3jd5f matplotlib.font_manager[2874] DEBUG findfont: score(FontEntry(fname='/usr/share/fonts/truetype/lato/Lato-Medium.ttf', index=0, name='Lato', style='normal', variant='normal', weight=500, stretch='normal', size='scalable')) = 10.145
2026-07-21 14:55:57 runnervm3jd5f matplotlib.font_manager[2874] DEBUG findfont: score(FontEntry(fname='/usr/share/fonts/truetype/lato/Lato-Medium.ttf', index=0, name='Lato Medium', style='normal', variant='normal', weight=400, stretch='normal', size='scalable')) = 10.05
2026-07-21 14:55:57 runnervm3jd5f matplotlib.font_manager[2874] DEBUG findfont: score(FontEntry(fname='/usr/share/fonts/truetype/lato/Lato-BoldItalic.ttf', index=0, name='Lato', style='italic', variant='normal', weight=700, stretch='normal', size='scalable')) = 11.335
2026-07-21 14:55:57 runnervm3jd5f matplotlib.font_manager[2874] DEBUG findfont: score(FontEntry(fname='/home/runner/micromamba/envs/trajan/fonts/DejaVuSans.ttf', index=0, name='DejaVu Sans', style='normal', variant='normal', weight=400, stretch='normal', size='scalable')) = 10.05
2026-07-21 14:55:57 runnervm3jd5f matplotlib.font_manager[2874] DEBUG findfont: score(FontEntry(fname='/home/runner/micromamba/envs/trajan/fonts/UbuntuMono-B.ttf', index=0, name='Ubuntu Mono', style='normal', variant='normal', weight=700, stretch='normal', size='scalable')) = 10.335
2026-07-21 14:55:57 runnervm3jd5f matplotlib.font_manager[2874] DEBUG findfont: score(FontEntry(fname='/home/runner/micromamba/envs/trajan/fonts/SourceCodePro-LightIt.ttf', index=0, name='Source Code Pro', style='italic', variant='normal', weight=300, stretch='normal', size='scalable')) = 11.145
2026-07-21 14:55:57 runnervm3jd5f matplotlib.font_manager[2874] DEBUG findfont: score(FontEntry(fname='/home/runner/micromamba/envs/trajan/fonts/SourceCodePro-LightIt.ttf', index=0, name='Source Code Pro Light', style='italic', variant='normal', weight=400, stretch='normal', size='scalable')) = 11.05
2026-07-21 14:55:57 runnervm3jd5f matplotlib.font_manager[2874] DEBUG findfont: score(FontEntry(fname='/usr/share/fonts/truetype/liberation/LiberationSans-BoldItalic.ttf', index=0, name='Liberation Sans', style='italic', variant='normal', weight=700, stretch='normal', size='scalable')) = 11.335
2026-07-21 14:55:57 runnervm3jd5f matplotlib.font_manager[2874] DEBUG findfont: score(FontEntry(fname='/usr/share/fonts/truetype/liberation/LiberationSans-Regular.ttf', index=0, name='Liberation Sans', style='normal', variant='normal', weight=400, stretch='normal', size='scalable')) = 10.05
2026-07-21 14:55:57 runnervm3jd5f matplotlib.font_manager[2874] DEBUG findfont: score(FontEntry(fname='/usr/share/fonts/truetype/dejavu/DejaVuSansMono-Bold.ttf', index=0, name='DejaVu Sans Mono', style='normal', variant='normal', weight=700, stretch='normal', size='scalable')) = 10.335
2026-07-21 14:55:57 runnervm3jd5f matplotlib.font_manager[2874] DEBUG findfont: score(FontEntry(fname='/home/runner/micromamba/envs/trajan/fonts/SourceCodePro-BoldIt.ttf', index=0, name='Source Code Pro', style='italic', variant='normal', weight=700, stretch='normal', size='scalable')) = 11.335
2026-07-21 14:55:57 runnervm3jd5f matplotlib.font_manager[2874] DEBUG findfont: score(FontEntry(fname='/usr/share/fonts/truetype/lato/Lato-Bold.ttf', index=0, name='Lato', style='normal', variant='normal', weight=700, stretch='normal', size='scalable')) = 10.335
2026-07-21 14:55:57 runnervm3jd5f matplotlib.font_manager[2874] DEBUG findfont: score(FontEntry(fname='/usr/share/fonts/truetype/dejavu/DejaVuSansCondensed.ttf', index=0, name='DejaVu Sans', style='normal', variant='normal', weight=400, stretch='condensed', size='scalable')) = 10.25
2026-07-21 14:55:57 runnervm3jd5f matplotlib.font_manager[2874] DEBUG findfont: score(FontEntry(fname='/usr/share/fonts/truetype/dejavu/DejaVuSansCondensed.ttf', index=0, name='DejaVu Sans Condensed', style='normal', variant='normal', weight=380, stretch='condensed', size='scalable')) = 10.269
2026-07-21 14:55:57 runnervm3jd5f matplotlib.font_manager[2874] DEBUG findfont: score(FontEntry(fname='/usr/share/fonts/truetype/lato/Lato-MediumItalic.ttf', index=0, name='Lato', style='italic', variant='normal', weight=500, stretch='normal', size='scalable')) = 11.145
2026-07-21 14:55:57 runnervm3jd5f matplotlib.font_manager[2874] DEBUG findfont: score(FontEntry(fname='/usr/share/fonts/truetype/lato/Lato-MediumItalic.ttf', index=0, name='Lato Medium', style='italic', variant='normal', weight=400, stretch='normal', size='scalable')) = 11.05
2026-07-21 14:55:57 runnervm3jd5f matplotlib.font_manager[2874] DEBUG findfont: score(FontEntry(fname='/usr/share/fonts/truetype/liberation/LiberationSans-Bold.ttf', index=0, name='Liberation Sans', style='normal', variant='normal', weight=700, stretch='normal', size='scalable')) = 10.335
2026-07-21 14:55:57 runnervm3jd5f matplotlib.font_manager[2874] DEBUG findfont: score(FontEntry(fname='/usr/share/fonts/truetype/dejavu/DejaVuSerifCondensed-BoldItalic.ttf', index=0, name='DejaVu Serif', style='italic', variant='normal', weight=700, stretch='condensed', size='scalable')) = 11.535
2026-07-21 14:55:57 runnervm3jd5f matplotlib.font_manager[2874] DEBUG findfont: score(FontEntry(fname='/usr/share/fonts/truetype/dejavu/DejaVuSerifCondensed-BoldItalic.ttf', index=0, name='DejaVu Serif Condensed', style='italic', variant='normal', weight=700, stretch='condensed', size='scalable')) = 11.535
2026-07-21 14:55:57 runnervm3jd5f matplotlib.font_manager[2874] DEBUG findfont: score(FontEntry(fname='/home/runner/micromamba/envs/trajan/fonts/Ubuntu-R.ttf', index=0, name='Ubuntu', style='normal', variant='normal', weight=400, stretch='normal', size='scalable')) = 10.05
2026-07-21 14:55:57 runnervm3jd5f matplotlib.font_manager[2874] DEBUG findfont: score(FontEntry(fname='/usr/share/fonts/truetype/lato/Lato-Light.ttf', index=0, name='Lato', style='normal', variant='normal', weight=300, stretch='normal', size='scalable')) = 10.145
2026-07-21 14:55:57 runnervm3jd5f matplotlib.font_manager[2874] DEBUG findfont: score(FontEntry(fname='/usr/share/fonts/truetype/lato/Lato-Light.ttf', index=0, name='Lato Light', style='normal', variant='normal', weight=400, stretch='normal', size='scalable')) = 10.05
2026-07-21 14:55:57 runnervm3jd5f matplotlib.font_manager[2874] DEBUG findfont: score(FontEntry(fname='/usr/share/fonts/truetype/liberation/LiberationSerif-BoldItalic.ttf', index=0, name='Liberation Serif', style='italic', variant='normal', weight=700, stretch='normal', size='scalable')) = 11.335
2026-07-21 14:55:57 runnervm3jd5f matplotlib.font_manager[2874] DEBUG findfont: score(FontEntry(fname='/home/runner/micromamba/envs/trajan/fonts/Ubuntu-Th.ttf', index=0, name='Ubuntu', style='normal', variant='normal', weight=250, stretch='normal', size='scalable')) = 10.1925
2026-07-21 14:55:57 runnervm3jd5f matplotlib.font_manager[2874] DEBUG findfont: score(FontEntry(fname='/home/runner/micromamba/envs/trajan/fonts/Ubuntu-Th.ttf', index=0, name='Ubuntu Thin', style='normal', variant='normal', weight=400, stretch='normal', size='scalable')) = 10.05
2026-07-21 14:55:57 runnervm3jd5f matplotlib.font_manager[2874] DEBUG findfont: score(FontEntry(fname='/home/runner/micromamba/envs/trajan/fonts/SourceCodePro-ExtraLight.ttf', index=0, name='Source Code Pro', style='normal', variant='normal', weight=200, stretch='normal', size='scalable')) = 10.24
2026-07-21 14:55:57 runnervm3jd5f matplotlib.font_manager[2874] DEBUG findfont: score(FontEntry(fname='/home/runner/micromamba/envs/trajan/fonts/SourceCodePro-ExtraLight.ttf', index=0, name='Source Code Pro ExtraLight', style='normal', variant='normal', weight=400, stretch='normal', size='scalable')) = 10.05
2026-07-21 14:55:57 runnervm3jd5f matplotlib.font_manager[2874] DEBUG findfont: score(FontEntry(fname='/usr/share/fonts/truetype/lato/Lato-Thin.ttf', index=0, name='Lato', style='normal', variant='normal', weight=275, stretch='normal', size='scalable')) = 10.16875
2026-07-21 14:55:57 runnervm3jd5f matplotlib.font_manager[2874] DEBUG findfont: score(FontEntry(fname='/usr/share/fonts/truetype/lato/Lato-Thin.ttf', index=0, name='Lato Thin', style='normal', variant='normal', weight=400, stretch='normal', size='scalable')) = 10.05
2026-07-21 14:55:57 runnervm3jd5f matplotlib.font_manager[2874] DEBUG findfont: score(FontEntry(fname='/usr/share/fonts/truetype/liberation/LiberationSerif-Bold.ttf', index=0, name='Liberation Serif', style='normal', variant='normal', weight=700, stretch='normal', size='scalable')) = 10.335
2026-07-21 14:55:57 runnervm3jd5f matplotlib.font_manager[2874] DEBUG findfont: score(FontEntry(fname='/home/runner/micromamba/envs/trajan/fonts/Inconsolata-Regular.ttf', index=0, name='Inconsolata', style='normal', variant='normal', weight=400, stretch='normal', size='scalable')) = 10.05
2026-07-21 14:55:57 runnervm3jd5f matplotlib.font_manager[2874] DEBUG findfont: score(FontEntry(fname='/home/runner/micromamba/envs/trajan/fonts/Ubuntu-C.ttf', index=0, name='Ubuntu Condensed', style='normal', variant='normal', weight=400, stretch='condensed', size='scalable')) = 10.25
2026-07-21 14:55:57 runnervm3jd5f matplotlib.font_manager[2874] DEBUG findfont: score(FontEntry(fname='/usr/share/fonts/truetype/dejavu/DejaVuSansCondensed-Bold.ttf', index=0, name='DejaVu Sans', style='normal', variant='normal', weight=700, stretch='condensed', size='scalable')) = 10.535
2026-07-21 14:55:57 runnervm3jd5f matplotlib.font_manager[2874] DEBUG findfont: score(FontEntry(fname='/usr/share/fonts/truetype/dejavu/DejaVuSansCondensed-Bold.ttf', index=0, name='DejaVu Sans Condensed', style='normal', variant='normal', weight=700, stretch='condensed', size='scalable')) = 10.535
2026-07-21 14:55:57 runnervm3jd5f matplotlib.font_manager[2874] DEBUG findfont: score(FontEntry(fname='/usr/share/fonts/truetype/liberation/LiberationMono-Bold.ttf', index=0, name='Liberation Mono', style='normal', variant='normal', weight=700, stretch='normal', size='scalable')) = 10.335
2026-07-21 14:55:57 runnervm3jd5f matplotlib.font_manager[2874] DEBUG findfont: score(FontEntry(fname='/home/runner/micromamba/envs/trajan/fonts/SourceCodePro-Black.ttf', index=0, name='Source Code Pro', style='normal', variant='normal', weight=900, stretch='normal', size='scalable')) = 10.525
2026-07-21 14:55:57 runnervm3jd5f matplotlib.font_manager[2874] DEBUG findfont: score(FontEntry(fname='/home/runner/micromamba/envs/trajan/fonts/SourceCodePro-Black.ttf', index=0, name='Source Code Pro Black', style='normal', variant='normal', weight=400, stretch='normal', size='scalable')) = 10.05
2026-07-21 14:55:57 runnervm3jd5f matplotlib.font_manager[2874] DEBUG findfont: score(FontEntry(fname='/home/runner/micromamba/envs/trajan/fonts/SourceCodePro-BlackIt.ttf', index=0, name='Source Code Pro', style='italic', variant='normal', weight=900, stretch='normal', size='scalable')) = 11.525
2026-07-21 14:55:57 runnervm3jd5f matplotlib.font_manager[2874] DEBUG findfont: score(FontEntry(fname='/home/runner/micromamba/envs/trajan/fonts/SourceCodePro-BlackIt.ttf', index=0, name='Source Code Pro Black', style='italic', variant='normal', weight=400, stretch='normal', size='scalable')) = 11.05
2026-07-21 14:55:57 runnervm3jd5f matplotlib.font_manager[2874] DEBUG findfont: score(FontEntry(fname='/home/runner/micromamba/envs/trajan/fonts/Ubuntu-LI.ttf', index=0, name='Ubuntu', style='italic', variant='normal', weight=300, stretch='normal', size='scalable')) = 11.145
2026-07-21 14:55:57 runnervm3jd5f matplotlib.font_manager[2874] DEBUG findfont: score(FontEntry(fname='/home/runner/micromamba/envs/trajan/fonts/Ubuntu-LI.ttf', index=0, name='Ubuntu Light', style='italic', variant='normal', weight=400, stretch='normal', size='scalable')) = 11.05
2026-07-21 14:55:57 runnervm3jd5f matplotlib.font_manager[2874] DEBUG findfont: score(FontEntry(fname='/usr/share/fonts/truetype/liberation/LiberationMono-Regular.ttf', index=0, name='Liberation Mono', style='normal', variant='normal', weight=400, stretch='normal', size='scalable')) = 10.05
2026-07-21 14:55:57 runnervm3jd5f matplotlib.font_manager[2874] DEBUG findfont: score(FontEntry(fname='/home/runner/micromamba/envs/trajan/fonts/UbuntuMono-RI.ttf', index=0, name='Ubuntu Mono', style='italic', variant='normal', weight=400, stretch='normal', size='scalable')) = 11.05
2026-07-21 14:55:57 runnervm3jd5f matplotlib.font_manager[2874] DEBUG findfont: score(FontEntry(fname='/usr/share/fonts/truetype/lato/Lato-Heavy.ttf', index=0, name='Lato', style='normal', variant='normal', weight=800, stretch='normal', size='scalable')) = 10.43
2026-07-21 14:55:57 runnervm3jd5f matplotlib.font_manager[2874] DEBUG findfont: score(FontEntry(fname='/usr/share/fonts/truetype/lato/Lato-Heavy.ttf', index=0, name='Lato Heavy', style='normal', variant='normal', weight=400, stretch='normal', size='scalable')) = 10.05
2026-07-21 14:55:57 runnervm3jd5f matplotlib.font_manager[2874] DEBUG findfont: score(FontEntry(fname='/usr/share/fonts/truetype/lato/Lato-HairlineItalic.ttf', index=0, name='Lato', style='italic', variant='normal', weight=250, stretch='normal', size='scalable')) = 11.1925
2026-07-21 14:55:57 runnervm3jd5f matplotlib.font_manager[2874] DEBUG findfont: score(FontEntry(fname='/usr/share/fonts/truetype/lato/Lato-HairlineItalic.ttf', index=0, name='Lato Hairline', style='italic', variant='normal', weight=400, stretch='normal', size='scalable')) = 11.05
2026-07-21 14:55:57 runnervm3jd5f matplotlib.font_manager[2874] DEBUG findfont: score(FontEntry(fname='/usr/share/fonts/truetype/dejavu/DejaVuSerifCondensed-Bold.ttf', index=0, name='DejaVu Serif', style='normal', variant='normal', weight=700, stretch='condensed', size='scalable')) = 10.535
2026-07-21 14:55:57 runnervm3jd5f matplotlib.font_manager[2874] DEBUG findfont: score(FontEntry(fname='/usr/share/fonts/truetype/dejavu/DejaVuSerifCondensed-Bold.ttf', index=0, name='DejaVu Serif Condensed', style='normal', variant='normal', weight=700, stretch='condensed', size='scalable')) = 10.535
2026-07-21 14:55:57 runnervm3jd5f matplotlib.font_manager[2874] DEBUG findfont: score(FontEntry(fname='/usr/share/fonts/truetype/dejavu/DejaVuSansCondensed-Oblique.ttf', index=0, name='DejaVu Sans', style='oblique', variant='normal', weight=400, stretch='condensed', size='scalable')) = 11.25
2026-07-21 14:55:57 runnervm3jd5f matplotlib.font_manager[2874] DEBUG findfont: score(FontEntry(fname='/usr/share/fonts/truetype/dejavu/DejaVuSansCondensed-Oblique.ttf', index=0, name='DejaVu Sans Condensed', style='oblique', variant='normal', weight=400, stretch='condensed', size='scalable')) = 11.25
2026-07-21 14:55:57 runnervm3jd5f matplotlib.font_manager[2874] DEBUG findfont: score(FontEntry(fname='/usr/share/fonts/truetype/lato/Lato-SemiboldItalic.ttf', index=0, name='Lato', style='italic', variant='normal', weight=600, stretch='normal', size='scalable')) = 11.24
2026-07-21 14:55:57 runnervm3jd5f matplotlib.font_manager[2874] DEBUG findfont: score(FontEntry(fname='/usr/share/fonts/truetype/lato/Lato-SemiboldItalic.ttf', index=0, name='Lato Semibold', style='italic', variant='normal', weight=400, stretch='normal', size='scalable')) = 11.05
2026-07-21 14:55:57 runnervm3jd5f matplotlib.font_manager[2874] DEBUG findfont: score(FontEntry(fname='/usr/share/fonts/truetype/lato/Lato-Semibold.ttf', index=0, name='Lato', style='normal', variant='normal', weight=600, stretch='normal', size='scalable')) = 10.24
2026-07-21 14:55:57 runnervm3jd5f matplotlib.font_manager[2874] DEBUG findfont: score(FontEntry(fname='/usr/share/fonts/truetype/lato/Lato-Semibold.ttf', index=0, name='Lato Semibold', style='normal', variant='normal', weight=400, stretch='normal', size='scalable')) = 10.05
2026-07-21 14:55:57 runnervm3jd5f matplotlib.font_manager[2874] DEBUG findfont: score(FontEntry(fname='/home/runner/micromamba/envs/trajan/fonts/Inconsolata-Bold.ttf', index=0, name='Inconsolata', style='normal', variant='normal', weight=700, stretch='normal', size='scalable')) = 10.335
2026-07-21 14:55:57 runnervm3jd5f matplotlib.font_manager[2874] DEBUG findfont: score(FontEntry(fname='/usr/share/fonts/truetype/dejavu/DejaVuSans-ExtraLight.ttf', index=0, name='DejaVu Sans', style='normal', variant='normal', weight=200, stretch='normal', size='scalable')) = 10.24
2026-07-21 14:55:57 runnervm3jd5f matplotlib.font_manager[2874] DEBUG findfont: score(FontEntry(fname='/usr/share/fonts/truetype/dejavu/DejaVuSans-ExtraLight.ttf', index=0, name='DejaVu Sans Light', style='normal', variant='normal', weight=200, stretch='normal', size='scalable')) = 10.24
2026-07-21 14:55:57 runnervm3jd5f matplotlib.font_manager[2874] DEBUG findfont: score(FontEntry(fname='/home/runner/micromamba/envs/trajan/fonts/Ubuntu-BI.ttf', index=0, name='Ubuntu', style='italic', variant='normal', weight=700, stretch='normal', size='scalable')) = 11.335
2026-07-21 14:55:57 runnervm3jd5f matplotlib.font_manager[2874] DEBUG findfont: score(FontEntry(fname='/usr/share/fonts/truetype/dejavu/DejaVuSans-BoldOblique.ttf', index=0, name='DejaVu Sans', style='oblique', variant='normal', weight=700, stretch='normal', size='scalable')) = 11.335
2026-07-21 14:55:57 runnervm3jd5f matplotlib.font_manager[2874] DEBUG findfont: score(FontEntry(fname='/home/runner/micromamba/envs/trajan/fonts/Ubuntu-RI.ttf', index=0, name='Ubuntu', style='italic', variant='normal', weight=400, stretch='normal', size='scalable')) = 11.05
2026-07-21 14:55:57 runnervm3jd5f matplotlib.font_manager[2874] DEBUG findfont: score(FontEntry(fname='/usr/share/fonts/truetype/dejavu/DejaVuSerif-Italic.ttf', index=0, name='DejaVu Serif', style='italic', variant='normal', weight=400, stretch='normal', size='scalable')) = 11.05
2026-07-21 14:55:57 runnervm3jd5f matplotlib.font_manager[2874] DEBUG findfont: score(FontEntry(fname='/home/runner/micromamba/envs/trajan/fonts/SourceCodePro-Medium.ttf', index=0, name='Source Code Pro', style='normal', variant='normal', weight=500, stretch='normal', size='scalable')) = 10.145
2026-07-21 14:55:57 runnervm3jd5f matplotlib.font_manager[2874] DEBUG findfont: score(FontEntry(fname='/home/runner/micromamba/envs/trajan/fonts/SourceCodePro-Medium.ttf', index=0, name='Source Code Pro Medium', style='normal', variant='normal', weight=400, stretch='normal', size='scalable')) = 10.05
2026-07-21 14:55:57 runnervm3jd5f matplotlib.font_manager[2874] DEBUG findfont: score(FontEntry(fname='/usr/share/fonts/truetype/lato/Lato-HeavyItalic.ttf', index=0, name='Lato', style='italic', variant='normal', weight=800, stretch='normal', size='scalable')) = 11.43
2026-07-21 14:55:57 runnervm3jd5f matplotlib.font_manager[2874] DEBUG findfont: score(FontEntry(fname='/usr/share/fonts/truetype/lato/Lato-HeavyItalic.ttf', index=0, name='Lato Heavy', style='italic', variant='normal', weight=400, stretch='normal', size='scalable')) = 11.05
2026-07-21 14:55:57 runnervm3jd5f matplotlib.font_manager[2874] DEBUG findfont: score(FontEntry(fname='/usr/share/fonts/truetype/dejavu/DejaVuSans-Oblique.ttf', index=0, name='DejaVu Sans', style='oblique', variant='normal', weight=400, stretch='normal', size='scalable')) = 11.05
2026-07-21 14:55:57 runnervm3jd5f matplotlib.font_manager[2874] DEBUG findfont: score(FontEntry(fname='/home/runner/micromamba/envs/trajan/fonts/Ubuntu-M.ttf', index=0, name='Ubuntu', style='normal', variant='normal', weight=500, stretch='normal', size='scalable')) = 10.145
2026-07-21 14:55:57 runnervm3jd5f matplotlib.font_manager[2874] DEBUG findfont: score(FontEntry(fname='/home/runner/micromamba/envs/trajan/fonts/Ubuntu-M.ttf', index=0, name='Ubuntu Light', style='normal', variant='normal', weight=700, stretch='normal', size='scalable')) = 10.335
2026-07-21 14:55:57 runnervm3jd5f matplotlib.font_manager[2874] DEBUG findfont: score(FontEntry(fname='/usr/share/fonts/truetype/liberation/LiberationMono-BoldItalic.ttf', index=0, name='Liberation Mono', style='italic', variant='normal', weight=700, stretch='normal', size='scalable')) = 11.335
2026-07-21 14:55:57 runnervm3jd5f matplotlib.font_manager[2874] DEBUG findfont: score(FontEntry(fname='/usr/share/fonts/truetype/dejavu/DejaVuSansMono.ttf', index=0, name='DejaVu Sans Mono', style='normal', variant='normal', weight=400, stretch='normal', size='scalable')) = 10.05
2026-07-21 14:55:57 runnervm3jd5f matplotlib.font_manager[2874] DEBUG findfont: score(FontEntry(fname='/usr/share/fonts/truetype/dejavu/DejaVuMathTeXGyre.ttf', index=0, name='DejaVu Math TeX Gyre', style='normal', variant='normal', weight=400, stretch='normal', size='scalable')) = 10.05
2026-07-21 14:55:57 runnervm3jd5f matplotlib.font_manager[2874] DEBUG findfont: score(FontEntry(fname='/usr/share/fonts/truetype/dejavu/DejaVuSansMono-Oblique.ttf', index=0, name='DejaVu Sans Mono', style='oblique', variant='normal', weight=400, stretch='normal', size='scalable')) = 11.05
2026-07-21 14:55:57 runnervm3jd5f matplotlib.font_manager[2874] DEBUG findfont: score(FontEntry(fname='/home/runner/micromamba/envs/trajan/fonts/Ubuntu-L.ttf', index=0, name='Ubuntu', style='normal', variant='normal', weight=300, stretch='normal', size='scalable')) = 10.145
2026-07-21 14:55:57 runnervm3jd5f matplotlib.font_manager[2874] DEBUG findfont: score(FontEntry(fname='/home/runner/micromamba/envs/trajan/fonts/Ubuntu-L.ttf', index=0, name='Ubuntu Light', style='normal', variant='normal', weight=400, stretch='normal', size='scalable')) = 10.05
2026-07-21 14:55:57 runnervm3jd5f matplotlib.font_manager[2874] DEBUG findfont: score(FontEntry(fname='/home/runner/micromamba/envs/trajan/fonts/SourceCodePro-MediumIt.ttf', index=0, name='Source Code Pro', style='italic', variant='normal', weight=500, stretch='normal', size='scalable')) = 11.145
2026-07-21 14:55:57 runnervm3jd5f matplotlib.font_manager[2874] DEBUG findfont: score(FontEntry(fname='/home/runner/micromamba/envs/trajan/fonts/SourceCodePro-MediumIt.ttf', index=0, name='Source Code Pro Medium', style='italic', variant='normal', weight=400, stretch='normal', size='scalable')) = 11.05
2026-07-21 14:55:57 runnervm3jd5f matplotlib.font_manager[2874] DEBUG findfont: score(FontEntry(fname='/home/runner/micromamba/envs/trajan/fonts/SourceCodePro-Regular.ttf', index=0, name='Source Code Pro', style='normal', variant='normal', weight=400, stretch='normal', size='scalable')) = 10.05
2026-07-21 14:55:57 runnervm3jd5f matplotlib.font_manager[2874] DEBUG findfont: score(FontEntry(fname='/home/runner/micromamba/envs/trajan/fonts/SourceCodePro-SemiboldIt.ttf', index=0, name='Source Code Pro', style='italic', variant='normal', weight=600, stretch='normal', size='scalable')) = 11.24
2026-07-21 14:55:57 runnervm3jd5f matplotlib.font_manager[2874] DEBUG findfont: score(FontEntry(fname='/home/runner/micromamba/envs/trajan/fonts/SourceCodePro-SemiboldIt.ttf', index=0, name='Source Code Pro Semibold', style='italic', variant='normal', weight=400, stretch='normal', size='scalable')) = 11.05
2026-07-21 14:55:57 runnervm3jd5f matplotlib.font_manager[2874] DEBUG findfont: score(FontEntry(fname='/usr/share/fonts/truetype/dejavu/DejaVuSerif.ttf', index=0, name='DejaVu Serif', style='normal', variant='normal', weight=400, stretch='normal', size='scalable')) = 10.05
2026-07-21 14:55:57 runnervm3jd5f matplotlib.font_manager[2874] DEBUG findfont: score(FontEntry(fname='/usr/share/fonts/truetype/dejavu/DejaVuSerif-Bold.ttf', index=0, name='DejaVu Serif', style='normal', variant='normal', weight=700, stretch='normal', size='scalable')) = 10.335
2026-07-21 14:55:57 runnervm3jd5f matplotlib.font_manager[2874] DEBUG findfont: score(FontEntry(fname='/usr/share/fonts/truetype/liberation/LiberationSerif-Italic.ttf', index=0, name='Liberation Serif', style='italic', variant='normal', weight=400, stretch='normal', size='scalable')) = 11.05
2026-07-21 14:55:57 runnervm3jd5f matplotlib.font_manager[2874] DEBUG findfont: score(FontEntry(fname='/usr/share/fonts/truetype/dejavu/DejaVuSansMono-BoldOblique.ttf', index=0, name='DejaVu Sans Mono', style='oblique', variant='normal', weight=700, stretch='normal', size='scalable')) = 11.335
2026-07-21 14:55:57 runnervm3jd5f matplotlib.font_manager[2874] DEBUG findfont: score(FontEntry(fname='/home/runner/micromamba/envs/trajan/fonts/SourceCodePro-Light.ttf', index=0, name='Source Code Pro', style='normal', variant='normal', weight=300, stretch='normal', size='scalable')) = 10.145
2026-07-21 14:55:57 runnervm3jd5f matplotlib.font_manager[2874] DEBUG findfont: score(FontEntry(fname='/home/runner/micromamba/envs/trajan/fonts/SourceCodePro-Light.ttf', index=0, name='Source Code Pro Light', style='normal', variant='normal', weight=400, stretch='normal', size='scalable')) = 10.05
2026-07-21 14:55:57 runnervm3jd5f matplotlib.font_manager[2874] DEBUG findfont: score(FontEntry(fname='/usr/share/fonts/truetype/liberation/LiberationMono-Italic.ttf', index=0, name='Liberation Mono', style='italic', variant='normal', weight=400, stretch='normal', size='scalable')) = 11.05
2026-07-21 14:55:57 runnervm3jd5f matplotlib.font_manager[2874] DEBUG findfont: Matching STIXNonUnicode:style=normal:variant=normal:weight=normal:stretch=normal:size=10.0 to STIXNonUnicode ('/home/runner/micromamba/envs/trajan/lib/python3.14/site-packages/matplotlib/mpl-data/fonts/ttf/STIXNonUni.ttf') with score of 0.050000.
2026-07-21 14:55:57 runnervm3jd5f matplotlib.font_manager[2874] DEBUG findfont: Matching STIXNonUnicode:style=italic:variant=normal:weight=normal:stretch=normal:size=10.0.
2026-07-21 14:55:57 runnervm3jd5f matplotlib.font_manager[2874] DEBUG findfont: score(FontEntry(fname='/home/runner/micromamba/envs/trajan/lib/python3.14/site-packages/matplotlib/mpl-data/fonts/ttf/cmmi10.ttf', index=0, name='cmmi10', style='normal', variant='normal', weight=400, stretch='normal', size='scalable')) = 11.05
2026-07-21 14:55:57 runnervm3jd5f matplotlib.font_manager[2874] DEBUG findfont: score(FontEntry(fname='/home/runner/micromamba/envs/trajan/lib/python3.14/site-packages/matplotlib/mpl-data/fonts/ttf/DejaVuSerif-Bold.ttf', index=0, name='DejaVu Serif', style='normal', variant='normal', weight=700, stretch='normal', size='scalable')) = 11.335
2026-07-21 14:55:57 runnervm3jd5f matplotlib.font_manager[2874] DEBUG findfont: score(FontEntry(fname='/home/runner/micromamba/envs/trajan/lib/python3.14/site-packages/matplotlib/mpl-data/fonts/ttf/DejaVuSans-Oblique.ttf', index=0, name='DejaVu Sans', style='oblique', variant='normal', weight=400, stretch='normal', size='scalable')) = 10.15
2026-07-21 14:55:57 runnervm3jd5f matplotlib.font_manager[2874] DEBUG findfont: score(FontEntry(fname='/home/runner/micromamba/envs/trajan/lib/python3.14/site-packages/matplotlib/mpl-data/fonts/ttf/STIXSizThreeSymReg.ttf', index=0, name='STIXSizeThreeSym', style='normal', variant='normal', weight=400, stretch='normal', size='scalable')) = 11.05
2026-07-21 14:55:57 runnervm3jd5f matplotlib.font_manager[2874] DEBUG findfont: score(FontEntry(fname='/home/runner/micromamba/envs/trajan/lib/python3.14/site-packages/matplotlib/mpl-data/fonts/ttf/STIXNonUniBolIta.ttf', index=0, name='STIXNonUnicode', style='italic', variant='normal', weight=700, stretch='normal', size='scalable')) = 0.33499999999999996
2026-07-21 14:55:57 runnervm3jd5f matplotlib.font_manager[2874] DEBUG findfont: score(FontEntry(fname='/home/runner/micromamba/envs/trajan/lib/python3.14/site-packages/matplotlib/mpl-data/fonts/ttf/DejaVuSerifDisplay.ttf', index=0, name='DejaVu Serif Display', style='normal', variant='normal', weight=400, stretch='normal', size='scalable')) = 11.05
2026-07-21 14:55:57 runnervm3jd5f matplotlib.font_manager[2874] DEBUG findfont: score(FontEntry(fname='/home/runner/micromamba/envs/trajan/lib/python3.14/site-packages/matplotlib/mpl-data/fonts/ttf/cmss10.ttf', index=0, name='cmss10', style='normal', variant='normal', weight=400, stretch='normal', size='scalable')) = 11.05
2026-07-21 14:55:57 runnervm3jd5f matplotlib.font_manager[2874] DEBUG findfont: score(FontEntry(fname='/home/runner/micromamba/envs/trajan/lib/python3.14/site-packages/matplotlib/mpl-data/fonts/ttf/STIXGeneralBolIta.ttf', index=0, name='STIXGeneral', style='italic', variant='normal', weight=700, stretch='normal', size='scalable')) = 10.335
2026-07-21 14:55:57 runnervm3jd5f matplotlib.font_manager[2874] DEBUG findfont: score(FontEntry(fname='/home/runner/micromamba/envs/trajan/lib/python3.14/site-packages/matplotlib/mpl-data/fonts/ttf/cmtt10.ttf', index=0, name='cmtt10', style='normal', variant='normal', weight=400, stretch='normal', size='scalable')) = 11.05
2026-07-21 14:55:57 runnervm3jd5f matplotlib.font_manager[2874] DEBUG findfont: score(FontEntry(fname='/home/runner/micromamba/envs/trajan/lib/python3.14/site-packages/matplotlib/mpl-data/fonts/ttf/cmsy10.ttf', index=0, name='cmsy10', style='normal', variant='normal', weight=400, stretch='normal', size='scalable')) = 11.05
2026-07-21 14:55:57 runnervm3jd5f matplotlib.font_manager[2874] DEBUG findfont: score(FontEntry(fname='/home/runner/micromamba/envs/trajan/lib/python3.14/site-packages/matplotlib/mpl-data/fonts/ttf/DejaVuSansMono-Oblique.ttf', index=0, name='DejaVu Sans Mono', style='oblique', variant='normal', weight=400, stretch='normal', size='scalable')) = 10.15
2026-07-21 14:55:57 runnervm3jd5f matplotlib.font_manager[2874] DEBUG findfont: score(FontEntry(fname='/home/runner/micromamba/envs/trajan/lib/python3.14/site-packages/matplotlib/mpl-data/fonts/ttf/STIXNonUniIta.ttf', index=0, name='STIXNonUnicode', style='italic', variant='normal', weight=400, stretch='normal', size='scalable')) = 0.05
2026-07-21 14:55:57 runnervm3jd5f matplotlib.font_manager[2874] DEBUG findfont: score(FontEntry(fname='/home/runner/micromamba/envs/trajan/lib/python3.14/site-packages/matplotlib/mpl-data/fonts/ttf/STIXGeneral.ttf', index=0, name='STIXGeneral', style='normal', variant='normal', weight=400, stretch='normal', size='scalable')) = 11.05
2026-07-21 14:55:57 runnervm3jd5f matplotlib.font_manager[2874] DEBUG findfont: score(FontEntry(fname='/home/runner/micromamba/envs/trajan/lib/python3.14/site-packages/matplotlib/mpl-data/fonts/ttf/cmti10.ttf', index=0, name='cmti10', style='normal', variant='normal', weight=400, stretch='normal', size='scalable')) = 11.05
2026-07-21 14:55:57 runnervm3jd5f matplotlib.font_manager[2874] DEBUG findfont: score(FontEntry(fname='/home/runner/micromamba/envs/trajan/lib/python3.14/site-packages/matplotlib/mpl-data/fonts/ttf/DejaVuSansMono-BoldOblique.ttf', index=0, name='DejaVu Sans Mono', style='oblique', variant='normal', weight=700, stretch='normal', size='scalable')) = 10.434999999999999
2026-07-21 14:55:57 runnervm3jd5f matplotlib.font_manager[2874] DEBUG findfont: score(FontEntry(fname='/home/runner/micromamba/envs/trajan/lib/python3.14/site-packages/matplotlib/mpl-data/fonts/ttf/DejaVuSerif.ttf', index=0, name='DejaVu Serif', style='normal', variant='normal', weight=400, stretch='normal', size='scalable')) = 11.05
2026-07-21 14:55:57 runnervm3jd5f matplotlib.font_manager[2874] DEBUG findfont: score(FontEntry(fname='/home/runner/micromamba/envs/trajan/lib/python3.14/site-packages/matplotlib/mpl-data/fonts/ttf/LastResortHE-Regular.ttf', index=0, name='Last Resort High-Efficiency', style='normal', variant='normal', weight=400, stretch='normal', size='scalable')) = 11.05
2026-07-21 14:55:57 runnervm3jd5f matplotlib.font_manager[2874] DEBUG findfont: score(FontEntry(fname='/home/runner/micromamba/envs/trajan/lib/python3.14/site-packages/matplotlib/mpl-data/fonts/ttf/cmex10.ttf', index=0, name='cmex10', style='normal', variant='normal', weight=400, stretch='normal', size='scalable')) = 11.05
2026-07-21 14:55:57 runnervm3jd5f matplotlib.font_manager[2874] DEBUG findfont: score(FontEntry(fname='/home/runner/micromamba/envs/trajan/lib/python3.14/site-packages/matplotlib/mpl-data/fonts/ttf/STIXSizFiveSymReg.ttf', index=0, name='STIXSizeFiveSym', style='normal', variant='normal', weight=400, stretch='normal', size='scalable')) = 11.05
2026-07-21 14:55:57 runnervm3jd5f matplotlib.font_manager[2874] DEBUG findfont: score(FontEntry(fname='/home/runner/micromamba/envs/trajan/lib/python3.14/site-packages/matplotlib/mpl-data/fonts/ttf/STIXNonUniBol.ttf', index=0, name='STIXNonUnicode', style='normal', variant='normal', weight=700, stretch='normal', size='scalable')) = 1.335
2026-07-21 14:55:57 runnervm3jd5f matplotlib.font_manager[2874] DEBUG findfont: score(FontEntry(fname='/home/runner/micromamba/envs/trajan/lib/python3.14/site-packages/matplotlib/mpl-data/fonts/ttf/DejaVuSansDisplay.ttf', index=0, name='DejaVu Sans Display', style='normal', variant='normal', weight=400, stretch='normal', size='scalable')) = 11.05
2026-07-21 14:55:57 runnervm3jd5f matplotlib.font_manager[2874] DEBUG findfont: score(FontEntry(fname='/home/runner/micromamba/envs/trajan/lib/python3.14/site-packages/matplotlib/mpl-data/fonts/ttf/DejaVuSansMono.ttf', index=0, name='DejaVu Sans Mono', style='normal', variant='normal', weight=400, stretch='normal', size='scalable')) = 11.05
2026-07-21 14:55:57 runnervm3jd5f matplotlib.font_manager[2874] DEBUG findfont: score(FontEntry(fname='/home/runner/micromamba/envs/trajan/lib/python3.14/site-packages/matplotlib/mpl-data/fonts/ttf/cmb10.ttf', index=0, name='cmb10', style='normal', variant='normal', weight=400, stretch='normal', size='scalable')) = 11.05
2026-07-21 14:55:57 runnervm3jd5f matplotlib.font_manager[2874] DEBUG findfont: score(FontEntry(fname='/home/runner/micromamba/envs/trajan/lib/python3.14/site-packages/matplotlib/mpl-data/fonts/ttf/STIXSizTwoSymReg.ttf', index=0, name='STIXSizeTwoSym', style='normal', variant='normal', weight=400, stretch='normal', size='scalable')) = 11.05
2026-07-21 14:55:57 runnervm3jd5f matplotlib.font_manager[2874] DEBUG findfont: score(FontEntry(fname='/home/runner/micromamba/envs/trajan/lib/python3.14/site-packages/matplotlib/mpl-data/fonts/ttf/DejaVuSans.ttf', index=0, name='DejaVu Sans', style='normal', variant='normal', weight=400, stretch='normal', size='scalable')) = 11.05
2026-07-21 14:55:57 runnervm3jd5f matplotlib.font_manager[2874] DEBUG findfont: score(FontEntry(fname='/home/runner/micromamba/envs/trajan/lib/python3.14/site-packages/matplotlib/mpl-data/fonts/ttf/STIXNonUni.ttf', index=0, name='STIXNonUnicode', style='normal', variant='normal', weight=400, stretch='normal', size='scalable')) = 1.05
2026-07-21 14:55:57 runnervm3jd5f matplotlib.font_manager[2874] DEBUG findfont: score(FontEntry(fname='/home/runner/micromamba/envs/trajan/lib/python3.14/site-packages/matplotlib/mpl-data/fonts/ttf/STIXGeneralItalic.ttf', index=0, name='STIXGeneral', style='italic', variant='normal', weight=400, stretch='normal', size='scalable')) = 10.05
2026-07-21 14:55:57 runnervm3jd5f matplotlib.font_manager[2874] DEBUG findfont: score(FontEntry(fname='/home/runner/micromamba/envs/trajan/lib/python3.14/site-packages/matplotlib/mpl-data/fonts/ttf/STIXSizOneSymBol.ttf', index=0, name='STIXSizeOneSym', style='normal', variant='normal', weight=700, stretch='normal', size='scalable')) = 11.335
2026-07-21 14:55:57 runnervm3jd5f matplotlib.font_manager[2874] DEBUG findfont: score(FontEntry(fname='/home/runner/micromamba/envs/trajan/lib/python3.14/site-packages/matplotlib/mpl-data/fonts/ttf/DejaVuSansMono-Bold.ttf', index=0, name='DejaVu Sans Mono', style='normal', variant='normal', weight=700, stretch='normal', size='scalable')) = 11.335
2026-07-21 14:55:57 runnervm3jd5f matplotlib.font_manager[2874] DEBUG findfont: score(FontEntry(fname='/home/runner/micromamba/envs/trajan/lib/python3.14/site-packages/matplotlib/mpl-data/fonts/ttf/STIXSizTwoSymBol.ttf', index=0, name='STIXSizeTwoSym', style='normal', variant='normal', weight=700, stretch='normal', size='scalable')) = 11.335
2026-07-21 14:55:57 runnervm3jd5f matplotlib.font_manager[2874] DEBUG findfont: score(FontEntry(fname='/home/runner/micromamba/envs/trajan/lib/python3.14/site-packages/matplotlib/mpl-data/fonts/ttf/STIXSizThreeSymBol.ttf', index=0, name='STIXSizeThreeSym', style='normal', variant='normal', weight=700, stretch='normal', size='scalable')) = 11.335
2026-07-21 14:55:57 runnervm3jd5f matplotlib.font_manager[2874] DEBUG findfont: score(FontEntry(fname='/home/runner/micromamba/envs/trajan/lib/python3.14/site-packages/matplotlib/mpl-data/fonts/ttf/DejaVuSerif-BoldItalic.ttf', index=0, name='DejaVu Serif', style='italic', variant='normal', weight=700, stretch='normal', size='scalable')) = 10.335
2026-07-21 14:55:57 runnervm3jd5f matplotlib.font_manager[2874] DEBUG findfont: score(FontEntry(fname='/home/runner/micromamba/envs/trajan/lib/python3.14/site-packages/matplotlib/mpl-data/fonts/ttf/DejaVuSerif-Italic.ttf', index=0, name='DejaVu Serif', style='italic', variant='normal', weight=400, stretch='normal', size='scalable')) = 10.05
2026-07-21 14:55:57 runnervm3jd5f matplotlib.font_manager[2874] DEBUG findfont: score(FontEntry(fname='/home/runner/micromamba/envs/trajan/lib/python3.14/site-packages/matplotlib/mpl-data/fonts/ttf/DejaVuSans-Bold.ttf', index=0, name='DejaVu Sans', style='normal', variant='normal', weight=700, stretch='normal', size='scalable')) = 11.335
2026-07-21 14:55:57 runnervm3jd5f matplotlib.font_manager[2874] DEBUG findfont: score(FontEntry(fname='/home/runner/micromamba/envs/trajan/lib/python3.14/site-packages/matplotlib/mpl-data/fonts/ttf/STIXSizFourSymBol.ttf', index=0, name='STIXSizeFourSym', style='normal', variant='normal', weight=700, stretch='normal', size='scalable')) = 11.335
2026-07-21 14:55:57 runnervm3jd5f matplotlib.font_manager[2874] DEBUG findfont: score(FontEntry(fname='/home/runner/micromamba/envs/trajan/lib/python3.14/site-packages/matplotlib/mpl-data/fonts/ttf/STIXSizOneSymReg.ttf', index=0, name='STIXSizeOneSym', style='normal', variant='normal', weight=400, stretch='normal', size='scalable')) = 11.05
2026-07-21 14:55:57 runnervm3jd5f matplotlib.font_manager[2874] DEBUG findfont: score(FontEntry(fname='/home/runner/micromamba/envs/trajan/lib/python3.14/site-packages/matplotlib/mpl-data/fonts/ttf/cmr10.ttf', index=0, name='cmr10', style='normal', variant='normal', weight=400, stretch='normal', size='scalable')) = 11.05
2026-07-21 14:55:57 runnervm3jd5f matplotlib.font_manager[2874] DEBUG findfont: score(FontEntry(fname='/home/runner/micromamba/envs/trajan/lib/python3.14/site-packages/matplotlib/mpl-data/fonts/ttf/STIXGeneralBol.ttf', index=0, name='STIXGeneral', style='normal', variant='normal', weight=700, stretch='normal', size='scalable')) = 11.335
2026-07-21 14:55:57 runnervm3jd5f matplotlib.font_manager[2874] DEBUG findfont: score(FontEntry(fname='/home/runner/micromamba/envs/trajan/lib/python3.14/site-packages/matplotlib/mpl-data/fonts/ttf/DejaVuSans-BoldOblique.ttf', index=0, name='DejaVu Sans', style='oblique', variant='normal', weight=700, stretch='normal', size='scalable')) = 10.434999999999999
2026-07-21 14:55:57 runnervm3jd5f matplotlib.font_manager[2874] DEBUG findfont: score(FontEntry(fname='/home/runner/micromamba/envs/trajan/lib/python3.14/site-packages/matplotlib/mpl-data/fonts/ttf/STIXSizFourSymReg.ttf', index=0, name='STIXSizeFourSym', style='normal', variant='normal', weight=400, stretch='normal', size='scalable')) = 11.05
2026-07-21 14:55:57 runnervm3jd5f matplotlib.font_manager[2874] DEBUG findfont: score(FontEntry(fname='/usr/share/fonts/truetype/lato/Lato-Black.ttf', index=0, name='Lato', style='normal', variant='normal', weight=900, stretch='normal', size='scalable')) = 11.525
2026-07-21 14:55:57 runnervm3jd5f matplotlib.font_manager[2874] DEBUG findfont: score(FontEntry(fname='/usr/share/fonts/truetype/lato/Lato-Black.ttf', index=0, name='Lato Black', style='normal', variant='normal', weight=400, stretch='normal', size='scalable')) = 11.05
2026-07-21 14:55:57 runnervm3jd5f matplotlib.font_manager[2874] DEBUG findfont: score(FontEntry(fname='/usr/share/fonts/truetype/liberation/LiberationSerif-Regular.ttf', index=0, name='Liberation Serif', style='normal', variant='normal', weight=400, stretch='normal', size='scalable')) = 11.05
2026-07-21 14:55:57 runnervm3jd5f matplotlib.font_manager[2874] DEBUG findfont: score(FontEntry(fname='/usr/share/fonts/truetype/dejavu/DejaVuSerifCondensed.ttf', index=0, name='DejaVu Serif', style='normal', variant='normal', weight=400, stretch='condensed', size='scalable')) = 11.25
2026-07-21 14:55:57 runnervm3jd5f matplotlib.font_manager[2874] DEBUG findfont: score(FontEntry(fname='/usr/share/fonts/truetype/dejavu/DejaVuSerifCondensed.ttf', index=0, name='DejaVu Serif Condensed', style='normal', variant='normal', weight=380, stretch='condensed', size='scalable')) = 11.269
2026-07-21 14:55:57 runnervm3jd5f matplotlib.font_manager[2874] DEBUG findfont: score(FontEntry(fname='/home/runner/micromamba/envs/trajan/fonts/UbuntuMono-BI.ttf', index=0, name='Ubuntu Mono', style='italic', variant='normal', weight=700, stretch='normal', size='scalable')) = 10.335
2026-07-21 14:55:57 runnervm3jd5f matplotlib.font_manager[2874] DEBUG findfont: score(FontEntry(fname='/usr/share/fonts/truetype/dejavu/DejaVuSans.ttf', index=0, name='DejaVu Sans', style='normal', variant='normal', weight=400, stretch='normal', size='scalable')) = 11.05
2026-07-21 14:55:57 runnervm3jd5f matplotlib.font_manager[2874] DEBUG findfont: score(FontEntry(fname='/usr/share/fonts/truetype/lato/Lato-Italic.ttf', index=0, name='Lato', style='italic', variant='normal', weight=400, stretch='normal', size='scalable')) = 10.05
2026-07-21 14:55:57 runnervm3jd5f matplotlib.font_manager[2874] DEBUG findfont: score(FontEntry(fname='/usr/share/fonts/truetype/liberation/LiberationSans-Italic.ttf', index=0, name='Liberation Sans', style='italic', variant='normal', weight=400, stretch='normal', size='scalable')) = 10.05
2026-07-21 14:55:57 runnervm3jd5f matplotlib.font_manager[2874] DEBUG findfont: score(FontEntry(fname='/home/runner/micromamba/envs/trajan/fonts/Ubuntu-B.ttf', index=0, name='Ubuntu', style='normal', variant='normal', weight=700, stretch='normal', size='scalable')) = 11.335
2026-07-21 14:55:57 runnervm3jd5f matplotlib.font_manager[2874] DEBUG findfont: score(FontEntry(fname='/home/runner/micromamba/envs/trajan/fonts/SourceCodePro-Semibold.ttf', index=0, name='Source Code Pro', style='normal', variant='normal', weight=600, stretch='normal', size='scalable')) = 11.24
2026-07-21 14:55:57 runnervm3jd5f matplotlib.font_manager[2874] DEBUG findfont: score(FontEntry(fname='/home/runner/micromamba/envs/trajan/fonts/SourceCodePro-Semibold.ttf', index=0, name='Source Code Pro Semibold', style='normal', variant='normal', weight=400, stretch='normal', size='scalable')) = 11.05
2026-07-21 14:55:57 runnervm3jd5f matplotlib.font_manager[2874] DEBUG findfont: score(FontEntry(fname='/home/runner/micromamba/envs/trajan/fonts/SourceCodePro-Bold.ttf', index=0, name='Source Code Pro', style='normal', variant='normal', weight=700, stretch='normal', size='scalable')) = 11.335
2026-07-21 14:55:57 runnervm3jd5f matplotlib.font_manager[2874] DEBUG findfont: score(FontEntry(fname='/home/runner/micromamba/envs/trajan/fonts/Ubuntu-MI.ttf', index=0, name='Ubuntu', style='italic', variant='normal', weight=500, stretch='normal', size='scalable')) = 10.145
2026-07-21 14:55:57 runnervm3jd5f matplotlib.font_manager[2874] DEBUG findfont: score(FontEntry(fname='/home/runner/micromamba/envs/trajan/fonts/Ubuntu-MI.ttf', index=0, name='Ubuntu Light', style='italic', variant='normal', weight=700, stretch='normal', size='scalable')) = 10.335
2026-07-21 14:55:57 runnervm3jd5f matplotlib.font_manager[2874] DEBUG findfont: score(FontEntry(fname='/usr/share/fonts/truetype/lato/Lato-Regular.ttf', index=0, name='Lato', style='normal', variant='normal', weight=400, stretch='normal', size='scalable')) = 11.05
2026-07-21 14:55:57 runnervm3jd5f matplotlib.font_manager[2874] DEBUG findfont: score(FontEntry(fname='/usr/share/fonts/truetype/lato/Lato-ThinItalic.ttf', index=0, name='Lato', style='italic', variant='normal', weight=275, stretch='normal', size='scalable')) = 10.16875
2026-07-21 14:55:57 runnervm3jd5f matplotlib.font_manager[2874] DEBUG findfont: score(FontEntry(fname='/usr/share/fonts/truetype/lato/Lato-ThinItalic.ttf', index=0, name='Lato Thin', style='italic', variant='normal', weight=400, stretch='normal', size='scalable')) = 10.05
2026-07-21 14:55:57 runnervm3jd5f matplotlib.font_manager[2874] DEBUG findfont: score(FontEntry(fname='/usr/share/fonts/truetype/lato/Lato-BlackItalic.ttf', index=0, name='Lato', style='italic', variant='normal', weight=900, stretch='normal', size='scalable')) = 10.525
2026-07-21 14:55:57 runnervm3jd5f matplotlib.font_manager[2874] DEBUG findfont: score(FontEntry(fname='/usr/share/fonts/truetype/lato/Lato-BlackItalic.ttf', index=0, name='Lato Black', style='italic', variant='normal', weight=400, stretch='normal', size='scalable')) = 10.05
2026-07-21 14:55:57 runnervm3jd5f matplotlib.font_manager[2874] DEBUG findfont: score(FontEntry(fname='/usr/share/fonts/truetype/dejavu/DejaVuSerifCondensed-Italic.ttf', index=0, name='DejaVu Serif', style='italic', variant='normal', weight=400, stretch='condensed', size='scalable')) = 10.25
2026-07-21 14:55:57 runnervm3jd5f matplotlib.font_manager[2874] DEBUG findfont: score(FontEntry(fname='/usr/share/fonts/truetype/dejavu/DejaVuSerifCondensed-Italic.ttf', index=0, name='DejaVu Serif Condensed', style='italic', variant='normal', weight=400, stretch='condensed', size='scalable')) = 10.25
2026-07-21 14:55:57 runnervm3jd5f matplotlib.font_manager[2874] DEBUG findfont: score(FontEntry(fname='/usr/share/fonts/truetype/dejavu/DejaVuSans-Bold.ttf', index=0, name='DejaVu Sans', style='normal', variant='normal', weight=700, stretch='normal', size='scalable')) = 11.335
2026-07-21 14:55:57 runnervm3jd5f matplotlib.font_manager[2874] DEBUG findfont: score(FontEntry(fname='/home/runner/micromamba/envs/trajan/fonts/UbuntuMono-R.ttf', index=0, name='Ubuntu Mono', style='normal', variant='normal', weight=400, stretch='normal', size='scalable')) = 11.05
2026-07-21 14:55:57 runnervm3jd5f matplotlib.font_manager[2874] DEBUG findfont: score(FontEntry(fname='/usr/share/fonts/truetype/dejavu/DejaVuSerif-BoldItalic.ttf', index=0, name='DejaVu Serif', style='italic', variant='normal', weight=700, stretch='normal', size='scalable')) = 10.335
2026-07-21 14:55:57 runnervm3jd5f matplotlib.font_manager[2874] DEBUG findfont: score(FontEntry(fname='/usr/share/fonts/truetype/lato/Lato-Hairline.ttf', index=0, name='Lato', style='normal', variant='normal', weight=250, stretch='normal', size='scalable')) = 11.1925
2026-07-21 14:55:57 runnervm3jd5f matplotlib.font_manager[2874] DEBUG findfont: score(FontEntry(fname='/usr/share/fonts/truetype/lato/Lato-Hairline.ttf', index=0, name='Lato Hairline', style='normal', variant='normal', weight=400, stretch='normal', size='scalable')) = 11.05
2026-07-21 14:55:57 runnervm3jd5f matplotlib.font_manager[2874] DEBUG findfont: score(FontEntry(fname='/usr/share/fonts/truetype/lato/Lato-LightItalic.ttf', index=0, name='Lato', style='italic', variant='normal', weight=300, stretch='normal', size='scalable')) = 10.145
2026-07-21 14:55:57 runnervm3jd5f matplotlib.font_manager[2874] DEBUG findfont: score(FontEntry(fname='/usr/share/fonts/truetype/lato/Lato-LightItalic.ttf', index=0, name='Lato Light', style='italic', variant='normal', weight=400, stretch='normal', size='scalable')) = 10.05
2026-07-21 14:55:57 runnervm3jd5f matplotlib.font_manager[2874] DEBUG findfont: score(FontEntry(fname='/usr/share/fonts/truetype/dejavu/DejaVuSansCondensed-BoldOblique.ttf', index=0, name='DejaVu Sans', style='oblique', variant='normal', weight=700, stretch='condensed', size='scalable')) = 10.634999999999998
2026-07-21 14:55:57 runnervm3jd5f matplotlib.font_manager[2874] DEBUG findfont: score(FontEntry(fname='/usr/share/fonts/truetype/dejavu/DejaVuSansCondensed-BoldOblique.ttf', index=0, name='DejaVu Sans Condensed', style='oblique', variant='normal', weight=700, stretch='condensed', size='scalable')) = 10.634999999999998
2026-07-21 14:55:57 runnervm3jd5f matplotlib.font_manager[2874] DEBUG findfont: score(FontEntry(fname='/home/runner/micromamba/envs/trajan/fonts/SourceCodePro-It.ttf', index=0, name='Source Code Pro', style='italic', variant='normal', weight=400, stretch='normal', size='scalable')) = 10.05
2026-07-21 14:55:57 runnervm3jd5f matplotlib.font_manager[2874] DEBUG findfont: score(FontEntry(fname='/home/runner/micromamba/envs/trajan/fonts/SourceCodePro-ExtraLightIt.ttf', index=0, name='Source Code Pro', style='italic', variant='normal', weight=200, stretch='normal', size='scalable')) = 10.24
2026-07-21 14:55:57 runnervm3jd5f matplotlib.font_manager[2874] DEBUG findfont: score(FontEntry(fname='/home/runner/micromamba/envs/trajan/fonts/SourceCodePro-ExtraLightIt.ttf', index=0, name='Source Code Pro ExtraLight', style='italic', variant='normal', weight=400, stretch='normal', size='scalable')) = 10.05
2026-07-21 14:55:57 runnervm3jd5f matplotlib.font_manager[2874] DEBUG findfont: score(FontEntry(fname='/usr/share/fonts/truetype/lato/Lato-Medium.ttf', index=0, name='Lato', style='normal', variant='normal', weight=500, stretch='normal', size='scalable')) = 11.145
2026-07-21 14:55:57 runnervm3jd5f matplotlib.font_manager[2874] DEBUG findfont: score(FontEntry(fname='/usr/share/fonts/truetype/lato/Lato-Medium.ttf', index=0, name='Lato Medium', style='normal', variant='normal', weight=400, stretch='normal', size='scalable')) = 11.05
2026-07-21 14:55:57 runnervm3jd5f matplotlib.font_manager[2874] DEBUG findfont: score(FontEntry(fname='/usr/share/fonts/truetype/lato/Lato-BoldItalic.ttf', index=0, name='Lato', style='italic', variant='normal', weight=700, stretch='normal', size='scalable')) = 10.335
2026-07-21 14:55:57 runnervm3jd5f matplotlib.font_manager[2874] DEBUG findfont: score(FontEntry(fname='/home/runner/micromamba/envs/trajan/fonts/DejaVuSans.ttf', index=0, name='DejaVu Sans', style='normal', variant='normal', weight=400, stretch='normal', size='scalable')) = 11.05
2026-07-21 14:55:57 runnervm3jd5f matplotlib.font_manager[2874] DEBUG findfont: score(FontEntry(fname='/home/runner/micromamba/envs/trajan/fonts/UbuntuMono-B.ttf', index=0, name='Ubuntu Mono', style='normal', variant='normal', weight=700, stretch='normal', size='scalable')) = 11.335
2026-07-21 14:55:57 runnervm3jd5f matplotlib.font_manager[2874] DEBUG findfont: score(FontEntry(fname='/home/runner/micromamba/envs/trajan/fonts/SourceCodePro-LightIt.ttf', index=0, name='Source Code Pro', style='italic', variant='normal', weight=300, stretch='normal', size='scalable')) = 10.145
2026-07-21 14:55:57 runnervm3jd5f matplotlib.font_manager[2874] DEBUG findfont: score(FontEntry(fname='/home/runner/micromamba/envs/trajan/fonts/SourceCodePro-LightIt.ttf', index=0, name='Source Code Pro Light', style='italic', variant='normal', weight=400, stretch='normal', size='scalable')) = 10.05
2026-07-21 14:55:57 runnervm3jd5f matplotlib.font_manager[2874] DEBUG findfont: score(FontEntry(fname='/usr/share/fonts/truetype/liberation/LiberationSans-BoldItalic.ttf', index=0, name='Liberation Sans', style='italic', variant='normal', weight=700, stretch='normal', size='scalable')) = 10.335
2026-07-21 14:55:57 runnervm3jd5f matplotlib.font_manager[2874] DEBUG findfont: score(FontEntry(fname='/usr/share/fonts/truetype/liberation/LiberationSans-Regular.ttf', index=0, name='Liberation Sans', style='normal', variant='normal', weight=400, stretch='normal', size='scalable')) = 11.05
2026-07-21 14:55:57 runnervm3jd5f matplotlib.font_manager[2874] DEBUG findfont: score(FontEntry(fname='/usr/share/fonts/truetype/dejavu/DejaVuSansMono-Bold.ttf', index=0, name='DejaVu Sans Mono', style='normal', variant='normal', weight=700, stretch='normal', size='scalable')) = 11.335
2026-07-21 14:55:57 runnervm3jd5f matplotlib.font_manager[2874] DEBUG findfont: score(FontEntry(fname='/home/runner/micromamba/envs/trajan/fonts/SourceCodePro-BoldIt.ttf', index=0, name='Source Code Pro', style='italic', variant='normal', weight=700, stretch='normal', size='scalable')) = 10.335
2026-07-21 14:55:57 runnervm3jd5f matplotlib.font_manager[2874] DEBUG findfont: score(FontEntry(fname='/usr/share/fonts/truetype/lato/Lato-Bold.ttf', index=0, name='Lato', style='normal', variant='normal', weight=700, stretch='normal', size='scalable')) = 11.335
2026-07-21 14:55:57 runnervm3jd5f matplotlib.font_manager[2874] DEBUG findfont: score(FontEntry(fname='/usr/share/fonts/truetype/dejavu/DejaVuSansCondensed.ttf', index=0, name='DejaVu Sans', style='normal', variant='normal', weight=400, stretch='condensed', size='scalable')) = 11.25
2026-07-21 14:55:57 runnervm3jd5f matplotlib.font_manager[2874] DEBUG findfont: score(FontEntry(fname='/usr/share/fonts/truetype/dejavu/DejaVuSansCondensed.ttf', index=0, name='DejaVu Sans Condensed', style='normal', variant='normal', weight=380, stretch='condensed', size='scalable')) = 11.269
2026-07-21 14:55:57 runnervm3jd5f matplotlib.font_manager[2874] DEBUG findfont: score(FontEntry(fname='/usr/share/fonts/truetype/lato/Lato-MediumItalic.ttf', index=0, name='Lato', style='italic', variant='normal', weight=500, stretch='normal', size='scalable')) = 10.145
2026-07-21 14:55:57 runnervm3jd5f matplotlib.font_manager[2874] DEBUG findfont: score(FontEntry(fname='/usr/share/fonts/truetype/lato/Lato-MediumItalic.ttf', index=0, name='Lato Medium', style='italic', variant='normal', weight=400, stretch='normal', size='scalable')) = 10.05
2026-07-21 14:55:57 runnervm3jd5f matplotlib.font_manager[2874] DEBUG findfont: score(FontEntry(fname='/usr/share/fonts/truetype/liberation/LiberationSans-Bold.ttf', index=0, name='Liberation Sans', style='normal', variant='normal', weight=700, stretch='normal', size='scalable')) = 11.335
2026-07-21 14:55:57 runnervm3jd5f matplotlib.font_manager[2874] DEBUG findfont: score(FontEntry(fname='/usr/share/fonts/truetype/dejavu/DejaVuSerifCondensed-BoldItalic.ttf', index=0, name='DejaVu Serif', style='italic', variant='normal', weight=700, stretch='condensed', size='scalable')) = 10.535
2026-07-21 14:55:57 runnervm3jd5f matplotlib.font_manager[2874] DEBUG findfont: score(FontEntry(fname='/usr/share/fonts/truetype/dejavu/DejaVuSerifCondensed-BoldItalic.ttf', index=0, name='DejaVu Serif Condensed', style='italic', variant='normal', weight=700, stretch='condensed', size='scalable')) = 10.535
2026-07-21 14:55:57 runnervm3jd5f matplotlib.font_manager[2874] DEBUG findfont: score(FontEntry(fname='/home/runner/micromamba/envs/trajan/fonts/Ubuntu-R.ttf', index=0, name='Ubuntu', style='normal', variant='normal', weight=400, stretch='normal', size='scalable')) = 11.05
2026-07-21 14:55:57 runnervm3jd5f matplotlib.font_manager[2874] DEBUG findfont: score(FontEntry(fname='/usr/share/fonts/truetype/lato/Lato-Light.ttf', index=0, name='Lato', style='normal', variant='normal', weight=300, stretch='normal', size='scalable')) = 11.145
2026-07-21 14:55:57 runnervm3jd5f matplotlib.font_manager[2874] DEBUG findfont: score(FontEntry(fname='/usr/share/fonts/truetype/lato/Lato-Light.ttf', index=0, name='Lato Light', style='normal', variant='normal', weight=400, stretch='normal', size='scalable')) = 11.05
2026-07-21 14:55:57 runnervm3jd5f matplotlib.font_manager[2874] DEBUG findfont: score(FontEntry(fname='/usr/share/fonts/truetype/liberation/LiberationSerif-BoldItalic.ttf', index=0, name='Liberation Serif', style='italic', variant='normal', weight=700, stretch='normal', size='scalable')) = 10.335
2026-07-21 14:55:57 runnervm3jd5f matplotlib.font_manager[2874] DEBUG findfont: score(FontEntry(fname='/home/runner/micromamba/envs/trajan/fonts/Ubuntu-Th.ttf', index=0, name='Ubuntu', style='normal', variant='normal', weight=250, stretch='normal', size='scalable')) = 11.1925
2026-07-21 14:55:57 runnervm3jd5f matplotlib.font_manager[2874] DEBUG findfont: score(FontEntry(fname='/home/runner/micromamba/envs/trajan/fonts/Ubuntu-Th.ttf', index=0, name='Ubuntu Thin', style='normal', variant='normal', weight=400, stretch='normal', size='scalable')) = 11.05
2026-07-21 14:55:57 runnervm3jd5f matplotlib.font_manager[2874] DEBUG findfont: score(FontEntry(fname='/home/runner/micromamba/envs/trajan/fonts/SourceCodePro-ExtraLight.ttf', index=0, name='Source Code Pro', style='normal', variant='normal', weight=200, stretch='normal', size='scalable')) = 11.24
2026-07-21 14:55:57 runnervm3jd5f matplotlib.font_manager[2874] DEBUG findfont: score(FontEntry(fname='/home/runner/micromamba/envs/trajan/fonts/SourceCodePro-ExtraLight.ttf', index=0, name='Source Code Pro ExtraLight', style='normal', variant='normal', weight=400, stretch='normal', size='scalable')) = 11.05
2026-07-21 14:55:57 runnervm3jd5f matplotlib.font_manager[2874] DEBUG findfont: score(FontEntry(fname='/usr/share/fonts/truetype/lato/Lato-Thin.ttf', index=0, name='Lato', style='normal', variant='normal', weight=275, stretch='normal', size='scalable')) = 11.16875
2026-07-21 14:55:57 runnervm3jd5f matplotlib.font_manager[2874] DEBUG findfont: score(FontEntry(fname='/usr/share/fonts/truetype/lato/Lato-Thin.ttf', index=0, name='Lato Thin', style='normal', variant='normal', weight=400, stretch='normal', size='scalable')) = 11.05
2026-07-21 14:55:57 runnervm3jd5f matplotlib.font_manager[2874] DEBUG findfont: score(FontEntry(fname='/usr/share/fonts/truetype/liberation/LiberationSerif-Bold.ttf', index=0, name='Liberation Serif', style='normal', variant='normal', weight=700, stretch='normal', size='scalable')) = 11.335
2026-07-21 14:55:57 runnervm3jd5f matplotlib.font_manager[2874] DEBUG findfont: score(FontEntry(fname='/home/runner/micromamba/envs/trajan/fonts/Inconsolata-Regular.ttf', index=0, name='Inconsolata', style='normal', variant='normal', weight=400, stretch='normal', size='scalable')) = 11.05
2026-07-21 14:55:57 runnervm3jd5f matplotlib.font_manager[2874] DEBUG findfont: score(FontEntry(fname='/home/runner/micromamba/envs/trajan/fonts/Ubuntu-C.ttf', index=0, name='Ubuntu Condensed', style='normal', variant='normal', weight=400, stretch='condensed', size='scalable')) = 11.25
2026-07-21 14:55:57 runnervm3jd5f matplotlib.font_manager[2874] DEBUG findfont: score(FontEntry(fname='/usr/share/fonts/truetype/dejavu/DejaVuSansCondensed-Bold.ttf', index=0, name='DejaVu Sans', style='normal', variant='normal', weight=700, stretch='condensed', size='scalable')) = 11.535
2026-07-21 14:55:57 runnervm3jd5f matplotlib.font_manager[2874] DEBUG findfont: score(FontEntry(fname='/usr/share/fonts/truetype/dejavu/DejaVuSansCondensed-Bold.ttf', index=0, name='DejaVu Sans Condensed', style='normal', variant='normal', weight=700, stretch='condensed', size='scalable')) = 11.535
2026-07-21 14:55:57 runnervm3jd5f matplotlib.font_manager[2874] DEBUG findfont: score(FontEntry(fname='/usr/share/fonts/truetype/liberation/LiberationMono-Bold.ttf', index=0, name='Liberation Mono', style='normal', variant='normal', weight=700, stretch='normal', size='scalable')) = 11.335
2026-07-21 14:55:57 runnervm3jd5f matplotlib.font_manager[2874] DEBUG findfont: score(FontEntry(fname='/home/runner/micromamba/envs/trajan/fonts/SourceCodePro-Black.ttf', index=0, name='Source Code Pro', style='normal', variant='normal', weight=900, stretch='normal', size='scalable')) = 11.525
2026-07-21 14:55:57 runnervm3jd5f matplotlib.font_manager[2874] DEBUG findfont: score(FontEntry(fname='/home/runner/micromamba/envs/trajan/fonts/SourceCodePro-Black.ttf', index=0, name='Source Code Pro Black', style='normal', variant='normal', weight=400, stretch='normal', size='scalable')) = 11.05
2026-07-21 14:55:57 runnervm3jd5f matplotlib.font_manager[2874] DEBUG findfont: score(FontEntry(fname='/home/runner/micromamba/envs/trajan/fonts/SourceCodePro-BlackIt.ttf', index=0, name='Source Code Pro', style='italic', variant='normal', weight=900, stretch='normal', size='scalable')) = 10.525
2026-07-21 14:55:57 runnervm3jd5f matplotlib.font_manager[2874] DEBUG findfont: score(FontEntry(fname='/home/runner/micromamba/envs/trajan/fonts/SourceCodePro-BlackIt.ttf', index=0, name='Source Code Pro Black', style='italic', variant='normal', weight=400, stretch='normal', size='scalable')) = 10.05
2026-07-21 14:55:57 runnervm3jd5f matplotlib.font_manager[2874] DEBUG findfont: score(FontEntry(fname='/home/runner/micromamba/envs/trajan/fonts/Ubuntu-LI.ttf', index=0, name='Ubuntu', style='italic', variant='normal', weight=300, stretch='normal', size='scalable')) = 10.145
2026-07-21 14:55:57 runnervm3jd5f matplotlib.font_manager[2874] DEBUG findfont: score(FontEntry(fname='/home/runner/micromamba/envs/trajan/fonts/Ubuntu-LI.ttf', index=0, name='Ubuntu Light', style='italic', variant='normal', weight=400, stretch='normal', size='scalable')) = 10.05
2026-07-21 14:55:57 runnervm3jd5f matplotlib.font_manager[2874] DEBUG findfont: score(FontEntry(fname='/usr/share/fonts/truetype/liberation/LiberationMono-Regular.ttf', index=0, name='Liberation Mono', style='normal', variant='normal', weight=400, stretch='normal', size='scalable')) = 11.05
2026-07-21 14:55:57 runnervm3jd5f matplotlib.font_manager[2874] DEBUG findfont: score(FontEntry(fname='/home/runner/micromamba/envs/trajan/fonts/UbuntuMono-RI.ttf', index=0, name='Ubuntu Mono', style='italic', variant='normal', weight=400, stretch='normal', size='scalable')) = 10.05
2026-07-21 14:55:57 runnervm3jd5f matplotlib.font_manager[2874] DEBUG findfont: score(FontEntry(fname='/usr/share/fonts/truetype/lato/Lato-Heavy.ttf', index=0, name='Lato', style='normal', variant='normal', weight=800, stretch='normal', size='scalable')) = 11.43
2026-07-21 14:55:57 runnervm3jd5f matplotlib.font_manager[2874] DEBUG findfont: score(FontEntry(fname='/usr/share/fonts/truetype/lato/Lato-Heavy.ttf', index=0, name='Lato Heavy', style='normal', variant='normal', weight=400, stretch='normal', size='scalable')) = 11.05
2026-07-21 14:55:57 runnervm3jd5f matplotlib.font_manager[2874] DEBUG findfont: score(FontEntry(fname='/usr/share/fonts/truetype/lato/Lato-HairlineItalic.ttf', index=0, name='Lato', style='italic', variant='normal', weight=250, stretch='normal', size='scalable')) = 10.1925
2026-07-21 14:55:57 runnervm3jd5f matplotlib.font_manager[2874] DEBUG findfont: score(FontEntry(fname='/usr/share/fonts/truetype/lato/Lato-HairlineItalic.ttf', index=0, name='Lato Hairline', style='italic', variant='normal', weight=400, stretch='normal', size='scalable')) = 10.05
2026-07-21 14:55:57 runnervm3jd5f matplotlib.font_manager[2874] DEBUG findfont: score(FontEntry(fname='/usr/share/fonts/truetype/dejavu/DejaVuSerifCondensed-Bold.ttf', index=0, name='DejaVu Serif', style='normal', variant='normal', weight=700, stretch='condensed', size='scalable')) = 11.535
2026-07-21 14:55:57 runnervm3jd5f matplotlib.font_manager[2874] DEBUG findfont: score(FontEntry(fname='/usr/share/fonts/truetype/dejavu/DejaVuSerifCondensed-Bold.ttf', index=0, name='DejaVu Serif Condensed', style='normal', variant='normal', weight=700, stretch='condensed', size='scalable')) = 11.535
2026-07-21 14:55:57 runnervm3jd5f matplotlib.font_manager[2874] DEBUG findfont: score(FontEntry(fname='/usr/share/fonts/truetype/dejavu/DejaVuSansCondensed-Oblique.ttf', index=0, name='DejaVu Sans', style='oblique', variant='normal', weight=400, stretch='condensed', size='scalable')) = 10.35
2026-07-21 14:55:57 runnervm3jd5f matplotlib.font_manager[2874] DEBUG findfont: score(FontEntry(fname='/usr/share/fonts/truetype/dejavu/DejaVuSansCondensed-Oblique.ttf', index=0, name='DejaVu Sans Condensed', style='oblique', variant='normal', weight=400, stretch='condensed', size='scalable')) = 10.35
2026-07-21 14:55:57 runnervm3jd5f matplotlib.font_manager[2874] DEBUG findfont: score(FontEntry(fname='/usr/share/fonts/truetype/lato/Lato-SemiboldItalic.ttf', index=0, name='Lato', style='italic', variant='normal', weight=600, stretch='normal', size='scalable')) = 10.24
2026-07-21 14:55:57 runnervm3jd5f matplotlib.font_manager[2874] DEBUG findfont: score(FontEntry(fname='/usr/share/fonts/truetype/lato/Lato-SemiboldItalic.ttf', index=0, name='Lato Semibold', style='italic', variant='normal', weight=400, stretch='normal', size='scalable')) = 10.05
2026-07-21 14:55:57 runnervm3jd5f matplotlib.font_manager[2874] DEBUG findfont: score(FontEntry(fname='/usr/share/fonts/truetype/lato/Lato-Semibold.ttf', index=0, name='Lato', style='normal', variant='normal', weight=600, stretch='normal', size='scalable')) = 11.24
2026-07-21 14:55:57 runnervm3jd5f matplotlib.font_manager[2874] DEBUG findfont: score(FontEntry(fname='/usr/share/fonts/truetype/lato/Lato-Semibold.ttf', index=0, name='Lato Semibold', style='normal', variant='normal', weight=400, stretch='normal', size='scalable')) = 11.05
2026-07-21 14:55:57 runnervm3jd5f matplotlib.font_manager[2874] DEBUG findfont: score(FontEntry(fname='/home/runner/micromamba/envs/trajan/fonts/Inconsolata-Bold.ttf', index=0, name='Inconsolata', style='normal', variant='normal', weight=700, stretch='normal', size='scalable')) = 11.335
2026-07-21 14:55:57 runnervm3jd5f matplotlib.font_manager[2874] DEBUG findfont: score(FontEntry(fname='/usr/share/fonts/truetype/dejavu/DejaVuSans-ExtraLight.ttf', index=0, name='DejaVu Sans', style='normal', variant='normal', weight=200, stretch='normal', size='scalable')) = 11.24
2026-07-21 14:55:57 runnervm3jd5f matplotlib.font_manager[2874] DEBUG findfont: score(FontEntry(fname='/usr/share/fonts/truetype/dejavu/DejaVuSans-ExtraLight.ttf', index=0, name='DejaVu Sans Light', style='normal', variant='normal', weight=200, stretch='normal', size='scalable')) = 11.24
2026-07-21 14:55:57 runnervm3jd5f matplotlib.font_manager[2874] DEBUG findfont: score(FontEntry(fname='/home/runner/micromamba/envs/trajan/fonts/Ubuntu-BI.ttf', index=0, name='Ubuntu', style='italic', variant='normal', weight=700, stretch='normal', size='scalable')) = 10.335
2026-07-21 14:55:57 runnervm3jd5f matplotlib.font_manager[2874] DEBUG findfont: score(FontEntry(fname='/usr/share/fonts/truetype/dejavu/DejaVuSans-BoldOblique.ttf', index=0, name='DejaVu Sans', style='oblique', variant='normal', weight=700, stretch='normal', size='scalable')) = 10.434999999999999
2026-07-21 14:55:57 runnervm3jd5f matplotlib.font_manager[2874] DEBUG findfont: score(FontEntry(fname='/home/runner/micromamba/envs/trajan/fonts/Ubuntu-RI.ttf', index=0, name='Ubuntu', style='italic', variant='normal', weight=400, stretch='normal', size='scalable')) = 10.05
2026-07-21 14:55:57 runnervm3jd5f matplotlib.font_manager[2874] DEBUG findfont: score(FontEntry(fname='/usr/share/fonts/truetype/dejavu/DejaVuSerif-Italic.ttf', index=0, name='DejaVu Serif', style='italic', variant='normal', weight=400, stretch='normal', size='scalable')) = 10.05
2026-07-21 14:55:57 runnervm3jd5f matplotlib.font_manager[2874] DEBUG findfont: score(FontEntry(fname='/home/runner/micromamba/envs/trajan/fonts/SourceCodePro-Medium.ttf', index=0, name='Source Code Pro', style='normal', variant='normal', weight=500, stretch='normal', size='scalable')) = 11.145
2026-07-21 14:55:57 runnervm3jd5f matplotlib.font_manager[2874] DEBUG findfont: score(FontEntry(fname='/home/runner/micromamba/envs/trajan/fonts/SourceCodePro-Medium.ttf', index=0, name='Source Code Pro Medium', style='normal', variant='normal', weight=400, stretch='normal', size='scalable')) = 11.05
2026-07-21 14:55:57 runnervm3jd5f matplotlib.font_manager[2874] DEBUG findfont: score(FontEntry(fname='/usr/share/fonts/truetype/lato/Lato-HeavyItalic.ttf', index=0, name='Lato', style='italic', variant='normal', weight=800, stretch='normal', size='scalable')) = 10.43
2026-07-21 14:55:57 runnervm3jd5f matplotlib.font_manager[2874] DEBUG findfont: score(FontEntry(fname='/usr/share/fonts/truetype/lato/Lato-HeavyItalic.ttf', index=0, name='Lato Heavy', style='italic', variant='normal', weight=400, stretch='normal', size='scalable')) = 10.05
2026-07-21 14:55:57 runnervm3jd5f matplotlib.font_manager[2874] DEBUG findfont: score(FontEntry(fname='/usr/share/fonts/truetype/dejavu/DejaVuSans-Oblique.ttf', index=0, name='DejaVu Sans', style='oblique', variant='normal', weight=400, stretch='normal', size='scalable')) = 10.15
2026-07-21 14:55:57 runnervm3jd5f matplotlib.font_manager[2874] DEBUG findfont: score(FontEntry(fname='/home/runner/micromamba/envs/trajan/fonts/Ubuntu-M.ttf', index=0, name='Ubuntu', style='normal', variant='normal', weight=500, stretch='normal', size='scalable')) = 11.145
2026-07-21 14:55:57 runnervm3jd5f matplotlib.font_manager[2874] DEBUG findfont: score(FontEntry(fname='/home/runner/micromamba/envs/trajan/fonts/Ubuntu-M.ttf', index=0, name='Ubuntu Light', style='normal', variant='normal', weight=700, stretch='normal', size='scalable')) = 11.335
2026-07-21 14:55:57 runnervm3jd5f matplotlib.font_manager[2874] DEBUG findfont: score(FontEntry(fname='/usr/share/fonts/truetype/liberation/LiberationMono-BoldItalic.ttf', index=0, name='Liberation Mono', style='italic', variant='normal', weight=700, stretch='normal', size='scalable')) = 10.335
2026-07-21 14:55:57 runnervm3jd5f matplotlib.font_manager[2874] DEBUG findfont: score(FontEntry(fname='/usr/share/fonts/truetype/dejavu/DejaVuSansMono.ttf', index=0, name='DejaVu Sans Mono', style='normal', variant='normal', weight=400, stretch='normal', size='scalable')) = 11.05
2026-07-21 14:55:57 runnervm3jd5f matplotlib.font_manager[2874] DEBUG findfont: score(FontEntry(fname='/usr/share/fonts/truetype/dejavu/DejaVuMathTeXGyre.ttf', index=0, name='DejaVu Math TeX Gyre', style='normal', variant='normal', weight=400, stretch='normal', size='scalable')) = 11.05
2026-07-21 14:55:57 runnervm3jd5f matplotlib.font_manager[2874] DEBUG findfont: score(FontEntry(fname='/usr/share/fonts/truetype/dejavu/DejaVuSansMono-Oblique.ttf', index=0, name='DejaVu Sans Mono', style='oblique', variant='normal', weight=400, stretch='normal', size='scalable')) = 10.15
2026-07-21 14:55:57 runnervm3jd5f matplotlib.font_manager[2874] DEBUG findfont: score(FontEntry(fname='/home/runner/micromamba/envs/trajan/fonts/Ubuntu-L.ttf', index=0, name='Ubuntu', style='normal', variant='normal', weight=300, stretch='normal', size='scalable')) = 11.145
2026-07-21 14:55:57 runnervm3jd5f matplotlib.font_manager[2874] DEBUG findfont: score(FontEntry(fname='/home/runner/micromamba/envs/trajan/fonts/Ubuntu-L.ttf', index=0, name='Ubuntu Light', style='normal', variant='normal', weight=400, stretch='normal', size='scalable')) = 11.05
2026-07-21 14:55:57 runnervm3jd5f matplotlib.font_manager[2874] DEBUG findfont: score(FontEntry(fname='/home/runner/micromamba/envs/trajan/fonts/SourceCodePro-MediumIt.ttf', index=0, name='Source Code Pro', style='italic', variant='normal', weight=500, stretch='normal', size='scalable')) = 10.145
2026-07-21 14:55:57 runnervm3jd5f matplotlib.font_manager[2874] DEBUG findfont: score(FontEntry(fname='/home/runner/micromamba/envs/trajan/fonts/SourceCodePro-MediumIt.ttf', index=0, name='Source Code Pro Medium', style='italic', variant='normal', weight=400, stretch='normal', size='scalable')) = 10.05
2026-07-21 14:55:57 runnervm3jd5f matplotlib.font_manager[2874] DEBUG findfont: score(FontEntry(fname='/home/runner/micromamba/envs/trajan/fonts/SourceCodePro-Regular.ttf', index=0, name='Source Code Pro', style='normal', variant='normal', weight=400, stretch='normal', size='scalable')) = 11.05
2026-07-21 14:55:57 runnervm3jd5f matplotlib.font_manager[2874] DEBUG findfont: score(FontEntry(fname='/home/runner/micromamba/envs/trajan/fonts/SourceCodePro-SemiboldIt.ttf', index=0, name='Source Code Pro', style='italic', variant='normal', weight=600, stretch='normal', size='scalable')) = 10.24
2026-07-21 14:55:57 runnervm3jd5f matplotlib.font_manager[2874] DEBUG findfont: score(FontEntry(fname='/home/runner/micromamba/envs/trajan/fonts/SourceCodePro-SemiboldIt.ttf', index=0, name='Source Code Pro Semibold', style='italic', variant='normal', weight=400, stretch='normal', size='scalable')) = 10.05
2026-07-21 14:55:57 runnervm3jd5f matplotlib.font_manager[2874] DEBUG findfont: score(FontEntry(fname='/usr/share/fonts/truetype/dejavu/DejaVuSerif.ttf', index=0, name='DejaVu Serif', style='normal', variant='normal', weight=400, stretch='normal', size='scalable')) = 11.05
2026-07-21 14:55:57 runnervm3jd5f matplotlib.font_manager[2874] DEBUG findfont: score(FontEntry(fname='/usr/share/fonts/truetype/dejavu/DejaVuSerif-Bold.ttf', index=0, name='DejaVu Serif', style='normal', variant='normal', weight=700, stretch='normal', size='scalable')) = 11.335
2026-07-21 14:55:57 runnervm3jd5f matplotlib.font_manager[2874] DEBUG findfont: score(FontEntry(fname='/usr/share/fonts/truetype/liberation/LiberationSerif-Italic.ttf', index=0, name='Liberation Serif', style='italic', variant='normal', weight=400, stretch='normal', size='scalable')) = 10.05
2026-07-21 14:55:57 runnervm3jd5f matplotlib.font_manager[2874] DEBUG findfont: score(FontEntry(fname='/usr/share/fonts/truetype/dejavu/DejaVuSansMono-BoldOblique.ttf', index=0, name='DejaVu Sans Mono', style='oblique', variant='normal', weight=700, stretch='normal', size='scalable')) = 10.434999999999999
2026-07-21 14:55:57 runnervm3jd5f matplotlib.font_manager[2874] DEBUG findfont: score(FontEntry(fname='/home/runner/micromamba/envs/trajan/fonts/SourceCodePro-Light.ttf', index=0, name='Source Code Pro', style='normal', variant='normal', weight=300, stretch='normal', size='scalable')) = 11.145
2026-07-21 14:55:57 runnervm3jd5f matplotlib.font_manager[2874] DEBUG findfont: score(FontEntry(fname='/home/runner/micromamba/envs/trajan/fonts/SourceCodePro-Light.ttf', index=0, name='Source Code Pro Light', style='normal', variant='normal', weight=400, stretch='normal', size='scalable')) = 11.05
2026-07-21 14:55:57 runnervm3jd5f matplotlib.font_manager[2874] DEBUG findfont: score(FontEntry(fname='/usr/share/fonts/truetype/liberation/LiberationMono-Italic.ttf', index=0, name='Liberation Mono', style='italic', variant='normal', weight=400, stretch='normal', size='scalable')) = 10.05
2026-07-21 14:55:57 runnervm3jd5f matplotlib.font_manager[2874] DEBUG findfont: Matching STIXNonUnicode:style=italic:variant=normal:weight=normal:stretch=normal:size=10.0 to STIXNonUnicode ('/home/runner/micromamba/envs/trajan/lib/python3.14/site-packages/matplotlib/mpl-data/fonts/ttf/STIXNonUniIta.ttf') with score of 0.050000.
2026-07-21 14:55:57 runnervm3jd5f matplotlib.font_manager[2874] DEBUG findfont: Matching STIXNonUnicode:style=normal:variant=normal:weight=bold:stretch=normal:size=10.0.
2026-07-21 14:55:57 runnervm3jd5f matplotlib.font_manager[2874] DEBUG findfont: score(FontEntry(fname='/home/runner/micromamba/envs/trajan/lib/python3.14/site-packages/matplotlib/mpl-data/fonts/ttf/cmmi10.ttf', index=0, name='cmmi10', style='normal', variant='normal', weight=400, stretch='normal', size='scalable')) = 10.335
2026-07-21 14:55:57 runnervm3jd5f matplotlib.font_manager[2874] DEBUG findfont: score(FontEntry(fname='/home/runner/micromamba/envs/trajan/lib/python3.14/site-packages/matplotlib/mpl-data/fonts/ttf/DejaVuSerif-Bold.ttf', index=0, name='DejaVu Serif', style='normal', variant='normal', weight=700, stretch='normal', size='scalable')) = 10.05
2026-07-21 14:55:57 runnervm3jd5f matplotlib.font_manager[2874] DEBUG findfont: score(FontEntry(fname='/home/runner/micromamba/envs/trajan/lib/python3.14/site-packages/matplotlib/mpl-data/fonts/ttf/DejaVuSans-Oblique.ttf', index=0, name='DejaVu Sans', style='oblique', variant='normal', weight=400, stretch='normal', size='scalable')) = 11.335
2026-07-21 14:55:57 runnervm3jd5f matplotlib.font_manager[2874] DEBUG findfont: score(FontEntry(fname='/home/runner/micromamba/envs/trajan/lib/python3.14/site-packages/matplotlib/mpl-data/fonts/ttf/STIXSizThreeSymReg.ttf', index=0, name='STIXSizeThreeSym', style='normal', variant='normal', weight=400, stretch='normal', size='scalable')) = 10.335
2026-07-21 14:55:57 runnervm3jd5f matplotlib.font_manager[2874] DEBUG findfont: score(FontEntry(fname='/home/runner/micromamba/envs/trajan/lib/python3.14/site-packages/matplotlib/mpl-data/fonts/ttf/STIXNonUniBolIta.ttf', index=0, name='STIXNonUnicode', style='italic', variant='normal', weight=700, stretch='normal', size='scalable')) = 1.05
2026-07-21 14:55:57 runnervm3jd5f matplotlib.font_manager[2874] DEBUG findfont: score(FontEntry(fname='/home/runner/micromamba/envs/trajan/lib/python3.14/site-packages/matplotlib/mpl-data/fonts/ttf/DejaVuSerifDisplay.ttf', index=0, name='DejaVu Serif Display', style='normal', variant='normal', weight=400, stretch='normal', size='scalable')) = 10.335
2026-07-21 14:55:57 runnervm3jd5f matplotlib.font_manager[2874] DEBUG findfont: score(FontEntry(fname='/home/runner/micromamba/envs/trajan/lib/python3.14/site-packages/matplotlib/mpl-data/fonts/ttf/cmss10.ttf', index=0, name='cmss10', style='normal', variant='normal', weight=400, stretch='normal', size='scalable')) = 10.335
2026-07-21 14:55:57 runnervm3jd5f matplotlib.font_manager[2874] DEBUG findfont: score(FontEntry(fname='/home/runner/micromamba/envs/trajan/lib/python3.14/site-packages/matplotlib/mpl-data/fonts/ttf/STIXGeneralBolIta.ttf', index=0, name='STIXGeneral', style='italic', variant='normal', weight=700, stretch='normal', size='scalable')) = 11.05
2026-07-21 14:55:57 runnervm3jd5f matplotlib.font_manager[2874] DEBUG findfont: score(FontEntry(fname='/home/runner/micromamba/envs/trajan/lib/python3.14/site-packages/matplotlib/mpl-data/fonts/ttf/cmtt10.ttf', index=0, name='cmtt10', style='normal', variant='normal', weight=400, stretch='normal', size='scalable')) = 10.335
2026-07-21 14:55:57 runnervm3jd5f matplotlib.font_manager[2874] DEBUG findfont: score(FontEntry(fname='/home/runner/micromamba/envs/trajan/lib/python3.14/site-packages/matplotlib/mpl-data/fonts/ttf/cmsy10.ttf', index=0, name='cmsy10', style='normal', variant='normal', weight=400, stretch='normal', size='scalable')) = 10.335
2026-07-21 14:55:57 runnervm3jd5f matplotlib.font_manager[2874] DEBUG findfont: score(FontEntry(fname='/home/runner/micromamba/envs/trajan/lib/python3.14/site-packages/matplotlib/mpl-data/fonts/ttf/DejaVuSansMono-Oblique.ttf', index=0, name='DejaVu Sans Mono', style='oblique', variant='normal', weight=400, stretch='normal', size='scalable')) = 11.335
2026-07-21 14:55:57 runnervm3jd5f matplotlib.font_manager[2874] DEBUG findfont: score(FontEntry(fname='/home/runner/micromamba/envs/trajan/lib/python3.14/site-packages/matplotlib/mpl-data/fonts/ttf/STIXNonUniIta.ttf', index=0, name='STIXNonUnicode', style='italic', variant='normal', weight=400, stretch='normal', size='scalable')) = 1.335
2026-07-21 14:55:57 runnervm3jd5f matplotlib.font_manager[2874] DEBUG findfont: score(FontEntry(fname='/home/runner/micromamba/envs/trajan/lib/python3.14/site-packages/matplotlib/mpl-data/fonts/ttf/STIXGeneral.ttf', index=0, name='STIXGeneral', style='normal', variant='normal', weight=400, stretch='normal', size='scalable')) = 10.335
2026-07-21 14:55:57 runnervm3jd5f matplotlib.font_manager[2874] DEBUG findfont: score(FontEntry(fname='/home/runner/micromamba/envs/trajan/lib/python3.14/site-packages/matplotlib/mpl-data/fonts/ttf/cmti10.ttf', index=0, name='cmti10', style='normal', variant='normal', weight=400, stretch='normal', size='scalable')) = 10.335
2026-07-21 14:55:57 runnervm3jd5f matplotlib.font_manager[2874] DEBUG findfont: score(FontEntry(fname='/home/runner/micromamba/envs/trajan/lib/python3.14/site-packages/matplotlib/mpl-data/fonts/ttf/DejaVuSansMono-BoldOblique.ttf', index=0, name='DejaVu Sans Mono', style='oblique', variant='normal', weight=700, stretch='normal', size='scalable')) = 11.05
2026-07-21 14:55:57 runnervm3jd5f matplotlib.font_manager[2874] DEBUG findfont: score(FontEntry(fname='/home/runner/micromamba/envs/trajan/lib/python3.14/site-packages/matplotlib/mpl-data/fonts/ttf/DejaVuSerif.ttf', index=0, name='DejaVu Serif', style='normal', variant='normal', weight=400, stretch='normal', size='scalable')) = 10.335
2026-07-21 14:55:57 runnervm3jd5f matplotlib.font_manager[2874] DEBUG findfont: score(FontEntry(fname='/home/runner/micromamba/envs/trajan/lib/python3.14/site-packages/matplotlib/mpl-data/fonts/ttf/LastResortHE-Regular.ttf', index=0, name='Last Resort High-Efficiency', style='normal', variant='normal', weight=400, stretch='normal', size='scalable')) = 10.335
2026-07-21 14:55:57 runnervm3jd5f matplotlib.font_manager[2874] DEBUG findfont: score(FontEntry(fname='/home/runner/micromamba/envs/trajan/lib/python3.14/site-packages/matplotlib/mpl-data/fonts/ttf/cmex10.ttf', index=0, name='cmex10', style='normal', variant='normal', weight=400, stretch='normal', size='scalable')) = 10.335
2026-07-21 14:55:57 runnervm3jd5f matplotlib.font_manager[2874] DEBUG findfont: score(FontEntry(fname='/home/runner/micromamba/envs/trajan/lib/python3.14/site-packages/matplotlib/mpl-data/fonts/ttf/STIXSizFiveSymReg.ttf', index=0, name='STIXSizeFiveSym', style='normal', variant='normal', weight=400, stretch='normal', size='scalable')) = 10.335
2026-07-21 14:55:57 runnervm3jd5f matplotlib.font_manager[2874] DEBUG findfont: score(FontEntry(fname='/home/runner/micromamba/envs/trajan/lib/python3.14/site-packages/matplotlib/mpl-data/fonts/ttf/STIXNonUniBol.ttf', index=0, name='STIXNonUnicode', style='normal', variant='normal', weight=700, stretch='normal', size='scalable')) = 0.05
2026-07-21 14:55:57 runnervm3jd5f matplotlib.font_manager[2874] DEBUG findfont: score(FontEntry(fname='/home/runner/micromamba/envs/trajan/lib/python3.14/site-packages/matplotlib/mpl-data/fonts/ttf/DejaVuSansDisplay.ttf', index=0, name='DejaVu Sans Display', style='normal', variant='normal', weight=400, stretch='normal', size='scalable')) = 10.335
2026-07-21 14:55:57 runnervm3jd5f matplotlib.font_manager[2874] DEBUG findfont: score(FontEntry(fname='/home/runner/micromamba/envs/trajan/lib/python3.14/site-packages/matplotlib/mpl-data/fonts/ttf/DejaVuSansMono.ttf', index=0, name='DejaVu Sans Mono', style='normal', variant='normal', weight=400, stretch='normal', size='scalable')) = 10.335
2026-07-21 14:55:57 runnervm3jd5f matplotlib.font_manager[2874] DEBUG findfont: score(FontEntry(fname='/home/runner/micromamba/envs/trajan/lib/python3.14/site-packages/matplotlib/mpl-data/fonts/ttf/cmb10.ttf', index=0, name='cmb10', style='normal', variant='normal', weight=400, stretch='normal', size='scalable')) = 10.335
2026-07-21 14:55:57 runnervm3jd5f matplotlib.font_manager[2874] DEBUG findfont: score(FontEntry(fname='/home/runner/micromamba/envs/trajan/lib/python3.14/site-packages/matplotlib/mpl-data/fonts/ttf/STIXSizTwoSymReg.ttf', index=0, name='STIXSizeTwoSym', style='normal', variant='normal', weight=400, stretch='normal', size='scalable')) = 10.335
2026-07-21 14:55:57 runnervm3jd5f matplotlib.font_manager[2874] DEBUG findfont: score(FontEntry(fname='/home/runner/micromamba/envs/trajan/lib/python3.14/site-packages/matplotlib/mpl-data/fonts/ttf/DejaVuSans.ttf', index=0, name='DejaVu Sans', style='normal', variant='normal', weight=400, stretch='normal', size='scalable')) = 10.335
2026-07-21 14:55:57 runnervm3jd5f matplotlib.font_manager[2874] DEBUG findfont: score(FontEntry(fname='/home/runner/micromamba/envs/trajan/lib/python3.14/site-packages/matplotlib/mpl-data/fonts/ttf/STIXNonUni.ttf', index=0, name='STIXNonUnicode', style='normal', variant='normal', weight=400, stretch='normal', size='scalable')) = 0.33499999999999996
2026-07-21 14:55:57 runnervm3jd5f matplotlib.font_manager[2874] DEBUG findfont: score(FontEntry(fname='/home/runner/micromamba/envs/trajan/lib/python3.14/site-packages/matplotlib/mpl-data/fonts/ttf/STIXGeneralItalic.ttf', index=0, name='STIXGeneral', style='italic', variant='normal', weight=400, stretch='normal', size='scalable')) = 11.335
2026-07-21 14:55:57 runnervm3jd5f matplotlib.font_manager[2874] DEBUG findfont: score(FontEntry(fname='/home/runner/micromamba/envs/trajan/lib/python3.14/site-packages/matplotlib/mpl-data/fonts/ttf/STIXSizOneSymBol.ttf', index=0, name='STIXSizeOneSym', style='normal', variant='normal', weight=700, stretch='normal', size='scalable')) = 10.05
2026-07-21 14:55:57 runnervm3jd5f matplotlib.font_manager[2874] DEBUG findfont: score(FontEntry(fname='/home/runner/micromamba/envs/trajan/lib/python3.14/site-packages/matplotlib/mpl-data/fonts/ttf/DejaVuSansMono-Bold.ttf', index=0, name='DejaVu Sans Mono', style='normal', variant='normal', weight=700, stretch='normal', size='scalable')) = 10.05
2026-07-21 14:55:57 runnervm3jd5f matplotlib.font_manager[2874] DEBUG findfont: score(FontEntry(fname='/home/runner/micromamba/envs/trajan/lib/python3.14/site-packages/matplotlib/mpl-data/fonts/ttf/STIXSizTwoSymBol.ttf', index=0, name='STIXSizeTwoSym', style='normal', variant='normal', weight=700, stretch='normal', size='scalable')) = 10.05
2026-07-21 14:55:57 runnervm3jd5f matplotlib.font_manager[2874] DEBUG findfont: score(FontEntry(fname='/home/runner/micromamba/envs/trajan/lib/python3.14/site-packages/matplotlib/mpl-data/fonts/ttf/STIXSizThreeSymBol.ttf', index=0, name='STIXSizeThreeSym', style='normal', variant='normal', weight=700, stretch='normal', size='scalable')) = 10.05
2026-07-21 14:55:57 runnervm3jd5f matplotlib.font_manager[2874] DEBUG findfont: score(FontEntry(fname='/home/runner/micromamba/envs/trajan/lib/python3.14/site-packages/matplotlib/mpl-data/fonts/ttf/DejaVuSerif-BoldItalic.ttf', index=0, name='DejaVu Serif', style='italic', variant='normal', weight=700, stretch='normal', size='scalable')) = 11.05
2026-07-21 14:55:57 runnervm3jd5f matplotlib.font_manager[2874] DEBUG findfont: score(FontEntry(fname='/home/runner/micromamba/envs/trajan/lib/python3.14/site-packages/matplotlib/mpl-data/fonts/ttf/DejaVuSerif-Italic.ttf', index=0, name='DejaVu Serif', style='italic', variant='normal', weight=400, stretch='normal', size='scalable')) = 11.335
2026-07-21 14:55:57 runnervm3jd5f matplotlib.font_manager[2874] DEBUG findfont: score(FontEntry(fname='/home/runner/micromamba/envs/trajan/lib/python3.14/site-packages/matplotlib/mpl-data/fonts/ttf/DejaVuSans-Bold.ttf', index=0, name='DejaVu Sans', style='normal', variant='normal', weight=700, stretch='normal', size='scalable')) = 10.05
2026-07-21 14:55:57 runnervm3jd5f matplotlib.font_manager[2874] DEBUG findfont: score(FontEntry(fname='/home/runner/micromamba/envs/trajan/lib/python3.14/site-packages/matplotlib/mpl-data/fonts/ttf/STIXSizFourSymBol.ttf', index=0, name='STIXSizeFourSym', style='normal', variant='normal', weight=700, stretch='normal', size='scalable')) = 10.05
2026-07-21 14:55:57 runnervm3jd5f matplotlib.font_manager[2874] DEBUG findfont: score(FontEntry(fname='/home/runner/micromamba/envs/trajan/lib/python3.14/site-packages/matplotlib/mpl-data/fonts/ttf/STIXSizOneSymReg.ttf', index=0, name='STIXSizeOneSym', style='normal', variant='normal', weight=400, stretch='normal', size='scalable')) = 10.335
2026-07-21 14:55:57 runnervm3jd5f matplotlib.font_manager[2874] DEBUG findfont: score(FontEntry(fname='/home/runner/micromamba/envs/trajan/lib/python3.14/site-packages/matplotlib/mpl-data/fonts/ttf/cmr10.ttf', index=0, name='cmr10', style='normal', variant='normal', weight=400, stretch='normal', size='scalable')) = 10.335
2026-07-21 14:55:57 runnervm3jd5f matplotlib.font_manager[2874] DEBUG findfont: score(FontEntry(fname='/home/runner/micromamba/envs/trajan/lib/python3.14/site-packages/matplotlib/mpl-data/fonts/ttf/STIXGeneralBol.ttf', index=0, name='STIXGeneral', style='normal', variant='normal', weight=700, stretch='normal', size='scalable')) = 10.05
2026-07-21 14:55:57 runnervm3jd5f matplotlib.font_manager[2874] DEBUG findfont: score(FontEntry(fname='/home/runner/micromamba/envs/trajan/lib/python3.14/site-packages/matplotlib/mpl-data/fonts/ttf/DejaVuSans-BoldOblique.ttf', index=0, name='DejaVu Sans', style='oblique', variant='normal', weight=700, stretch='normal', size='scalable')) = 11.05
2026-07-21 14:55:57 runnervm3jd5f matplotlib.font_manager[2874] DEBUG findfont: score(FontEntry(fname='/home/runner/micromamba/envs/trajan/lib/python3.14/site-packages/matplotlib/mpl-data/fonts/ttf/STIXSizFourSymReg.ttf', index=0, name='STIXSizeFourSym', style='normal', variant='normal', weight=400, stretch='normal', size='scalable')) = 10.335
2026-07-21 14:55:57 runnervm3jd5f matplotlib.font_manager[2874] DEBUG findfont: score(FontEntry(fname='/usr/share/fonts/truetype/lato/Lato-Black.ttf', index=0, name='Lato', style='normal', variant='normal', weight=900, stretch='normal', size='scalable')) = 10.24
2026-07-21 14:55:57 runnervm3jd5f matplotlib.font_manager[2874] DEBUG findfont: score(FontEntry(fname='/usr/share/fonts/truetype/lato/Lato-Black.ttf', index=0, name='Lato Black', style='normal', variant='normal', weight=400, stretch='normal', size='scalable')) = 10.335
2026-07-21 14:55:57 runnervm3jd5f matplotlib.font_manager[2874] DEBUG findfont: score(FontEntry(fname='/usr/share/fonts/truetype/liberation/LiberationSerif-Regular.ttf', index=0, name='Liberation Serif', style='normal', variant='normal', weight=400, stretch='normal', size='scalable')) = 10.335
2026-07-21 14:55:57 runnervm3jd5f matplotlib.font_manager[2874] DEBUG findfont: score(FontEntry(fname='/usr/share/fonts/truetype/dejavu/DejaVuSerifCondensed.ttf', index=0, name='DejaVu Serif', style='normal', variant='normal', weight=400, stretch='condensed', size='scalable')) = 10.535
2026-07-21 14:55:57 runnervm3jd5f matplotlib.font_manager[2874] DEBUG findfont: score(FontEntry(fname='/usr/share/fonts/truetype/dejavu/DejaVuSerifCondensed.ttf', index=0, name='DejaVu Serif Condensed', style='normal', variant='normal', weight=380, stretch='condensed', size='scalable')) = 10.553999999999998
2026-07-21 14:55:57 runnervm3jd5f matplotlib.font_manager[2874] DEBUG findfont: score(FontEntry(fname='/home/runner/micromamba/envs/trajan/fonts/UbuntuMono-BI.ttf', index=0, name='Ubuntu Mono', style='italic', variant='normal', weight=700, stretch='normal', size='scalable')) = 11.05
2026-07-21 14:55:57 runnervm3jd5f matplotlib.font_manager[2874] DEBUG findfont: score(FontEntry(fname='/usr/share/fonts/truetype/dejavu/DejaVuSans.ttf', index=0, name='DejaVu Sans', style='normal', variant='normal', weight=400, stretch='normal', size='scalable')) = 10.335
2026-07-21 14:55:57 runnervm3jd5f matplotlib.font_manager[2874] DEBUG findfont: score(FontEntry(fname='/usr/share/fonts/truetype/lato/Lato-Italic.ttf', index=0, name='Lato', style='italic', variant='normal', weight=400, stretch='normal', size='scalable')) = 11.335
2026-07-21 14:55:57 runnervm3jd5f matplotlib.font_manager[2874] DEBUG findfont: score(FontEntry(fname='/usr/share/fonts/truetype/liberation/LiberationSans-Italic.ttf', index=0, name='Liberation Sans', style='italic', variant='normal', weight=400, stretch='normal', size='scalable')) = 11.335
2026-07-21 14:55:57 runnervm3jd5f matplotlib.font_manager[2874] DEBUG findfont: score(FontEntry(fname='/home/runner/micromamba/envs/trajan/fonts/Ubuntu-B.ttf', index=0, name='Ubuntu', style='normal', variant='normal', weight=700, stretch='normal', size='scalable')) = 10.05
2026-07-21 14:55:57 runnervm3jd5f matplotlib.font_manager[2874] DEBUG findfont: score(FontEntry(fname='/home/runner/micromamba/envs/trajan/fonts/SourceCodePro-Semibold.ttf', index=0, name='Source Code Pro', style='normal', variant='normal', weight=600, stretch='normal', size='scalable')) = 10.145
2026-07-21 14:55:57 runnervm3jd5f matplotlib.font_manager[2874] DEBUG findfont: score(FontEntry(fname='/home/runner/micromamba/envs/trajan/fonts/SourceCodePro-Semibold.ttf', index=0, name='Source Code Pro Semibold', style='normal', variant='normal', weight=400, stretch='normal', size='scalable')) = 10.335
2026-07-21 14:55:57 runnervm3jd5f matplotlib.font_manager[2874] DEBUG findfont: score(FontEntry(fname='/home/runner/micromamba/envs/trajan/fonts/SourceCodePro-Bold.ttf', index=0, name='Source Code Pro', style='normal', variant='normal', weight=700, stretch='normal', size='scalable')) = 10.05
2026-07-21 14:55:57 runnervm3jd5f matplotlib.font_manager[2874] DEBUG findfont: score(FontEntry(fname='/home/runner/micromamba/envs/trajan/fonts/Ubuntu-MI.ttf', index=0, name='Ubuntu', style='italic', variant='normal', weight=500, stretch='normal', size='scalable')) = 11.24
2026-07-21 14:55:57 runnervm3jd5f matplotlib.font_manager[2874] DEBUG findfont: score(FontEntry(fname='/home/runner/micromamba/envs/trajan/fonts/Ubuntu-MI.ttf', index=0, name='Ubuntu Light', style='italic', variant='normal', weight=700, stretch='normal', size='scalable')) = 11.05
2026-07-21 14:55:57 runnervm3jd5f matplotlib.font_manager[2874] DEBUG findfont: score(FontEntry(fname='/usr/share/fonts/truetype/lato/Lato-Regular.ttf', index=0, name='Lato', style='normal', variant='normal', weight=400, stretch='normal', size='scalable')) = 10.335
2026-07-21 14:55:57 runnervm3jd5f matplotlib.font_manager[2874] DEBUG findfont: score(FontEntry(fname='/usr/share/fonts/truetype/lato/Lato-ThinItalic.ttf', index=0, name='Lato', style='italic', variant='normal', weight=275, stretch='normal', size='scalable')) = 11.45375
2026-07-21 14:55:57 runnervm3jd5f matplotlib.font_manager[2874] DEBUG findfont: score(FontEntry(fname='/usr/share/fonts/truetype/lato/Lato-ThinItalic.ttf', index=0, name='Lato Thin', style='italic', variant='normal', weight=400, stretch='normal', size='scalable')) = 11.335
2026-07-21 14:55:57 runnervm3jd5f matplotlib.font_manager[2874] DEBUG findfont: score(FontEntry(fname='/usr/share/fonts/truetype/lato/Lato-BlackItalic.ttf', index=0, name='Lato', style='italic', variant='normal', weight=900, stretch='normal', size='scalable')) = 11.24
2026-07-21 14:55:57 runnervm3jd5f matplotlib.font_manager[2874] DEBUG findfont: score(FontEntry(fname='/usr/share/fonts/truetype/lato/Lato-BlackItalic.ttf', index=0, name='Lato Black', style='italic', variant='normal', weight=400, stretch='normal', size='scalable')) = 11.335
2026-07-21 14:55:57 runnervm3jd5f matplotlib.font_manager[2874] DEBUG findfont: score(FontEntry(fname='/usr/share/fonts/truetype/dejavu/DejaVuSerifCondensed-Italic.ttf', index=0, name='DejaVu Serif', style='italic', variant='normal', weight=400, stretch='condensed', size='scalable')) = 11.535
2026-07-21 14:55:57 runnervm3jd5f matplotlib.font_manager[2874] DEBUG findfont: score(FontEntry(fname='/usr/share/fonts/truetype/dejavu/DejaVuSerifCondensed-Italic.ttf', index=0, name='DejaVu Serif Condensed', style='italic', variant='normal', weight=400, stretch='condensed', size='scalable')) = 11.535
2026-07-21 14:55:57 runnervm3jd5f matplotlib.font_manager[2874] DEBUG findfont: score(FontEntry(fname='/usr/share/fonts/truetype/dejavu/DejaVuSans-Bold.ttf', index=0, name='DejaVu Sans', style='normal', variant='normal', weight=700, stretch='normal', size='scalable')) = 10.05
2026-07-21 14:55:57 runnervm3jd5f matplotlib.font_manager[2874] DEBUG findfont: score(FontEntry(fname='/home/runner/micromamba/envs/trajan/fonts/UbuntuMono-R.ttf', index=0, name='Ubuntu Mono', style='normal', variant='normal', weight=400, stretch='normal', size='scalable')) = 10.335
2026-07-21 14:55:57 runnervm3jd5f matplotlib.font_manager[2874] DEBUG findfont: score(FontEntry(fname='/usr/share/fonts/truetype/dejavu/DejaVuSerif-BoldItalic.ttf', index=0, name='DejaVu Serif', style='italic', variant='normal', weight=700, stretch='normal', size='scalable')) = 11.05
2026-07-21 14:55:57 runnervm3jd5f matplotlib.font_manager[2874] DEBUG findfont: score(FontEntry(fname='/usr/share/fonts/truetype/lato/Lato-Hairline.ttf', index=0, name='Lato', style='normal', variant='normal', weight=250, stretch='normal', size='scalable')) = 10.4775
2026-07-21 14:55:57 runnervm3jd5f matplotlib.font_manager[2874] DEBUG findfont: score(FontEntry(fname='/usr/share/fonts/truetype/lato/Lato-Hairline.ttf', index=0, name='Lato Hairline', style='normal', variant='normal', weight=400, stretch='normal', size='scalable')) = 10.335
2026-07-21 14:55:57 runnervm3jd5f matplotlib.font_manager[2874] DEBUG findfont: score(FontEntry(fname='/usr/share/fonts/truetype/lato/Lato-LightItalic.ttf', index=0, name='Lato', style='italic', variant='normal', weight=300, stretch='normal', size='scalable')) = 11.43
2026-07-21 14:55:57 runnervm3jd5f matplotlib.font_manager[2874] DEBUG findfont: score(FontEntry(fname='/usr/share/fonts/truetype/lato/Lato-LightItalic.ttf', index=0, name='Lato Light', style='italic', variant='normal', weight=400, stretch='normal', size='scalable')) = 11.335
2026-07-21 14:55:57 runnervm3jd5f matplotlib.font_manager[2874] DEBUG findfont: score(FontEntry(fname='/usr/share/fonts/truetype/dejavu/DejaVuSansCondensed-BoldOblique.ttf', index=0, name='DejaVu Sans', style='oblique', variant='normal', weight=700, stretch='condensed', size='scalable')) = 11.25
2026-07-21 14:55:57 runnervm3jd5f matplotlib.font_manager[2874] DEBUG findfont: score(FontEntry(fname='/usr/share/fonts/truetype/dejavu/DejaVuSansCondensed-BoldOblique.ttf', index=0, name='DejaVu Sans Condensed', style='oblique', variant='normal', weight=700, stretch='condensed', size='scalable')) = 11.25
2026-07-21 14:55:57 runnervm3jd5f matplotlib.font_manager[2874] DEBUG findfont: score(FontEntry(fname='/home/runner/micromamba/envs/trajan/fonts/SourceCodePro-It.ttf', index=0, name='Source Code Pro', style='italic', variant='normal', weight=400, stretch='normal', size='scalable')) = 11.335
2026-07-21 14:55:57 runnervm3jd5f matplotlib.font_manager[2874] DEBUG findfont: score(FontEntry(fname='/home/runner/micromamba/envs/trajan/fonts/SourceCodePro-ExtraLightIt.ttf', index=0, name='Source Code Pro', style='italic', variant='normal', weight=200, stretch='normal', size='scalable')) = 11.525
2026-07-21 14:55:57 runnervm3jd5f matplotlib.font_manager[2874] DEBUG findfont: score(FontEntry(fname='/home/runner/micromamba/envs/trajan/fonts/SourceCodePro-ExtraLightIt.ttf', index=0, name='Source Code Pro ExtraLight', style='italic', variant='normal', weight=400, stretch='normal', size='scalable')) = 11.335
2026-07-21 14:55:57 runnervm3jd5f matplotlib.font_manager[2874] DEBUG findfont: score(FontEntry(fname='/usr/share/fonts/truetype/lato/Lato-Medium.ttf', index=0, name='Lato', style='normal', variant='normal', weight=500, stretch='normal', size='scalable')) = 10.24
2026-07-21 14:55:57 runnervm3jd5f matplotlib.font_manager[2874] DEBUG findfont: score(FontEntry(fname='/usr/share/fonts/truetype/lato/Lato-Medium.ttf', index=0, name='Lato Medium', style='normal', variant='normal', weight=400, stretch='normal', size='scalable')) = 10.335
2026-07-21 14:55:57 runnervm3jd5f matplotlib.font_manager[2874] DEBUG findfont: score(FontEntry(fname='/usr/share/fonts/truetype/lato/Lato-BoldItalic.ttf', index=0, name='Lato', style='italic', variant='normal', weight=700, stretch='normal', size='scalable')) = 11.05
2026-07-21 14:55:57 runnervm3jd5f matplotlib.font_manager[2874] DEBUG findfont: score(FontEntry(fname='/home/runner/micromamba/envs/trajan/fonts/DejaVuSans.ttf', index=0, name='DejaVu Sans', style='normal', variant='normal', weight=400, stretch='normal', size='scalable')) = 10.335
2026-07-21 14:55:57 runnervm3jd5f matplotlib.font_manager[2874] DEBUG findfont: score(FontEntry(fname='/home/runner/micromamba/envs/trajan/fonts/UbuntuMono-B.ttf', index=0, name='Ubuntu Mono', style='normal', variant='normal', weight=700, stretch='normal', size='scalable')) = 10.05
2026-07-21 14:55:57 runnervm3jd5f matplotlib.font_manager[2874] DEBUG findfont: score(FontEntry(fname='/home/runner/micromamba/envs/trajan/fonts/SourceCodePro-LightIt.ttf', index=0, name='Source Code Pro', style='italic', variant='normal', weight=300, stretch='normal', size='scalable')) = 11.43
2026-07-21 14:55:57 runnervm3jd5f matplotlib.font_manager[2874] DEBUG findfont: score(FontEntry(fname='/home/runner/micromamba/envs/trajan/fonts/SourceCodePro-LightIt.ttf', index=0, name='Source Code Pro Light', style='italic', variant='normal', weight=400, stretch='normal', size='scalable')) = 11.335
2026-07-21 14:55:57 runnervm3jd5f matplotlib.font_manager[2874] DEBUG findfont: score(FontEntry(fname='/usr/share/fonts/truetype/liberation/LiberationSans-BoldItalic.ttf', index=0, name='Liberation Sans', style='italic', variant='normal', weight=700, stretch='normal', size='scalable')) = 11.05
2026-07-21 14:55:57 runnervm3jd5f matplotlib.font_manager[2874] DEBUG findfont: score(FontEntry(fname='/usr/share/fonts/truetype/liberation/LiberationSans-Regular.ttf', index=0, name='Liberation Sans', style='normal', variant='normal', weight=400, stretch='normal', size='scalable')) = 10.335
2026-07-21 14:55:57 runnervm3jd5f matplotlib.font_manager[2874] DEBUG findfont: score(FontEntry(fname='/usr/share/fonts/truetype/dejavu/DejaVuSansMono-Bold.ttf', index=0, name='DejaVu Sans Mono', style='normal', variant='normal', weight=700, stretch='normal', size='scalable')) = 10.05
2026-07-21 14:55:57 runnervm3jd5f matplotlib.font_manager[2874] DEBUG findfont: score(FontEntry(fname='/home/runner/micromamba/envs/trajan/fonts/SourceCodePro-BoldIt.ttf', index=0, name='Source Code Pro', style='italic', variant='normal', weight=700, stretch='normal', size='scalable')) = 11.05
2026-07-21 14:55:57 runnervm3jd5f matplotlib.font_manager[2874] DEBUG findfont: score(FontEntry(fname='/usr/share/fonts/truetype/lato/Lato-Bold.ttf', index=0, name='Lato', style='normal', variant='normal', weight=700, stretch='normal', size='scalable')) = 10.05
2026-07-21 14:55:57 runnervm3jd5f matplotlib.font_manager[2874] DEBUG findfont: score(FontEntry(fname='/usr/share/fonts/truetype/dejavu/DejaVuSansCondensed.ttf', index=0, name='DejaVu Sans', style='normal', variant='normal', weight=400, stretch='condensed', size='scalable')) = 10.535
2026-07-21 14:55:57 runnervm3jd5f matplotlib.font_manager[2874] DEBUG findfont: score(FontEntry(fname='/usr/share/fonts/truetype/dejavu/DejaVuSansCondensed.ttf', index=0, name='DejaVu Sans Condensed', style='normal', variant='normal', weight=380, stretch='condensed', size='scalable')) = 10.553999999999998
2026-07-21 14:55:57 runnervm3jd5f matplotlib.font_manager[2874] DEBUG findfont: score(FontEntry(fname='/usr/share/fonts/truetype/lato/Lato-MediumItalic.ttf', index=0, name='Lato', style='italic', variant='normal', weight=500, stretch='normal', size='scalable')) = 11.24
2026-07-21 14:55:57 runnervm3jd5f matplotlib.font_manager[2874] DEBUG findfont: score(FontEntry(fname='/usr/share/fonts/truetype/lato/Lato-MediumItalic.ttf', index=0, name='Lato Medium', style='italic', variant='normal', weight=400, stretch='normal', size='scalable')) = 11.335
2026-07-21 14:55:57 runnervm3jd5f matplotlib.font_manager[2874] DEBUG findfont: score(FontEntry(fname='/usr/share/fonts/truetype/liberation/LiberationSans-Bold.ttf', index=0, name='Liberation Sans', style='normal', variant='normal', weight=700, stretch='normal', size='scalable')) = 10.05
2026-07-21 14:55:57 runnervm3jd5f matplotlib.font_manager[2874] DEBUG findfont: score(FontEntry(fname='/usr/share/fonts/truetype/dejavu/DejaVuSerifCondensed-BoldItalic.ttf', index=0, name='DejaVu Serif', style='italic', variant='normal', weight=700, stretch='condensed', size='scalable')) = 11.25
2026-07-21 14:55:57 runnervm3jd5f matplotlib.font_manager[2874] DEBUG findfont: score(FontEntry(fname='/usr/share/fonts/truetype/dejavu/DejaVuSerifCondensed-BoldItalic.ttf', index=0, name='DejaVu Serif Condensed', style='italic', variant='normal', weight=700, stretch='condensed', size='scalable')) = 11.25
2026-07-21 14:55:57 runnervm3jd5f matplotlib.font_manager[2874] DEBUG findfont: score(FontEntry(fname='/home/runner/micromamba/envs/trajan/fonts/Ubuntu-R.ttf', index=0, name='Ubuntu', style='normal', variant='normal', weight=400, stretch='normal', size='scalable')) = 10.335
2026-07-21 14:55:57 runnervm3jd5f matplotlib.font_manager[2874] DEBUG findfont: score(FontEntry(fname='/usr/share/fonts/truetype/lato/Lato-Light.ttf', index=0, name='Lato', style='normal', variant='normal', weight=300, stretch='normal', size='scalable')) = 10.43
2026-07-21 14:55:57 runnervm3jd5f matplotlib.font_manager[2874] DEBUG findfont: score(FontEntry(fname='/usr/share/fonts/truetype/lato/Lato-Light.ttf', index=0, name='Lato Light', style='normal', variant='normal', weight=400, stretch='normal', size='scalable')) = 10.335
2026-07-21 14:55:57 runnervm3jd5f matplotlib.font_manager[2874] DEBUG findfont: score(FontEntry(fname='/usr/share/fonts/truetype/liberation/LiberationSerif-BoldItalic.ttf', index=0, name='Liberation Serif', style='italic', variant='normal', weight=700, stretch='normal', size='scalable')) = 11.05
2026-07-21 14:55:57 runnervm3jd5f matplotlib.font_manager[2874] DEBUG findfont: score(FontEntry(fname='/home/runner/micromamba/envs/trajan/fonts/Ubuntu-Th.ttf', index=0, name='Ubuntu', style='normal', variant='normal', weight=250, stretch='normal', size='scalable')) = 10.4775
2026-07-21 14:55:57 runnervm3jd5f matplotlib.font_manager[2874] DEBUG findfont: score(FontEntry(fname='/home/runner/micromamba/envs/trajan/fonts/Ubuntu-Th.ttf', index=0, name='Ubuntu Thin', style='normal', variant='normal', weight=400, stretch='normal', size='scalable')) = 10.335
2026-07-21 14:55:57 runnervm3jd5f matplotlib.font_manager[2874] DEBUG findfont: score(FontEntry(fname='/home/runner/micromamba/envs/trajan/fonts/SourceCodePro-ExtraLight.ttf', index=0, name='Source Code Pro', style='normal', variant='normal', weight=200, stretch='normal', size='scalable')) = 10.525
2026-07-21 14:55:57 runnervm3jd5f matplotlib.font_manager[2874] DEBUG findfont: score(FontEntry(fname='/home/runner/micromamba/envs/trajan/fonts/SourceCodePro-ExtraLight.ttf', index=0, name='Source Code Pro ExtraLight', style='normal', variant='normal', weight=400, stretch='normal', size='scalable')) = 10.335
2026-07-21 14:55:57 runnervm3jd5f matplotlib.font_manager[2874] DEBUG findfont: score(FontEntry(fname='/usr/share/fonts/truetype/lato/Lato-Thin.ttf', index=0, name='Lato', style='normal', variant='normal', weight=275, stretch='normal', size='scalable')) = 10.45375
2026-07-21 14:55:57 runnervm3jd5f matplotlib.font_manager[2874] DEBUG findfont: score(FontEntry(fname='/usr/share/fonts/truetype/lato/Lato-Thin.ttf', index=0, name='Lato Thin', style='normal', variant='normal', weight=400, stretch='normal', size='scalable')) = 10.335
2026-07-21 14:55:57 runnervm3jd5f matplotlib.font_manager[2874] DEBUG findfont: score(FontEntry(fname='/usr/share/fonts/truetype/liberation/LiberationSerif-Bold.ttf', index=0, name='Liberation Serif', style='normal', variant='normal', weight=700, stretch='normal', size='scalable')) = 10.05
2026-07-21 14:55:57 runnervm3jd5f matplotlib.font_manager[2874] DEBUG findfont: score(FontEntry(fname='/home/runner/micromamba/envs/trajan/fonts/Inconsolata-Regular.ttf', index=0, name='Inconsolata', style='normal', variant='normal', weight=400, stretch='normal', size='scalable')) = 10.335
2026-07-21 14:55:57 runnervm3jd5f matplotlib.font_manager[2874] DEBUG findfont: score(FontEntry(fname='/home/runner/micromamba/envs/trajan/fonts/Ubuntu-C.ttf', index=0, name='Ubuntu Condensed', style='normal', variant='normal', weight=400, stretch='condensed', size='scalable')) = 10.535
2026-07-21 14:55:57 runnervm3jd5f matplotlib.font_manager[2874] DEBUG findfont: score(FontEntry(fname='/usr/share/fonts/truetype/dejavu/DejaVuSansCondensed-Bold.ttf', index=0, name='DejaVu Sans', style='normal', variant='normal', weight=700, stretch='condensed', size='scalable')) = 10.25
2026-07-21 14:55:57 runnervm3jd5f matplotlib.font_manager[2874] DEBUG findfont: score(FontEntry(fname='/usr/share/fonts/truetype/dejavu/DejaVuSansCondensed-Bold.ttf', index=0, name='DejaVu Sans Condensed', style='normal', variant='normal', weight=700, stretch='condensed', size='scalable')) = 10.25
2026-07-21 14:55:57 runnervm3jd5f matplotlib.font_manager[2874] DEBUG findfont: score(FontEntry(fname='/usr/share/fonts/truetype/liberation/LiberationMono-Bold.ttf', index=0, name='Liberation Mono', style='normal', variant='normal', weight=700, stretch='normal', size='scalable')) = 10.05
2026-07-21 14:55:57 runnervm3jd5f matplotlib.font_manager[2874] DEBUG findfont: score(FontEntry(fname='/home/runner/micromamba/envs/trajan/fonts/SourceCodePro-Black.ttf', index=0, name='Source Code Pro', style='normal', variant='normal', weight=900, stretch='normal', size='scalable')) = 10.24
2026-07-21 14:55:57 runnervm3jd5f matplotlib.font_manager[2874] DEBUG findfont: score(FontEntry(fname='/home/runner/micromamba/envs/trajan/fonts/SourceCodePro-Black.ttf', index=0, name='Source Code Pro Black', style='normal', variant='normal', weight=400, stretch='normal', size='scalable')) = 10.335
2026-07-21 14:55:57 runnervm3jd5f matplotlib.font_manager[2874] DEBUG findfont: score(FontEntry(fname='/home/runner/micromamba/envs/trajan/fonts/SourceCodePro-BlackIt.ttf', index=0, name='Source Code Pro', style='italic', variant='normal', weight=900, stretch='normal', size='scalable')) = 11.24
2026-07-21 14:55:57 runnervm3jd5f matplotlib.font_manager[2874] DEBUG findfont: score(FontEntry(fname='/home/runner/micromamba/envs/trajan/fonts/SourceCodePro-BlackIt.ttf', index=0, name='Source Code Pro Black', style='italic', variant='normal', weight=400, stretch='normal', size='scalable')) = 11.335
2026-07-21 14:55:57 runnervm3jd5f matplotlib.font_manager[2874] DEBUG findfont: score(FontEntry(fname='/home/runner/micromamba/envs/trajan/fonts/Ubuntu-LI.ttf', index=0, name='Ubuntu', style='italic', variant='normal', weight=300, stretch='normal', size='scalable')) = 11.43
2026-07-21 14:55:57 runnervm3jd5f matplotlib.font_manager[2874] DEBUG findfont: score(FontEntry(fname='/home/runner/micromamba/envs/trajan/fonts/Ubuntu-LI.ttf', index=0, name='Ubuntu Light', style='italic', variant='normal', weight=400, stretch='normal', size='scalable')) = 11.335
2026-07-21 14:55:57 runnervm3jd5f matplotlib.font_manager[2874] DEBUG findfont: score(FontEntry(fname='/usr/share/fonts/truetype/liberation/LiberationMono-Regular.ttf', index=0, name='Liberation Mono', style='normal', variant='normal', weight=400, stretch='normal', size='scalable')) = 10.335
2026-07-21 14:55:57 runnervm3jd5f matplotlib.font_manager[2874] DEBUG findfont: score(FontEntry(fname='/home/runner/micromamba/envs/trajan/fonts/UbuntuMono-RI.ttf', index=0, name='Ubuntu Mono', style='italic', variant='normal', weight=400, stretch='normal', size='scalable')) = 11.335
2026-07-21 14:55:57 runnervm3jd5f matplotlib.font_manager[2874] DEBUG findfont: score(FontEntry(fname='/usr/share/fonts/truetype/lato/Lato-Heavy.ttf', index=0, name='Lato', style='normal', variant='normal', weight=800, stretch='normal', size='scalable')) = 10.145
2026-07-21 14:55:57 runnervm3jd5f matplotlib.font_manager[2874] DEBUG findfont: score(FontEntry(fname='/usr/share/fonts/truetype/lato/Lato-Heavy.ttf', index=0, name='Lato Heavy', style='normal', variant='normal', weight=400, stretch='normal', size='scalable')) = 10.335
2026-07-21 14:55:57 runnervm3jd5f matplotlib.font_manager[2874] DEBUG findfont: score(FontEntry(fname='/usr/share/fonts/truetype/lato/Lato-HairlineItalic.ttf', index=0, name='Lato', style='italic', variant='normal', weight=250, stretch='normal', size='scalable')) = 11.4775
2026-07-21 14:55:57 runnervm3jd5f matplotlib.font_manager[2874] DEBUG findfont: score(FontEntry(fname='/usr/share/fonts/truetype/lato/Lato-HairlineItalic.ttf', index=0, name='Lato Hairline', style='italic', variant='normal', weight=400, stretch='normal', size='scalable')) = 11.335
2026-07-21 14:55:57 runnervm3jd5f matplotlib.font_manager[2874] DEBUG findfont: score(FontEntry(fname='/usr/share/fonts/truetype/dejavu/DejaVuSerifCondensed-Bold.ttf', index=0, name='DejaVu Serif', style='normal', variant='normal', weight=700, stretch='condensed', size='scalable')) = 10.25
2026-07-21 14:55:57 runnervm3jd5f matplotlib.font_manager[2874] DEBUG findfont: score(FontEntry(fname='/usr/share/fonts/truetype/dejavu/DejaVuSerifCondensed-Bold.ttf', index=0, name='DejaVu Serif Condensed', style='normal', variant='normal', weight=700, stretch='condensed', size='scalable')) = 10.25
2026-07-21 14:55:57 runnervm3jd5f matplotlib.font_manager[2874] DEBUG findfont: score(FontEntry(fname='/usr/share/fonts/truetype/dejavu/DejaVuSansCondensed-Oblique.ttf', index=0, name='DejaVu Sans', style='oblique', variant='normal', weight=400, stretch='condensed', size='scalable')) = 11.535
2026-07-21 14:55:57 runnervm3jd5f matplotlib.font_manager[2874] DEBUG findfont: score(FontEntry(fname='/usr/share/fonts/truetype/dejavu/DejaVuSansCondensed-Oblique.ttf', index=0, name='DejaVu Sans Condensed', style='oblique', variant='normal', weight=400, stretch='condensed', size='scalable')) = 11.535
2026-07-21 14:55:57 runnervm3jd5f matplotlib.font_manager[2874] DEBUG findfont: score(FontEntry(fname='/usr/share/fonts/truetype/lato/Lato-SemiboldItalic.ttf', index=0, name='Lato', style='italic', variant='normal', weight=600, stretch='normal', size='scalable')) = 11.145
2026-07-21 14:55:57 runnervm3jd5f matplotlib.font_manager[2874] DEBUG findfont: score(FontEntry(fname='/usr/share/fonts/truetype/lato/Lato-SemiboldItalic.ttf', index=0, name='Lato Semibold', style='italic', variant='normal', weight=400, stretch='normal', size='scalable')) = 11.335
2026-07-21 14:55:57 runnervm3jd5f matplotlib.font_manager[2874] DEBUG findfont: score(FontEntry(fname='/usr/share/fonts/truetype/lato/Lato-Semibold.ttf', index=0, name='Lato', style='normal', variant='normal', weight=600, stretch='normal', size='scalable')) = 10.145
2026-07-21 14:55:57 runnervm3jd5f matplotlib.font_manager[2874] DEBUG findfont: score(FontEntry(fname='/usr/share/fonts/truetype/lato/Lato-Semibold.ttf', index=0, name='Lato Semibold', style='normal', variant='normal', weight=400, stretch='normal', size='scalable')) = 10.335
2026-07-21 14:55:57 runnervm3jd5f matplotlib.font_manager[2874] DEBUG findfont: score(FontEntry(fname='/home/runner/micromamba/envs/trajan/fonts/Inconsolata-Bold.ttf', index=0, name='Inconsolata', style='normal', variant='normal', weight=700, stretch='normal', size='scalable')) = 10.05
2026-07-21 14:55:57 runnervm3jd5f matplotlib.font_manager[2874] DEBUG findfont: score(FontEntry(fname='/usr/share/fonts/truetype/dejavu/DejaVuSans-ExtraLight.ttf', index=0, name='DejaVu Sans', style='normal', variant='normal', weight=200, stretch='normal', size='scalable')) = 10.525
2026-07-21 14:55:57 runnervm3jd5f matplotlib.font_manager[2874] DEBUG findfont: score(FontEntry(fname='/usr/share/fonts/truetype/dejavu/DejaVuSans-ExtraLight.ttf', index=0, name='DejaVu Sans Light', style='normal', variant='normal', weight=200, stretch='normal', size='scalable')) = 10.525
2026-07-21 14:55:57 runnervm3jd5f matplotlib.font_manager[2874] DEBUG findfont: score(FontEntry(fname='/home/runner/micromamba/envs/trajan/fonts/Ubuntu-BI.ttf', index=0, name='Ubuntu', style='italic', variant='normal', weight=700, stretch='normal', size='scalable')) = 11.05
2026-07-21 14:55:57 runnervm3jd5f matplotlib.font_manager[2874] DEBUG findfont: score(FontEntry(fname='/usr/share/fonts/truetype/dejavu/DejaVuSans-BoldOblique.ttf', index=0, name='DejaVu Sans', style='oblique', variant='normal', weight=700, stretch='normal', size='scalable')) = 11.05
2026-07-21 14:55:57 runnervm3jd5f matplotlib.font_manager[2874] DEBUG findfont: score(FontEntry(fname='/home/runner/micromamba/envs/trajan/fonts/Ubuntu-RI.ttf', index=0, name='Ubuntu', style='italic', variant='normal', weight=400, stretch='normal', size='scalable')) = 11.335
2026-07-21 14:55:57 runnervm3jd5f matplotlib.font_manager[2874] DEBUG findfont: score(FontEntry(fname='/usr/share/fonts/truetype/dejavu/DejaVuSerif-Italic.ttf', index=0, name='DejaVu Serif', style='italic', variant='normal', weight=400, stretch='normal', size='scalable')) = 11.335
2026-07-21 14:55:57 runnervm3jd5f matplotlib.font_manager[2874] DEBUG findfont: score(FontEntry(fname='/home/runner/micromamba/envs/trajan/fonts/SourceCodePro-Medium.ttf', index=0, name='Source Code Pro', style='normal', variant='normal', weight=500, stretch='normal', size='scalable')) = 10.24
2026-07-21 14:55:57 runnervm3jd5f matplotlib.font_manager[2874] DEBUG findfont: score(FontEntry(fname='/home/runner/micromamba/envs/trajan/fonts/SourceCodePro-Medium.ttf', index=0, name='Source Code Pro Medium', style='normal', variant='normal', weight=400, stretch='normal', size='scalable')) = 10.335
2026-07-21 14:55:57 runnervm3jd5f matplotlib.font_manager[2874] DEBUG findfont: score(FontEntry(fname='/usr/share/fonts/truetype/lato/Lato-HeavyItalic.ttf', index=0, name='Lato', style='italic', variant='normal', weight=800, stretch='normal', size='scalable')) = 11.145
2026-07-21 14:55:57 runnervm3jd5f matplotlib.font_manager[2874] DEBUG findfont: score(FontEntry(fname='/usr/share/fonts/truetype/lato/Lato-HeavyItalic.ttf', index=0, name='Lato Heavy', style='italic', variant='normal', weight=400, stretch='normal', size='scalable')) = 11.335
2026-07-21 14:55:57 runnervm3jd5f matplotlib.font_manager[2874] DEBUG findfont: score(FontEntry(fname='/usr/share/fonts/truetype/dejavu/DejaVuSans-Oblique.ttf', index=0, name='DejaVu Sans', style='oblique', variant='normal', weight=400, stretch='normal', size='scalable')) = 11.335
2026-07-21 14:55:57 runnervm3jd5f matplotlib.font_manager[2874] DEBUG findfont: score(FontEntry(fname='/home/runner/micromamba/envs/trajan/fonts/Ubuntu-M.ttf', index=0, name='Ubuntu', style='normal', variant='normal', weight=500, stretch='normal', size='scalable')) = 10.24
2026-07-21 14:55:57 runnervm3jd5f matplotlib.font_manager[2874] DEBUG findfont: score(FontEntry(fname='/home/runner/micromamba/envs/trajan/fonts/Ubuntu-M.ttf', index=0, name='Ubuntu Light', style='normal', variant='normal', weight=700, stretch='normal', size='scalable')) = 10.05
2026-07-21 14:55:57 runnervm3jd5f matplotlib.font_manager[2874] DEBUG findfont: score(FontEntry(fname='/usr/share/fonts/truetype/liberation/LiberationMono-BoldItalic.ttf', index=0, name='Liberation Mono', style='italic', variant='normal', weight=700, stretch='normal', size='scalable')) = 11.05
2026-07-21 14:55:57 runnervm3jd5f matplotlib.font_manager[2874] DEBUG findfont: score(FontEntry(fname='/usr/share/fonts/truetype/dejavu/DejaVuSansMono.ttf', index=0, name='DejaVu Sans Mono', style='normal', variant='normal', weight=400, stretch='normal', size='scalable')) = 10.335
2026-07-21 14:55:57 runnervm3jd5f matplotlib.font_manager[2874] DEBUG findfont: score(FontEntry(fname='/usr/share/fonts/truetype/dejavu/DejaVuMathTeXGyre.ttf', index=0, name='DejaVu Math TeX Gyre', style='normal', variant='normal', weight=400, stretch='normal', size='scalable')) = 10.335
2026-07-21 14:55:57 runnervm3jd5f matplotlib.font_manager[2874] DEBUG findfont: score(FontEntry(fname='/usr/share/fonts/truetype/dejavu/DejaVuSansMono-Oblique.ttf', index=0, name='DejaVu Sans Mono', style='oblique', variant='normal', weight=400, stretch='normal', size='scalable')) = 11.335
2026-07-21 14:55:57 runnervm3jd5f matplotlib.font_manager[2874] DEBUG findfont: score(FontEntry(fname='/home/runner/micromamba/envs/trajan/fonts/Ubuntu-L.ttf', index=0, name='Ubuntu', style='normal', variant='normal', weight=300, stretch='normal', size='scalable')) = 10.43
2026-07-21 14:55:57 runnervm3jd5f matplotlib.font_manager[2874] DEBUG findfont: score(FontEntry(fname='/home/runner/micromamba/envs/trajan/fonts/Ubuntu-L.ttf', index=0, name='Ubuntu Light', style='normal', variant='normal', weight=400, stretch='normal', size='scalable')) = 10.335
2026-07-21 14:55:57 runnervm3jd5f matplotlib.font_manager[2874] DEBUG findfont: score(FontEntry(fname='/home/runner/micromamba/envs/trajan/fonts/SourceCodePro-MediumIt.ttf', index=0, name='Source Code Pro', style='italic', variant='normal', weight=500, stretch='normal', size='scalable')) = 11.24
2026-07-21 14:55:57 runnervm3jd5f matplotlib.font_manager[2874] DEBUG findfont: score(FontEntry(fname='/home/runner/micromamba/envs/trajan/fonts/SourceCodePro-MediumIt.ttf', index=0, name='Source Code Pro Medium', style='italic', variant='normal', weight=400, stretch='normal', size='scalable')) = 11.335
2026-07-21 14:55:57 runnervm3jd5f matplotlib.font_manager[2874] DEBUG findfont: score(FontEntry(fname='/home/runner/micromamba/envs/trajan/fonts/SourceCodePro-Regular.ttf', index=0, name='Source Code Pro', style='normal', variant='normal', weight=400, stretch='normal', size='scalable')) = 10.335
2026-07-21 14:55:57 runnervm3jd5f matplotlib.font_manager[2874] DEBUG findfont: score(FontEntry(fname='/home/runner/micromamba/envs/trajan/fonts/SourceCodePro-SemiboldIt.ttf', index=0, name='Source Code Pro', style='italic', variant='normal', weight=600, stretch='normal', size='scalable')) = 11.145
2026-07-21 14:55:57 runnervm3jd5f matplotlib.font_manager[2874] DEBUG findfont: score(FontEntry(fname='/home/runner/micromamba/envs/trajan/fonts/SourceCodePro-SemiboldIt.ttf', index=0, name='Source Code Pro Semibold', style='italic', variant='normal', weight=400, stretch='normal', size='scalable')) = 11.335
2026-07-21 14:55:57 runnervm3jd5f matplotlib.font_manager[2874] DEBUG findfont: score(FontEntry(fname='/usr/share/fonts/truetype/dejavu/DejaVuSerif.ttf', index=0, name='DejaVu Serif', style='normal', variant='normal', weight=400, stretch='normal', size='scalable')) = 10.335
2026-07-21 14:55:57 runnervm3jd5f matplotlib.font_manager[2874] DEBUG findfont: score(FontEntry(fname='/usr/share/fonts/truetype/dejavu/DejaVuSerif-Bold.ttf', index=0, name='DejaVu Serif', style='normal', variant='normal', weight=700, stretch='normal', size='scalable')) = 10.05
2026-07-21 14:55:57 runnervm3jd5f matplotlib.font_manager[2874] DEBUG findfont: score(FontEntry(fname='/usr/share/fonts/truetype/liberation/LiberationSerif-Italic.ttf', index=0, name='Liberation Serif', style='italic', variant='normal', weight=400, stretch='normal', size='scalable')) = 11.335
2026-07-21 14:55:57 runnervm3jd5f matplotlib.font_manager[2874] DEBUG findfont: score(FontEntry(fname='/usr/share/fonts/truetype/dejavu/DejaVuSansMono-BoldOblique.ttf', index=0, name='DejaVu Sans Mono', style='oblique', variant='normal', weight=700, stretch='normal', size='scalable')) = 11.05
2026-07-21 14:55:57 runnervm3jd5f matplotlib.font_manager[2874] DEBUG findfont: score(FontEntry(fname='/home/runner/micromamba/envs/trajan/fonts/SourceCodePro-Light.ttf', index=0, name='Source Code Pro', style='normal', variant='normal', weight=300, stretch='normal', size='scalable')) = 10.43
2026-07-21 14:55:57 runnervm3jd5f matplotlib.font_manager[2874] DEBUG findfont: score(FontEntry(fname='/home/runner/micromamba/envs/trajan/fonts/SourceCodePro-Light.ttf', index=0, name='Source Code Pro Light', style='normal', variant='normal', weight=400, stretch='normal', size='scalable')) = 10.335
2026-07-21 14:55:57 runnervm3jd5f matplotlib.font_manager[2874] DEBUG findfont: score(FontEntry(fname='/usr/share/fonts/truetype/liberation/LiberationMono-Italic.ttf', index=0, name='Liberation Mono', style='italic', variant='normal', weight=400, stretch='normal', size='scalable')) = 11.335
2026-07-21 14:55:57 runnervm3jd5f matplotlib.font_manager[2874] DEBUG findfont: Matching STIXNonUnicode:style=normal:variant=normal:weight=bold:stretch=normal:size=10.0 to STIXNonUnicode ('/home/runner/micromamba/envs/trajan/lib/python3.14/site-packages/matplotlib/mpl-data/fonts/ttf/STIXNonUniBol.ttf') with score of 0.050000.
2026-07-21 14:55:57 runnervm3jd5f matplotlib.font_manager[2874] DEBUG findfont: Matching STIXSizeOneSym:style=normal:variant=normal:weight=normal:stretch=normal:size=10.0.
2026-07-21 14:55:57 runnervm3jd5f matplotlib.font_manager[2874] DEBUG findfont: score(FontEntry(fname='/home/runner/micromamba/envs/trajan/lib/python3.14/site-packages/matplotlib/mpl-data/fonts/ttf/cmmi10.ttf', index=0, name='cmmi10', style='normal', variant='normal', weight=400, stretch='normal', size='scalable')) = 10.05
2026-07-21 14:55:57 runnervm3jd5f matplotlib.font_manager[2874] DEBUG findfont: score(FontEntry(fname='/home/runner/micromamba/envs/trajan/lib/python3.14/site-packages/matplotlib/mpl-data/fonts/ttf/DejaVuSerif-Bold.ttf', index=0, name='DejaVu Serif', style='normal', variant='normal', weight=700, stretch='normal', size='scalable')) = 10.335
2026-07-21 14:55:57 runnervm3jd5f matplotlib.font_manager[2874] DEBUG findfont: score(FontEntry(fname='/home/runner/micromamba/envs/trajan/lib/python3.14/site-packages/matplotlib/mpl-data/fonts/ttf/DejaVuSans-Oblique.ttf', index=0, name='DejaVu Sans', style='oblique', variant='normal', weight=400, stretch='normal', size='scalable')) = 11.05
2026-07-21 14:55:57 runnervm3jd5f matplotlib.font_manager[2874] DEBUG findfont: score(FontEntry(fname='/home/runner/micromamba/envs/trajan/lib/python3.14/site-packages/matplotlib/mpl-data/fonts/ttf/STIXSizThreeSymReg.ttf', index=0, name='STIXSizeThreeSym', style='normal', variant='normal', weight=400, stretch='normal', size='scalable')) = 10.05
2026-07-21 14:55:57 runnervm3jd5f matplotlib.font_manager[2874] DEBUG findfont: score(FontEntry(fname='/home/runner/micromamba/envs/trajan/lib/python3.14/site-packages/matplotlib/mpl-data/fonts/ttf/STIXNonUniBolIta.ttf', index=0, name='STIXNonUnicode', style='italic', variant='normal', weight=700, stretch='normal', size='scalable')) = 11.335
2026-07-21 14:55:57 runnervm3jd5f matplotlib.font_manager[2874] DEBUG findfont: score(FontEntry(fname='/home/runner/micromamba/envs/trajan/lib/python3.14/site-packages/matplotlib/mpl-data/fonts/ttf/DejaVuSerifDisplay.ttf', index=0, name='DejaVu Serif Display', style='normal', variant='normal', weight=400, stretch='normal', size='scalable')) = 10.05
2026-07-21 14:55:57 runnervm3jd5f matplotlib.font_manager[2874] DEBUG findfont: score(FontEntry(fname='/home/runner/micromamba/envs/trajan/lib/python3.14/site-packages/matplotlib/mpl-data/fonts/ttf/cmss10.ttf', index=0, name='cmss10', style='normal', variant='normal', weight=400, stretch='normal', size='scalable')) = 10.05
2026-07-21 14:55:57 runnervm3jd5f matplotlib.font_manager[2874] DEBUG findfont: score(FontEntry(fname='/home/runner/micromamba/envs/trajan/lib/python3.14/site-packages/matplotlib/mpl-data/fonts/ttf/STIXGeneralBolIta.ttf', index=0, name='STIXGeneral', style='italic', variant='normal', weight=700, stretch='normal', size='scalable')) = 11.335
2026-07-21 14:55:57 runnervm3jd5f matplotlib.font_manager[2874] DEBUG findfont: score(FontEntry(fname='/home/runner/micromamba/envs/trajan/lib/python3.14/site-packages/matplotlib/mpl-data/fonts/ttf/cmtt10.ttf', index=0, name='cmtt10', style='normal', variant='normal', weight=400, stretch='normal', size='scalable')) = 10.05
2026-07-21 14:55:57 runnervm3jd5f matplotlib.font_manager[2874] DEBUG findfont: score(FontEntry(fname='/home/runner/micromamba/envs/trajan/lib/python3.14/site-packages/matplotlib/mpl-data/fonts/ttf/cmsy10.ttf', index=0, name='cmsy10', style='normal', variant='normal', weight=400, stretch='normal', size='scalable')) = 10.05
2026-07-21 14:55:57 runnervm3jd5f matplotlib.font_manager[2874] DEBUG findfont: score(FontEntry(fname='/home/runner/micromamba/envs/trajan/lib/python3.14/site-packages/matplotlib/mpl-data/fonts/ttf/DejaVuSansMono-Oblique.ttf', index=0, name='DejaVu Sans Mono', style='oblique', variant='normal', weight=400, stretch='normal', size='scalable')) = 11.05
2026-07-21 14:55:57 runnervm3jd5f matplotlib.font_manager[2874] DEBUG findfont: score(FontEntry(fname='/home/runner/micromamba/envs/trajan/lib/python3.14/site-packages/matplotlib/mpl-data/fonts/ttf/STIXNonUniIta.ttf', index=0, name='STIXNonUnicode', style='italic', variant='normal', weight=400, stretch='normal', size='scalable')) = 11.05
2026-07-21 14:55:57 runnervm3jd5f matplotlib.font_manager[2874] DEBUG findfont: score(FontEntry(fname='/home/runner/micromamba/envs/trajan/lib/python3.14/site-packages/matplotlib/mpl-data/fonts/ttf/STIXGeneral.ttf', index=0, name='STIXGeneral', style='normal', variant='normal', weight=400, stretch='normal', size='scalable')) = 10.05
2026-07-21 14:55:57 runnervm3jd5f matplotlib.font_manager[2874] DEBUG findfont: score(FontEntry(fname='/home/runner/micromamba/envs/trajan/lib/python3.14/site-packages/matplotlib/mpl-data/fonts/ttf/cmti10.ttf', index=0, name='cmti10', style='normal', variant='normal', weight=400, stretch='normal', size='scalable')) = 10.05
2026-07-21 14:55:57 runnervm3jd5f matplotlib.font_manager[2874] DEBUG findfont: score(FontEntry(fname='/home/runner/micromamba/envs/trajan/lib/python3.14/site-packages/matplotlib/mpl-data/fonts/ttf/DejaVuSansMono-BoldOblique.ttf', index=0, name='DejaVu Sans Mono', style='oblique', variant='normal', weight=700, stretch='normal', size='scalable')) = 11.335
2026-07-21 14:55:57 runnervm3jd5f matplotlib.font_manager[2874] DEBUG findfont: score(FontEntry(fname='/home/runner/micromamba/envs/trajan/lib/python3.14/site-packages/matplotlib/mpl-data/fonts/ttf/DejaVuSerif.ttf', index=0, name='DejaVu Serif', style='normal', variant='normal', weight=400, stretch='normal', size='scalable')) = 10.05
2026-07-21 14:55:57 runnervm3jd5f matplotlib.font_manager[2874] DEBUG findfont: score(FontEntry(fname='/home/runner/micromamba/envs/trajan/lib/python3.14/site-packages/matplotlib/mpl-data/fonts/ttf/LastResortHE-Regular.ttf', index=0, name='Last Resort High-Efficiency', style='normal', variant='normal', weight=400, stretch='normal', size='scalable')) = 10.05
2026-07-21 14:55:57 runnervm3jd5f matplotlib.font_manager[2874] DEBUG findfont: score(FontEntry(fname='/home/runner/micromamba/envs/trajan/lib/python3.14/site-packages/matplotlib/mpl-data/fonts/ttf/cmex10.ttf', index=0, name='cmex10', style='normal', variant='normal', weight=400, stretch='normal', size='scalable')) = 10.05
2026-07-21 14:55:57 runnervm3jd5f matplotlib.font_manager[2874] DEBUG findfont: score(FontEntry(fname='/home/runner/micromamba/envs/trajan/lib/python3.14/site-packages/matplotlib/mpl-data/fonts/ttf/STIXSizFiveSymReg.ttf', index=0, name='STIXSizeFiveSym', style='normal', variant='normal', weight=400, stretch='normal', size='scalable')) = 10.05
2026-07-21 14:55:57 runnervm3jd5f matplotlib.font_manager[2874] DEBUG findfont: score(FontEntry(fname='/home/runner/micromamba/envs/trajan/lib/python3.14/site-packages/matplotlib/mpl-data/fonts/ttf/STIXNonUniBol.ttf', index=0, name='STIXNonUnicode', style='normal', variant='normal', weight=700, stretch='normal', size='scalable')) = 10.335
2026-07-21 14:55:57 runnervm3jd5f matplotlib.font_manager[2874] DEBUG findfont: score(FontEntry(fname='/home/runner/micromamba/envs/trajan/lib/python3.14/site-packages/matplotlib/mpl-data/fonts/ttf/DejaVuSansDisplay.ttf', index=0, name='DejaVu Sans Display', style='normal', variant='normal', weight=400, stretch='normal', size='scalable')) = 10.05
2026-07-21 14:55:57 runnervm3jd5f matplotlib.font_manager[2874] DEBUG findfont: score(FontEntry(fname='/home/runner/micromamba/envs/trajan/lib/python3.14/site-packages/matplotlib/mpl-data/fonts/ttf/DejaVuSansMono.ttf', index=0, name='DejaVu Sans Mono', style='normal', variant='normal', weight=400, stretch='normal', size='scalable')) = 10.05
2026-07-21 14:55:57 runnervm3jd5f matplotlib.font_manager[2874] DEBUG findfont: score(FontEntry(fname='/home/runner/micromamba/envs/trajan/lib/python3.14/site-packages/matplotlib/mpl-data/fonts/ttf/cmb10.ttf', index=0, name='cmb10', style='normal', variant='normal', weight=400, stretch='normal', size='scalable')) = 10.05
2026-07-21 14:55:57 runnervm3jd5f matplotlib.font_manager[2874] DEBUG findfont: score(FontEntry(fname='/home/runner/micromamba/envs/trajan/lib/python3.14/site-packages/matplotlib/mpl-data/fonts/ttf/STIXSizTwoSymReg.ttf', index=0, name='STIXSizeTwoSym', style='normal', variant='normal', weight=400, stretch='normal', size='scalable')) = 10.05
2026-07-21 14:55:57 runnervm3jd5f matplotlib.font_manager[2874] DEBUG findfont: score(FontEntry(fname='/home/runner/micromamba/envs/trajan/lib/python3.14/site-packages/matplotlib/mpl-data/fonts/ttf/DejaVuSans.ttf', index=0, name='DejaVu Sans', style='normal', variant='normal', weight=400, stretch='normal', size='scalable')) = 10.05
2026-07-21 14:55:57 runnervm3jd5f matplotlib.font_manager[2874] DEBUG findfont: score(FontEntry(fname='/home/runner/micromamba/envs/trajan/lib/python3.14/site-packages/matplotlib/mpl-data/fonts/ttf/STIXNonUni.ttf', index=0, name='STIXNonUnicode', style='normal', variant='normal', weight=400, stretch='normal', size='scalable')) = 10.05
2026-07-21 14:55:57 runnervm3jd5f matplotlib.font_manager[2874] DEBUG findfont: score(FontEntry(fname='/home/runner/micromamba/envs/trajan/lib/python3.14/site-packages/matplotlib/mpl-data/fonts/ttf/STIXGeneralItalic.ttf', index=0, name='STIXGeneral', style='italic', variant='normal', weight=400, stretch='normal', size='scalable')) = 11.05
2026-07-21 14:55:57 runnervm3jd5f matplotlib.font_manager[2874] DEBUG findfont: score(FontEntry(fname='/home/runner/micromamba/envs/trajan/lib/python3.14/site-packages/matplotlib/mpl-data/fonts/ttf/STIXSizOneSymBol.ttf', index=0, name='STIXSizeOneSym', style='normal', variant='normal', weight=700, stretch='normal', size='scalable')) = 0.33499999999999996
2026-07-21 14:55:57 runnervm3jd5f matplotlib.font_manager[2874] DEBUG findfont: score(FontEntry(fname='/home/runner/micromamba/envs/trajan/lib/python3.14/site-packages/matplotlib/mpl-data/fonts/ttf/DejaVuSansMono-Bold.ttf', index=0, name='DejaVu Sans Mono', style='normal', variant='normal', weight=700, stretch='normal', size='scalable')) = 10.335
2026-07-21 14:55:57 runnervm3jd5f matplotlib.font_manager[2874] DEBUG findfont: score(FontEntry(fname='/home/runner/micromamba/envs/trajan/lib/python3.14/site-packages/matplotlib/mpl-data/fonts/ttf/STIXSizTwoSymBol.ttf', index=0, name='STIXSizeTwoSym', style='normal', variant='normal', weight=700, stretch='normal', size='scalable')) = 10.335
2026-07-21 14:55:57 runnervm3jd5f matplotlib.font_manager[2874] DEBUG findfont: score(FontEntry(fname='/home/runner/micromamba/envs/trajan/lib/python3.14/site-packages/matplotlib/mpl-data/fonts/ttf/STIXSizThreeSymBol.ttf', index=0, name='STIXSizeThreeSym', style='normal', variant='normal', weight=700, stretch='normal', size='scalable')) = 10.335
2026-07-21 14:55:57 runnervm3jd5f matplotlib.font_manager[2874] DEBUG findfont: score(FontEntry(fname='/home/runner/micromamba/envs/trajan/lib/python3.14/site-packages/matplotlib/mpl-data/fonts/ttf/DejaVuSerif-BoldItalic.ttf', index=0, name='DejaVu Serif', style='italic', variant='normal', weight=700, stretch='normal', size='scalable')) = 11.335
2026-07-21 14:55:57 runnervm3jd5f matplotlib.font_manager[2874] DEBUG findfont: score(FontEntry(fname='/home/runner/micromamba/envs/trajan/lib/python3.14/site-packages/matplotlib/mpl-data/fonts/ttf/DejaVuSerif-Italic.ttf', index=0, name='DejaVu Serif', style='italic', variant='normal', weight=400, stretch='normal', size='scalable')) = 11.05
2026-07-21 14:55:57 runnervm3jd5f matplotlib.font_manager[2874] DEBUG findfont: score(FontEntry(fname='/home/runner/micromamba/envs/trajan/lib/python3.14/site-packages/matplotlib/mpl-data/fonts/ttf/DejaVuSans-Bold.ttf', index=0, name='DejaVu Sans', style='normal', variant='normal', weight=700, stretch='normal', size='scalable')) = 10.335
2026-07-21 14:55:57 runnervm3jd5f matplotlib.font_manager[2874] DEBUG findfont: score(FontEntry(fname='/home/runner/micromamba/envs/trajan/lib/python3.14/site-packages/matplotlib/mpl-data/fonts/ttf/STIXSizFourSymBol.ttf', index=0, name='STIXSizeFourSym', style='normal', variant='normal', weight=700, stretch='normal', size='scalable')) = 10.335
2026-07-21 14:55:57 runnervm3jd5f matplotlib.font_manager[2874] DEBUG findfont: score(FontEntry(fname='/home/runner/micromamba/envs/trajan/lib/python3.14/site-packages/matplotlib/mpl-data/fonts/ttf/STIXSizOneSymReg.ttf', index=0, name='STIXSizeOneSym', style='normal', variant='normal', weight=400, stretch='normal', size='scalable')) = 0.05
2026-07-21 14:55:57 runnervm3jd5f matplotlib.font_manager[2874] DEBUG findfont: score(FontEntry(fname='/home/runner/micromamba/envs/trajan/lib/python3.14/site-packages/matplotlib/mpl-data/fonts/ttf/cmr10.ttf', index=0, name='cmr10', style='normal', variant='normal', weight=400, stretch='normal', size='scalable')) = 10.05
2026-07-21 14:55:57 runnervm3jd5f matplotlib.font_manager[2874] DEBUG findfont: score(FontEntry(fname='/home/runner/micromamba/envs/trajan/lib/python3.14/site-packages/matplotlib/mpl-data/fonts/ttf/STIXGeneralBol.ttf', index=0, name='STIXGeneral', style='normal', variant='normal', weight=700, stretch='normal', size='scalable')) = 10.335
2026-07-21 14:55:57 runnervm3jd5f matplotlib.font_manager[2874] DEBUG findfont: score(FontEntry(fname='/home/runner/micromamba/envs/trajan/lib/python3.14/site-packages/matplotlib/mpl-data/fonts/ttf/DejaVuSans-BoldOblique.ttf', index=0, name='DejaVu Sans', style='oblique', variant='normal', weight=700, stretch='normal', size='scalable')) = 11.335
2026-07-21 14:55:57 runnervm3jd5f matplotlib.font_manager[2874] DEBUG findfont: score(FontEntry(fname='/home/runner/micromamba/envs/trajan/lib/python3.14/site-packages/matplotlib/mpl-data/fonts/ttf/STIXSizFourSymReg.ttf', index=0, name='STIXSizeFourSym', style='normal', variant='normal', weight=400, stretch='normal', size='scalable')) = 10.05
2026-07-21 14:55:57 runnervm3jd5f matplotlib.font_manager[2874] DEBUG findfont: score(FontEntry(fname='/usr/share/fonts/truetype/lato/Lato-Black.ttf', index=0, name='Lato', style='normal', variant='normal', weight=900, stretch='normal', size='scalable')) = 10.525
2026-07-21 14:55:57 runnervm3jd5f matplotlib.font_manager[2874] DEBUG findfont: score(FontEntry(fname='/usr/share/fonts/truetype/lato/Lato-Black.ttf', index=0, name='Lato Black', style='normal', variant='normal', weight=400, stretch='normal', size='scalable')) = 10.05
2026-07-21 14:55:57 runnervm3jd5f matplotlib.font_manager[2874] DEBUG findfont: score(FontEntry(fname='/usr/share/fonts/truetype/liberation/LiberationSerif-Regular.ttf', index=0, name='Liberation Serif', style='normal', variant='normal', weight=400, stretch='normal', size='scalable')) = 10.05
2026-07-21 14:55:57 runnervm3jd5f matplotlib.font_manager[2874] DEBUG findfont: score(FontEntry(fname='/usr/share/fonts/truetype/dejavu/DejaVuSerifCondensed.ttf', index=0, name='DejaVu Serif', style='normal', variant='normal', weight=400, stretch='condensed', size='scalable')) = 10.25
2026-07-21 14:55:57 runnervm3jd5f matplotlib.font_manager[2874] DEBUG findfont: score(FontEntry(fname='/usr/share/fonts/truetype/dejavu/DejaVuSerifCondensed.ttf', index=0, name='DejaVu Serif Condensed', style='normal', variant='normal', weight=380, stretch='condensed', size='scalable')) = 10.269
2026-07-21 14:55:57 runnervm3jd5f matplotlib.font_manager[2874] DEBUG findfont: score(FontEntry(fname='/home/runner/micromamba/envs/trajan/fonts/UbuntuMono-BI.ttf', index=0, name='Ubuntu Mono', style='italic', variant='normal', weight=700, stretch='normal', size='scalable')) = 11.335
2026-07-21 14:55:57 runnervm3jd5f matplotlib.font_manager[2874] DEBUG findfont: score(FontEntry(fname='/usr/share/fonts/truetype/dejavu/DejaVuSans.ttf', index=0, name='DejaVu Sans', style='normal', variant='normal', weight=400, stretch='normal', size='scalable')) = 10.05
2026-07-21 14:55:57 runnervm3jd5f matplotlib.font_manager[2874] DEBUG findfont: score(FontEntry(fname='/usr/share/fonts/truetype/lato/Lato-Italic.ttf', index=0, name='Lato', style='italic', variant='normal', weight=400, stretch='normal', size='scalable')) = 11.05
2026-07-21 14:55:57 runnervm3jd5f matplotlib.font_manager[2874] DEBUG findfont: score(FontEntry(fname='/usr/share/fonts/truetype/liberation/LiberationSans-Italic.ttf', index=0, name='Liberation Sans', style='italic', variant='normal', weight=400, stretch='normal', size='scalable')) = 11.05
2026-07-21 14:55:57 runnervm3jd5f matplotlib.font_manager[2874] DEBUG findfont: score(FontEntry(fname='/home/runner/micromamba/envs/trajan/fonts/Ubuntu-B.ttf', index=0, name='Ubuntu', style='normal', variant='normal', weight=700, stretch='normal', size='scalable')) = 10.335
2026-07-21 14:55:57 runnervm3jd5f matplotlib.font_manager[2874] DEBUG findfont: score(FontEntry(fname='/home/runner/micromamba/envs/trajan/fonts/SourceCodePro-Semibold.ttf', index=0, name='Source Code Pro', style='normal', variant='normal', weight=600, stretch='normal', size='scalable')) = 10.24
2026-07-21 14:55:57 runnervm3jd5f matplotlib.font_manager[2874] DEBUG findfont: score(FontEntry(fname='/home/runner/micromamba/envs/trajan/fonts/SourceCodePro-Semibold.ttf', index=0, name='Source Code Pro Semibold', style='normal', variant='normal', weight=400, stretch='normal', size='scalable')) = 10.05
2026-07-21 14:55:57 runnervm3jd5f matplotlib.font_manager[2874] DEBUG findfont: score(FontEntry(fname='/home/runner/micromamba/envs/trajan/fonts/SourceCodePro-Bold.ttf', index=0, name='Source Code Pro', style='normal', variant='normal', weight=700, stretch='normal', size='scalable')) = 10.335
2026-07-21 14:55:57 runnervm3jd5f matplotlib.font_manager[2874] DEBUG findfont: score(FontEntry(fname='/home/runner/micromamba/envs/trajan/fonts/Ubuntu-MI.ttf', index=0, name='Ubuntu', style='italic', variant='normal', weight=500, stretch='normal', size='scalable')) = 11.145
2026-07-21 14:55:57 runnervm3jd5f matplotlib.font_manager[2874] DEBUG findfont: score(FontEntry(fname='/home/runner/micromamba/envs/trajan/fonts/Ubuntu-MI.ttf', index=0, name='Ubuntu Light', style='italic', variant='normal', weight=700, stretch='normal', size='scalable')) = 11.335
2026-07-21 14:55:57 runnervm3jd5f matplotlib.font_manager[2874] DEBUG findfont: score(FontEntry(fname='/usr/share/fonts/truetype/lato/Lato-Regular.ttf', index=0, name='Lato', style='normal', variant='normal', weight=400, stretch='normal', size='scalable')) = 10.05
2026-07-21 14:55:57 runnervm3jd5f matplotlib.font_manager[2874] DEBUG findfont: score(FontEntry(fname='/usr/share/fonts/truetype/lato/Lato-ThinItalic.ttf', index=0, name='Lato', style='italic', variant='normal', weight=275, stretch='normal', size='scalable')) = 11.16875
2026-07-21 14:55:57 runnervm3jd5f matplotlib.font_manager[2874] DEBUG findfont: score(FontEntry(fname='/usr/share/fonts/truetype/lato/Lato-ThinItalic.ttf', index=0, name='Lato Thin', style='italic', variant='normal', weight=400, stretch='normal', size='scalable')) = 11.05
2026-07-21 14:55:57 runnervm3jd5f matplotlib.font_manager[2874] DEBUG findfont: score(FontEntry(fname='/usr/share/fonts/truetype/lato/Lato-BlackItalic.ttf', index=0, name='Lato', style='italic', variant='normal', weight=900, stretch='normal', size='scalable')) = 11.525
2026-07-21 14:55:57 runnervm3jd5f matplotlib.font_manager[2874] DEBUG findfont: score(FontEntry(fname='/usr/share/fonts/truetype/lato/Lato-BlackItalic.ttf', index=0, name='Lato Black', style='italic', variant='normal', weight=400, stretch='normal', size='scalable')) = 11.05
2026-07-21 14:55:57 runnervm3jd5f matplotlib.font_manager[2874] DEBUG findfont: score(FontEntry(fname='/usr/share/fonts/truetype/dejavu/DejaVuSerifCondensed-Italic.ttf', index=0, name='DejaVu Serif', style='italic', variant='normal', weight=400, stretch='condensed', size='scalable')) = 11.25
2026-07-21 14:55:57 runnervm3jd5f matplotlib.font_manager[2874] DEBUG findfont: score(FontEntry(fname='/usr/share/fonts/truetype/dejavu/DejaVuSerifCondensed-Italic.ttf', index=0, name='DejaVu Serif Condensed', style='italic', variant='normal', weight=400, stretch='condensed', size='scalable')) = 11.25
2026-07-21 14:55:57 runnervm3jd5f matplotlib.font_manager[2874] DEBUG findfont: score(FontEntry(fname='/usr/share/fonts/truetype/dejavu/DejaVuSans-Bold.ttf', index=0, name='DejaVu Sans', style='normal', variant='normal', weight=700, stretch='normal', size='scalable')) = 10.335
2026-07-21 14:55:57 runnervm3jd5f matplotlib.font_manager[2874] DEBUG findfont: score(FontEntry(fname='/home/runner/micromamba/envs/trajan/fonts/UbuntuMono-R.ttf', index=0, name='Ubuntu Mono', style='normal', variant='normal', weight=400, stretch='normal', size='scalable')) = 10.05
2026-07-21 14:55:57 runnervm3jd5f matplotlib.font_manager[2874] DEBUG findfont: score(FontEntry(fname='/usr/share/fonts/truetype/dejavu/DejaVuSerif-BoldItalic.ttf', index=0, name='DejaVu Serif', style='italic', variant='normal', weight=700, stretch='normal', size='scalable')) = 11.335
2026-07-21 14:55:57 runnervm3jd5f matplotlib.font_manager[2874] DEBUG findfont: score(FontEntry(fname='/usr/share/fonts/truetype/lato/Lato-Hairline.ttf', index=0, name='Lato', style='normal', variant='normal', weight=250, stretch='normal', size='scalable')) = 10.1925
2026-07-21 14:55:57 runnervm3jd5f matplotlib.font_manager[2874] DEBUG findfont: score(FontEntry(fname='/usr/share/fonts/truetype/lato/Lato-Hairline.ttf', index=0, name='Lato Hairline', style='normal', variant='normal', weight=400, stretch='normal', size='scalable')) = 10.05
2026-07-21 14:55:57 runnervm3jd5f matplotlib.font_manager[2874] DEBUG findfont: score(FontEntry(fname='/usr/share/fonts/truetype/lato/Lato-LightItalic.ttf', index=0, name='Lato', style='italic', variant='normal', weight=300, stretch='normal', size='scalable')) = 11.145
2026-07-21 14:55:57 runnervm3jd5f matplotlib.font_manager[2874] DEBUG findfont: score(FontEntry(fname='/usr/share/fonts/truetype/lato/Lato-LightItalic.ttf', index=0, name='Lato Light', style='italic', variant='normal', weight=400, stretch='normal', size='scalable')) = 11.05
2026-07-21 14:55:57 runnervm3jd5f matplotlib.font_manager[2874] DEBUG findfont: score(FontEntry(fname='/usr/share/fonts/truetype/dejavu/DejaVuSansCondensed-BoldOblique.ttf', index=0, name='DejaVu Sans', style='oblique', variant='normal', weight=700, stretch='condensed', size='scalable')) = 11.535
2026-07-21 14:55:57 runnervm3jd5f matplotlib.font_manager[2874] DEBUG findfont: score(FontEntry(fname='/usr/share/fonts/truetype/dejavu/DejaVuSansCondensed-BoldOblique.ttf', index=0, name='DejaVu Sans Condensed', style='oblique', variant='normal', weight=700, stretch='condensed', size='scalable')) = 11.535
2026-07-21 14:55:57 runnervm3jd5f matplotlib.font_manager[2874] DEBUG findfont: score(FontEntry(fname='/home/runner/micromamba/envs/trajan/fonts/SourceCodePro-It.ttf', index=0, name='Source Code Pro', style='italic', variant='normal', weight=400, stretch='normal', size='scalable')) = 11.05
2026-07-21 14:55:57 runnervm3jd5f matplotlib.font_manager[2874] DEBUG findfont: score(FontEntry(fname='/home/runner/micromamba/envs/trajan/fonts/SourceCodePro-ExtraLightIt.ttf', index=0, name='Source Code Pro', style='italic', variant='normal', weight=200, stretch='normal', size='scalable')) = 11.24
2026-07-21 14:55:57 runnervm3jd5f matplotlib.font_manager[2874] DEBUG findfont: score(FontEntry(fname='/home/runner/micromamba/envs/trajan/fonts/SourceCodePro-ExtraLightIt.ttf', index=0, name='Source Code Pro ExtraLight', style='italic', variant='normal', weight=400, stretch='normal', size='scalable')) = 11.05
2026-07-21 14:55:57 runnervm3jd5f matplotlib.font_manager[2874] DEBUG findfont: score(FontEntry(fname='/usr/share/fonts/truetype/lato/Lato-Medium.ttf', index=0, name='Lato', style='normal', variant='normal', weight=500, stretch='normal', size='scalable')) = 10.145
2026-07-21 14:55:57 runnervm3jd5f matplotlib.font_manager[2874] DEBUG findfont: score(FontEntry(fname='/usr/share/fonts/truetype/lato/Lato-Medium.ttf', index=0, name='Lato Medium', style='normal', variant='normal', weight=400, stretch='normal', size='scalable')) = 10.05
2026-07-21 14:55:57 runnervm3jd5f matplotlib.font_manager[2874] DEBUG findfont: score(FontEntry(fname='/usr/share/fonts/truetype/lato/Lato-BoldItalic.ttf', index=0, name='Lato', style='italic', variant='normal', weight=700, stretch='normal', size='scalable')) = 11.335
2026-07-21 14:55:57 runnervm3jd5f matplotlib.font_manager[2874] DEBUG findfont: score(FontEntry(fname='/home/runner/micromamba/envs/trajan/fonts/DejaVuSans.ttf', index=0, name='DejaVu Sans', style='normal', variant='normal', weight=400, stretch='normal', size='scalable')) = 10.05
2026-07-21 14:55:57 runnervm3jd5f matplotlib.font_manager[2874] DEBUG findfont: score(FontEntry(fname='/home/runner/micromamba/envs/trajan/fonts/UbuntuMono-B.ttf', index=0, name='Ubuntu Mono', style='normal', variant='normal', weight=700, stretch='normal', size='scalable')) = 10.335
2026-07-21 14:55:57 runnervm3jd5f matplotlib.font_manager[2874] DEBUG findfont: score(FontEntry(fname='/home/runner/micromamba/envs/trajan/fonts/SourceCodePro-LightIt.ttf', index=0, name='Source Code Pro', style='italic', variant='normal', weight=300, stretch='normal', size='scalable')) = 11.145
2026-07-21 14:55:57 runnervm3jd5f matplotlib.font_manager[2874] DEBUG findfont: score(FontEntry(fname='/home/runner/micromamba/envs/trajan/fonts/SourceCodePro-LightIt.ttf', index=0, name='Source Code Pro Light', style='italic', variant='normal', weight=400, stretch='normal', size='scalable')) = 11.05
2026-07-21 14:55:57 runnervm3jd5f matplotlib.font_manager[2874] DEBUG findfont: score(FontEntry(fname='/usr/share/fonts/truetype/liberation/LiberationSans-BoldItalic.ttf', index=0, name='Liberation Sans', style='italic', variant='normal', weight=700, stretch='normal', size='scalable')) = 11.335
2026-07-21 14:55:57 runnervm3jd5f matplotlib.font_manager[2874] DEBUG findfont: score(FontEntry(fname='/usr/share/fonts/truetype/liberation/LiberationSans-Regular.ttf', index=0, name='Liberation Sans', style='normal', variant='normal', weight=400, stretch='normal', size='scalable')) = 10.05
2026-07-21 14:55:57 runnervm3jd5f matplotlib.font_manager[2874] DEBUG findfont: score(FontEntry(fname='/usr/share/fonts/truetype/dejavu/DejaVuSansMono-Bold.ttf', index=0, name='DejaVu Sans Mono', style='normal', variant='normal', weight=700, stretch='normal', size='scalable')) = 10.335
2026-07-21 14:55:57 runnervm3jd5f matplotlib.font_manager[2874] DEBUG findfont: score(FontEntry(fname='/home/runner/micromamba/envs/trajan/fonts/SourceCodePro-BoldIt.ttf', index=0, name='Source Code Pro', style='italic', variant='normal', weight=700, stretch='normal', size='scalable')) = 11.335
2026-07-21 14:55:57 runnervm3jd5f matplotlib.font_manager[2874] DEBUG findfont: score(FontEntry(fname='/usr/share/fonts/truetype/lato/Lato-Bold.ttf', index=0, name='Lato', style='normal', variant='normal', weight=700, stretch='normal', size='scalable')) = 10.335
2026-07-21 14:55:57 runnervm3jd5f matplotlib.font_manager[2874] DEBUG findfont: score(FontEntry(fname='/usr/share/fonts/truetype/dejavu/DejaVuSansCondensed.ttf', index=0, name='DejaVu Sans', style='normal', variant='normal', weight=400, stretch='condensed', size='scalable')) = 10.25
2026-07-21 14:55:57 runnervm3jd5f matplotlib.font_manager[2874] DEBUG findfont: score(FontEntry(fname='/usr/share/fonts/truetype/dejavu/DejaVuSansCondensed.ttf', index=0, name='DejaVu Sans Condensed', style='normal', variant='normal', weight=380, stretch='condensed', size='scalable')) = 10.269
2026-07-21 14:55:57 runnervm3jd5f matplotlib.font_manager[2874] DEBUG findfont: score(FontEntry(fname='/usr/share/fonts/truetype/lato/Lato-MediumItalic.ttf', index=0, name='Lato', style='italic', variant='normal', weight=500, stretch='normal', size='scalable')) = 11.145
2026-07-21 14:55:57 runnervm3jd5f matplotlib.font_manager[2874] DEBUG findfont: score(FontEntry(fname='/usr/share/fonts/truetype/lato/Lato-MediumItalic.ttf', index=0, name='Lato Medium', style='italic', variant='normal', weight=400, stretch='normal', size='scalable')) = 11.05
2026-07-21 14:55:57 runnervm3jd5f matplotlib.font_manager[2874] DEBUG findfont: score(FontEntry(fname='/usr/share/fonts/truetype/liberation/LiberationSans-Bold.ttf', index=0, name='Liberation Sans', style='normal', variant='normal', weight=700, stretch='normal', size='scalable')) = 10.335
2026-07-21 14:55:57 runnervm3jd5f matplotlib.font_manager[2874] DEBUG findfont: score(FontEntry(fname='/usr/share/fonts/truetype/dejavu/DejaVuSerifCondensed-BoldItalic.ttf', index=0, name='DejaVu Serif', style='italic', variant='normal', weight=700, stretch='condensed', size='scalable')) = 11.535
2026-07-21 14:55:57 runnervm3jd5f matplotlib.font_manager[2874] DEBUG findfont: score(FontEntry(fname='/usr/share/fonts/truetype/dejavu/DejaVuSerifCondensed-BoldItalic.ttf', index=0, name='DejaVu Serif Condensed', style='italic', variant='normal', weight=700, stretch='condensed', size='scalable')) = 11.535
2026-07-21 14:55:57 runnervm3jd5f matplotlib.font_manager[2874] DEBUG findfont: score(FontEntry(fname='/home/runner/micromamba/envs/trajan/fonts/Ubuntu-R.ttf', index=0, name='Ubuntu', style='normal', variant='normal', weight=400, stretch='normal', size='scalable')) = 10.05
2026-07-21 14:55:57 runnervm3jd5f matplotlib.font_manager[2874] DEBUG findfont: score(FontEntry(fname='/usr/share/fonts/truetype/lato/Lato-Light.ttf', index=0, name='Lato', style='normal', variant='normal', weight=300, stretch='normal', size='scalable')) = 10.145
2026-07-21 14:55:57 runnervm3jd5f matplotlib.font_manager[2874] DEBUG findfont: score(FontEntry(fname='/usr/share/fonts/truetype/lato/Lato-Light.ttf', index=0, name='Lato Light', style='normal', variant='normal', weight=400, stretch='normal', size='scalable')) = 10.05
2026-07-21 14:55:57 runnervm3jd5f matplotlib.font_manager[2874] DEBUG findfont: score(FontEntry(fname='/usr/share/fonts/truetype/liberation/LiberationSerif-BoldItalic.ttf', index=0, name='Liberation Serif', style='italic', variant='normal', weight=700, stretch='normal', size='scalable')) = 11.335
2026-07-21 14:55:57 runnervm3jd5f matplotlib.font_manager[2874] DEBUG findfont: score(FontEntry(fname='/home/runner/micromamba/envs/trajan/fonts/Ubuntu-Th.ttf', index=0, name='Ubuntu', style='normal', variant='normal', weight=250, stretch='normal', size='scalable')) = 10.1925
2026-07-21 14:55:57 runnervm3jd5f matplotlib.font_manager[2874] DEBUG findfont: score(FontEntry(fname='/home/runner/micromamba/envs/trajan/fonts/Ubuntu-Th.ttf', index=0, name='Ubuntu Thin', style='normal', variant='normal', weight=400, stretch='normal', size='scalable')) = 10.05
2026-07-21 14:55:57 runnervm3jd5f matplotlib.font_manager[2874] DEBUG findfont: score(FontEntry(fname='/home/runner/micromamba/envs/trajan/fonts/SourceCodePro-ExtraLight.ttf', index=0, name='Source Code Pro', style='normal', variant='normal', weight=200, stretch='normal', size='scalable')) = 10.24
2026-07-21 14:55:57 runnervm3jd5f matplotlib.font_manager[2874] DEBUG findfont: score(FontEntry(fname='/home/runner/micromamba/envs/trajan/fonts/SourceCodePro-ExtraLight.ttf', index=0, name='Source Code Pro ExtraLight', style='normal', variant='normal', weight=400, stretch='normal', size='scalable')) = 10.05
2026-07-21 14:55:57 runnervm3jd5f matplotlib.font_manager[2874] DEBUG findfont: score(FontEntry(fname='/usr/share/fonts/truetype/lato/Lato-Thin.ttf', index=0, name='Lato', style='normal', variant='normal', weight=275, stretch='normal', size='scalable')) = 10.16875
2026-07-21 14:55:57 runnervm3jd5f matplotlib.font_manager[2874] DEBUG findfont: score(FontEntry(fname='/usr/share/fonts/truetype/lato/Lato-Thin.ttf', index=0, name='Lato Thin', style='normal', variant='normal', weight=400, stretch='normal', size='scalable')) = 10.05
2026-07-21 14:55:57 runnervm3jd5f matplotlib.font_manager[2874] DEBUG findfont: score(FontEntry(fname='/usr/share/fonts/truetype/liberation/LiberationSerif-Bold.ttf', index=0, name='Liberation Serif', style='normal', variant='normal', weight=700, stretch='normal', size='scalable')) = 10.335
2026-07-21 14:55:57 runnervm3jd5f matplotlib.font_manager[2874] DEBUG findfont: score(FontEntry(fname='/home/runner/micromamba/envs/trajan/fonts/Inconsolata-Regular.ttf', index=0, name='Inconsolata', style='normal', variant='normal', weight=400, stretch='normal', size='scalable')) = 10.05
2026-07-21 14:55:57 runnervm3jd5f matplotlib.font_manager[2874] DEBUG findfont: score(FontEntry(fname='/home/runner/micromamba/envs/trajan/fonts/Ubuntu-C.ttf', index=0, name='Ubuntu Condensed', style='normal', variant='normal', weight=400, stretch='condensed', size='scalable')) = 10.25
2026-07-21 14:55:57 runnervm3jd5f matplotlib.font_manager[2874] DEBUG findfont: score(FontEntry(fname='/usr/share/fonts/truetype/dejavu/DejaVuSansCondensed-Bold.ttf', index=0, name='DejaVu Sans', style='normal', variant='normal', weight=700, stretch='condensed', size='scalable')) = 10.535
2026-07-21 14:55:57 runnervm3jd5f matplotlib.font_manager[2874] DEBUG findfont: score(FontEntry(fname='/usr/share/fonts/truetype/dejavu/DejaVuSansCondensed-Bold.ttf', index=0, name='DejaVu Sans Condensed', style='normal', variant='normal', weight=700, stretch='condensed', size='scalable')) = 10.535
2026-07-21 14:55:57 runnervm3jd5f matplotlib.font_manager[2874] DEBUG findfont: score(FontEntry(fname='/usr/share/fonts/truetype/liberation/LiberationMono-Bold.ttf', index=0, name='Liberation Mono', style='normal', variant='normal', weight=700, stretch='normal', size='scalable')) = 10.335
2026-07-21 14:55:57 runnervm3jd5f matplotlib.font_manager[2874] DEBUG findfont: score(FontEntry(fname='/home/runner/micromamba/envs/trajan/fonts/SourceCodePro-Black.ttf', index=0, name='Source Code Pro', style='normal', variant='normal', weight=900, stretch='normal', size='scalable')) = 10.525
2026-07-21 14:55:57 runnervm3jd5f matplotlib.font_manager[2874] DEBUG findfont: score(FontEntry(fname='/home/runner/micromamba/envs/trajan/fonts/SourceCodePro-Black.ttf', index=0, name='Source Code Pro Black', style='normal', variant='normal', weight=400, stretch='normal', size='scalable')) = 10.05
2026-07-21 14:55:57 runnervm3jd5f matplotlib.font_manager[2874] DEBUG findfont: score(FontEntry(fname='/home/runner/micromamba/envs/trajan/fonts/SourceCodePro-BlackIt.ttf', index=0, name='Source Code Pro', style='italic', variant='normal', weight=900, stretch='normal', size='scalable')) = 11.525
2026-07-21 14:55:57 runnervm3jd5f matplotlib.font_manager[2874] DEBUG findfont: score(FontEntry(fname='/home/runner/micromamba/envs/trajan/fonts/SourceCodePro-BlackIt.ttf', index=0, name='Source Code Pro Black', style='italic', variant='normal', weight=400, stretch='normal', size='scalable')) = 11.05
2026-07-21 14:55:57 runnervm3jd5f matplotlib.font_manager[2874] DEBUG findfont: score(FontEntry(fname='/home/runner/micromamba/envs/trajan/fonts/Ubuntu-LI.ttf', index=0, name='Ubuntu', style='italic', variant='normal', weight=300, stretch='normal', size='scalable')) = 11.145
2026-07-21 14:55:57 runnervm3jd5f matplotlib.font_manager[2874] DEBUG findfont: score(FontEntry(fname='/home/runner/micromamba/envs/trajan/fonts/Ubuntu-LI.ttf', index=0, name='Ubuntu Light', style='italic', variant='normal', weight=400, stretch='normal', size='scalable')) = 11.05
2026-07-21 14:55:57 runnervm3jd5f matplotlib.font_manager[2874] DEBUG findfont: score(FontEntry(fname='/usr/share/fonts/truetype/liberation/LiberationMono-Regular.ttf', index=0, name='Liberation Mono', style='normal', variant='normal', weight=400, stretch='normal', size='scalable')) = 10.05
2026-07-21 14:55:57 runnervm3jd5f matplotlib.font_manager[2874] DEBUG findfont: score(FontEntry(fname='/home/runner/micromamba/envs/trajan/fonts/UbuntuMono-RI.ttf', index=0, name='Ubuntu Mono', style='italic', variant='normal', weight=400, stretch='normal', size='scalable')) = 11.05
2026-07-21 14:55:57 runnervm3jd5f matplotlib.font_manager[2874] DEBUG findfont: score(FontEntry(fname='/usr/share/fonts/truetype/lato/Lato-Heavy.ttf', index=0, name='Lato', style='normal', variant='normal', weight=800, stretch='normal', size='scalable')) = 10.43
2026-07-21 14:55:57 runnervm3jd5f matplotlib.font_manager[2874] DEBUG findfont: score(FontEntry(fname='/usr/share/fonts/truetype/lato/Lato-Heavy.ttf', index=0, name='Lato Heavy', style='normal', variant='normal', weight=400, stretch='normal', size='scalable')) = 10.05
2026-07-21 14:55:57 runnervm3jd5f matplotlib.font_manager[2874] DEBUG findfont: score(FontEntry(fname='/usr/share/fonts/truetype/lato/Lato-HairlineItalic.ttf', index=0, name='Lato', style='italic', variant='normal', weight=250, stretch='normal', size='scalable')) = 11.1925
2026-07-21 14:55:57 runnervm3jd5f matplotlib.font_manager[2874] DEBUG findfont: score(FontEntry(fname='/usr/share/fonts/truetype/lato/Lato-HairlineItalic.ttf', index=0, name='Lato Hairline', style='italic', variant='normal', weight=400, stretch='normal', size='scalable')) = 11.05
2026-07-21 14:55:57 runnervm3jd5f matplotlib.font_manager[2874] DEBUG findfont: score(FontEntry(fname='/usr/share/fonts/truetype/dejavu/DejaVuSerifCondensed-Bold.ttf', index=0, name='DejaVu Serif', style='normal', variant='normal', weight=700, stretch='condensed', size='scalable')) = 10.535
2026-07-21 14:55:57 runnervm3jd5f matplotlib.font_manager[2874] DEBUG findfont: score(FontEntry(fname='/usr/share/fonts/truetype/dejavu/DejaVuSerifCondensed-Bold.ttf', index=0, name='DejaVu Serif Condensed', style='normal', variant='normal', weight=700, stretch='condensed', size='scalable')) = 10.535
2026-07-21 14:55:57 runnervm3jd5f matplotlib.font_manager[2874] DEBUG findfont: score(FontEntry(fname='/usr/share/fonts/truetype/dejavu/DejaVuSansCondensed-Oblique.ttf', index=0, name='DejaVu Sans', style='oblique', variant='normal', weight=400, stretch='condensed', size='scalable')) = 11.25
2026-07-21 14:55:57 runnervm3jd5f matplotlib.font_manager[2874] DEBUG findfont: score(FontEntry(fname='/usr/share/fonts/truetype/dejavu/DejaVuSansCondensed-Oblique.ttf', index=0, name='DejaVu Sans Condensed', style='oblique', variant='normal', weight=400, stretch='condensed', size='scalable')) = 11.25
2026-07-21 14:55:57 runnervm3jd5f matplotlib.font_manager[2874] DEBUG findfont: score(FontEntry(fname='/usr/share/fonts/truetype/lato/Lato-SemiboldItalic.ttf', index=0, name='Lato', style='italic', variant='normal', weight=600, stretch='normal', size='scalable')) = 11.24
2026-07-21 14:55:57 runnervm3jd5f matplotlib.font_manager[2874] DEBUG findfont: score(FontEntry(fname='/usr/share/fonts/truetype/lato/Lato-SemiboldItalic.ttf', index=0, name='Lato Semibold', style='italic', variant='normal', weight=400, stretch='normal', size='scalable')) = 11.05
2026-07-21 14:55:57 runnervm3jd5f matplotlib.font_manager[2874] DEBUG findfont: score(FontEntry(fname='/usr/share/fonts/truetype/lato/Lato-Semibold.ttf', index=0, name='Lato', style='normal', variant='normal', weight=600, stretch='normal', size='scalable')) = 10.24
2026-07-21 14:55:57 runnervm3jd5f matplotlib.font_manager[2874] DEBUG findfont: score(FontEntry(fname='/usr/share/fonts/truetype/lato/Lato-Semibold.ttf', index=0, name='Lato Semibold', style='normal', variant='normal', weight=400, stretch='normal', size='scalable')) = 10.05
2026-07-21 14:55:57 runnervm3jd5f matplotlib.font_manager[2874] DEBUG findfont: score(FontEntry(fname='/home/runner/micromamba/envs/trajan/fonts/Inconsolata-Bold.ttf', index=0, name='Inconsolata', style='normal', variant='normal', weight=700, stretch='normal', size='scalable')) = 10.335
2026-07-21 14:55:57 runnervm3jd5f matplotlib.font_manager[2874] DEBUG findfont: score(FontEntry(fname='/usr/share/fonts/truetype/dejavu/DejaVuSans-ExtraLight.ttf', index=0, name='DejaVu Sans', style='normal', variant='normal', weight=200, stretch='normal', size='scalable')) = 10.24
2026-07-21 14:55:57 runnervm3jd5f matplotlib.font_manager[2874] DEBUG findfont: score(FontEntry(fname='/usr/share/fonts/truetype/dejavu/DejaVuSans-ExtraLight.ttf', index=0, name='DejaVu Sans Light', style='normal', variant='normal', weight=200, stretch='normal', size='scalable')) = 10.24
2026-07-21 14:55:57 runnervm3jd5f matplotlib.font_manager[2874] DEBUG findfont: score(FontEntry(fname='/home/runner/micromamba/envs/trajan/fonts/Ubuntu-BI.ttf', index=0, name='Ubuntu', style='italic', variant='normal', weight=700, stretch='normal', size='scalable')) = 11.335
2026-07-21 14:55:57 runnervm3jd5f matplotlib.font_manager[2874] DEBUG findfont: score(FontEntry(fname='/usr/share/fonts/truetype/dejavu/DejaVuSans-BoldOblique.ttf', index=0, name='DejaVu Sans', style='oblique', variant='normal', weight=700, stretch='normal', size='scalable')) = 11.335
2026-07-21 14:55:57 runnervm3jd5f matplotlib.font_manager[2874] DEBUG findfont: score(FontEntry(fname='/home/runner/micromamba/envs/trajan/fonts/Ubuntu-RI.ttf', index=0, name='Ubuntu', style='italic', variant='normal', weight=400, stretch='normal', size='scalable')) = 11.05
2026-07-21 14:55:57 runnervm3jd5f matplotlib.font_manager[2874] DEBUG findfont: score(FontEntry(fname='/usr/share/fonts/truetype/dejavu/DejaVuSerif-Italic.ttf', index=0, name='DejaVu Serif', style='italic', variant='normal', weight=400, stretch='normal', size='scalable')) = 11.05
2026-07-21 14:55:57 runnervm3jd5f matplotlib.font_manager[2874] DEBUG findfont: score(FontEntry(fname='/home/runner/micromamba/envs/trajan/fonts/SourceCodePro-Medium.ttf', index=0, name='Source Code Pro', style='normal', variant='normal', weight=500, stretch='normal', size='scalable')) = 10.145
2026-07-21 14:55:57 runnervm3jd5f matplotlib.font_manager[2874] DEBUG findfont: score(FontEntry(fname='/home/runner/micromamba/envs/trajan/fonts/SourceCodePro-Medium.ttf', index=0, name='Source Code Pro Medium', style='normal', variant='normal', weight=400, stretch='normal', size='scalable')) = 10.05
2026-07-21 14:55:57 runnervm3jd5f matplotlib.font_manager[2874] DEBUG findfont: score(FontEntry(fname='/usr/share/fonts/truetype/lato/Lato-HeavyItalic.ttf', index=0, name='Lato', style='italic', variant='normal', weight=800, stretch='normal', size='scalable')) = 11.43
2026-07-21 14:55:57 runnervm3jd5f matplotlib.font_manager[2874] DEBUG findfont: score(FontEntry(fname='/usr/share/fonts/truetype/lato/Lato-HeavyItalic.ttf', index=0, name='Lato Heavy', style='italic', variant='normal', weight=400, stretch='normal', size='scalable')) = 11.05
2026-07-21 14:55:57 runnervm3jd5f matplotlib.font_manager[2874] DEBUG findfont: score(FontEntry(fname='/usr/share/fonts/truetype/dejavu/DejaVuSans-Oblique.ttf', index=0, name='DejaVu Sans', style='oblique', variant='normal', weight=400, stretch='normal', size='scalable')) = 11.05
2026-07-21 14:55:57 runnervm3jd5f matplotlib.font_manager[2874] DEBUG findfont: score(FontEntry(fname='/home/runner/micromamba/envs/trajan/fonts/Ubuntu-M.ttf', index=0, name='Ubuntu', style='normal', variant='normal', weight=500, stretch='normal', size='scalable')) = 10.145
2026-07-21 14:55:57 runnervm3jd5f matplotlib.font_manager[2874] DEBUG findfont: score(FontEntry(fname='/home/runner/micromamba/envs/trajan/fonts/Ubuntu-M.ttf', index=0, name='Ubuntu Light', style='normal', variant='normal', weight=700, stretch='normal', size='scalable')) = 10.335
2026-07-21 14:55:57 runnervm3jd5f matplotlib.font_manager[2874] DEBUG findfont: score(FontEntry(fname='/usr/share/fonts/truetype/liberation/LiberationMono-BoldItalic.ttf', index=0, name='Liberation Mono', style='italic', variant='normal', weight=700, stretch='normal', size='scalable')) = 11.335
2026-07-21 14:55:57 runnervm3jd5f matplotlib.font_manager[2874] DEBUG findfont: score(FontEntry(fname='/usr/share/fonts/truetype/dejavu/DejaVuSansMono.ttf', index=0, name='DejaVu Sans Mono', style='normal', variant='normal', weight=400, stretch='normal', size='scalable')) = 10.05
2026-07-21 14:55:57 runnervm3jd5f matplotlib.font_manager[2874] DEBUG findfont: score(FontEntry(fname='/usr/share/fonts/truetype/dejavu/DejaVuMathTeXGyre.ttf', index=0, name='DejaVu Math TeX Gyre', style='normal', variant='normal', weight=400, stretch='normal', size='scalable')) = 10.05
2026-07-21 14:55:57 runnervm3jd5f matplotlib.font_manager[2874] DEBUG findfont: score(FontEntry(fname='/usr/share/fonts/truetype/dejavu/DejaVuSansMono-Oblique.ttf', index=0, name='DejaVu Sans Mono', style='oblique', variant='normal', weight=400, stretch='normal', size='scalable')) = 11.05
2026-07-21 14:55:57 runnervm3jd5f matplotlib.font_manager[2874] DEBUG findfont: score(FontEntry(fname='/home/runner/micromamba/envs/trajan/fonts/Ubuntu-L.ttf', index=0, name='Ubuntu', style='normal', variant='normal', weight=300, stretch='normal', size='scalable')) = 10.145
2026-07-21 14:55:57 runnervm3jd5f matplotlib.font_manager[2874] DEBUG findfont: score(FontEntry(fname='/home/runner/micromamba/envs/trajan/fonts/Ubuntu-L.ttf', index=0, name='Ubuntu Light', style='normal', variant='normal', weight=400, stretch='normal', size='scalable')) = 10.05
2026-07-21 14:55:57 runnervm3jd5f matplotlib.font_manager[2874] DEBUG findfont: score(FontEntry(fname='/home/runner/micromamba/envs/trajan/fonts/SourceCodePro-MediumIt.ttf', index=0, name='Source Code Pro', style='italic', variant='normal', weight=500, stretch='normal', size='scalable')) = 11.145
2026-07-21 14:55:57 runnervm3jd5f matplotlib.font_manager[2874] DEBUG findfont: score(FontEntry(fname='/home/runner/micromamba/envs/trajan/fonts/SourceCodePro-MediumIt.ttf', index=0, name='Source Code Pro Medium', style='italic', variant='normal', weight=400, stretch='normal', size='scalable')) = 11.05
2026-07-21 14:55:57 runnervm3jd5f matplotlib.font_manager[2874] DEBUG findfont: score(FontEntry(fname='/home/runner/micromamba/envs/trajan/fonts/SourceCodePro-Regular.ttf', index=0, name='Source Code Pro', style='normal', variant='normal', weight=400, stretch='normal', size='scalable')) = 10.05
2026-07-21 14:55:57 runnervm3jd5f matplotlib.font_manager[2874] DEBUG findfont: score(FontEntry(fname='/home/runner/micromamba/envs/trajan/fonts/SourceCodePro-SemiboldIt.ttf', index=0, name='Source Code Pro', style='italic', variant='normal', weight=600, stretch='normal', size='scalable')) = 11.24
2026-07-21 14:55:57 runnervm3jd5f matplotlib.font_manager[2874] DEBUG findfont: score(FontEntry(fname='/home/runner/micromamba/envs/trajan/fonts/SourceCodePro-SemiboldIt.ttf', index=0, name='Source Code Pro Semibold', style='italic', variant='normal', weight=400, stretch='normal', size='scalable')) = 11.05
2026-07-21 14:55:57 runnervm3jd5f matplotlib.font_manager[2874] DEBUG findfont: score(FontEntry(fname='/usr/share/fonts/truetype/dejavu/DejaVuSerif.ttf', index=0, name='DejaVu Serif', style='normal', variant='normal', weight=400, stretch='normal', size='scalable')) = 10.05
2026-07-21 14:55:57 runnervm3jd5f matplotlib.font_manager[2874] DEBUG findfont: score(FontEntry(fname='/usr/share/fonts/truetype/dejavu/DejaVuSerif-Bold.ttf', index=0, name='DejaVu Serif', style='normal', variant='normal', weight=700, stretch='normal', size='scalable')) = 10.335
2026-07-21 14:55:57 runnervm3jd5f matplotlib.font_manager[2874] DEBUG findfont: score(FontEntry(fname='/usr/share/fonts/truetype/liberation/LiberationSerif-Italic.ttf', index=0, name='Liberation Serif', style='italic', variant='normal', weight=400, stretch='normal', size='scalable')) = 11.05
2026-07-21 14:55:57 runnervm3jd5f matplotlib.font_manager[2874] DEBUG findfont: score(FontEntry(fname='/usr/share/fonts/truetype/dejavu/DejaVuSansMono-BoldOblique.ttf', index=0, name='DejaVu Sans Mono', style='oblique', variant='normal', weight=700, stretch='normal', size='scalable')) = 11.335
2026-07-21 14:55:57 runnervm3jd5f matplotlib.font_manager[2874] DEBUG findfont: score(FontEntry(fname='/home/runner/micromamba/envs/trajan/fonts/SourceCodePro-Light.ttf', index=0, name='Source Code Pro', style='normal', variant='normal', weight=300, stretch='normal', size='scalable')) = 10.145
2026-07-21 14:55:57 runnervm3jd5f matplotlib.font_manager[2874] DEBUG findfont: score(FontEntry(fname='/home/runner/micromamba/envs/trajan/fonts/SourceCodePro-Light.ttf', index=0, name='Source Code Pro Light', style='normal', variant='normal', weight=400, stretch='normal', size='scalable')) = 10.05
2026-07-21 14:55:57 runnervm3jd5f matplotlib.font_manager[2874] DEBUG findfont: score(FontEntry(fname='/usr/share/fonts/truetype/liberation/LiberationMono-Italic.ttf', index=0, name='Liberation Mono', style='italic', variant='normal', weight=400, stretch='normal', size='scalable')) = 11.05
2026-07-21 14:55:57 runnervm3jd5f matplotlib.font_manager[2874] DEBUG findfont: Matching STIXSizeOneSym:style=normal:variant=normal:weight=normal:stretch=normal:size=10.0 to STIXSizeOneSym ('/home/runner/micromamba/envs/trajan/lib/python3.14/site-packages/matplotlib/mpl-data/fonts/ttf/STIXSizOneSymReg.ttf') with score of 0.050000.
2026-07-21 14:55:57 runnervm3jd5f matplotlib.font_manager[2874] DEBUG findfont: Matching STIXSizeTwoSym:style=normal:variant=normal:weight=normal:stretch=normal:size=10.0.
2026-07-21 14:55:57 runnervm3jd5f matplotlib.font_manager[2874] DEBUG findfont: score(FontEntry(fname='/home/runner/micromamba/envs/trajan/lib/python3.14/site-packages/matplotlib/mpl-data/fonts/ttf/cmmi10.ttf', index=0, name='cmmi10', style='normal', variant='normal', weight=400, stretch='normal', size='scalable')) = 10.05
2026-07-21 14:55:57 runnervm3jd5f matplotlib.font_manager[2874] DEBUG findfont: score(FontEntry(fname='/home/runner/micromamba/envs/trajan/lib/python3.14/site-packages/matplotlib/mpl-data/fonts/ttf/DejaVuSerif-Bold.ttf', index=0, name='DejaVu Serif', style='normal', variant='normal', weight=700, stretch='normal', size='scalable')) = 10.335
2026-07-21 14:55:57 runnervm3jd5f matplotlib.font_manager[2874] DEBUG findfont: score(FontEntry(fname='/home/runner/micromamba/envs/trajan/lib/python3.14/site-packages/matplotlib/mpl-data/fonts/ttf/DejaVuSans-Oblique.ttf', index=0, name='DejaVu Sans', style='oblique', variant='normal', weight=400, stretch='normal', size='scalable')) = 11.05
2026-07-21 14:55:57 runnervm3jd5f matplotlib.font_manager[2874] DEBUG findfont: score(FontEntry(fname='/home/runner/micromamba/envs/trajan/lib/python3.14/site-packages/matplotlib/mpl-data/fonts/ttf/STIXSizThreeSymReg.ttf', index=0, name='STIXSizeThreeSym', style='normal', variant='normal', weight=400, stretch='normal', size='scalable')) = 10.05
2026-07-21 14:55:57 runnervm3jd5f matplotlib.font_manager[2874] DEBUG findfont: score(FontEntry(fname='/home/runner/micromamba/envs/trajan/lib/python3.14/site-packages/matplotlib/mpl-data/fonts/ttf/STIXNonUniBolIta.ttf', index=0, name='STIXNonUnicode', style='italic', variant='normal', weight=700, stretch='normal', size='scalable')) = 11.335
2026-07-21 14:55:57 runnervm3jd5f matplotlib.font_manager[2874] DEBUG findfont: score(FontEntry(fname='/home/runner/micromamba/envs/trajan/lib/python3.14/site-packages/matplotlib/mpl-data/fonts/ttf/DejaVuSerifDisplay.ttf', index=0, name='DejaVu Serif Display', style='normal', variant='normal', weight=400, stretch='normal', size='scalable')) = 10.05
2026-07-21 14:55:57 runnervm3jd5f matplotlib.font_manager[2874] DEBUG findfont: score(FontEntry(fname='/home/runner/micromamba/envs/trajan/lib/python3.14/site-packages/matplotlib/mpl-data/fonts/ttf/cmss10.ttf', index=0, name='cmss10', style='normal', variant='normal', weight=400, stretch='normal', size='scalable')) = 10.05
2026-07-21 14:55:57 runnervm3jd5f matplotlib.font_manager[2874] DEBUG findfont: score(FontEntry(fname='/home/runner/micromamba/envs/trajan/lib/python3.14/site-packages/matplotlib/mpl-data/fonts/ttf/STIXGeneralBolIta.ttf', index=0, name='STIXGeneral', style='italic', variant='normal', weight=700, stretch='normal', size='scalable')) = 11.335
2026-07-21 14:55:57 runnervm3jd5f matplotlib.font_manager[2874] DEBUG findfont: score(FontEntry(fname='/home/runner/micromamba/envs/trajan/lib/python3.14/site-packages/matplotlib/mpl-data/fonts/ttf/cmtt10.ttf', index=0, name='cmtt10', style='normal', variant='normal', weight=400, stretch='normal', size='scalable')) = 10.05
2026-07-21 14:55:57 runnervm3jd5f matplotlib.font_manager[2874] DEBUG findfont: score(FontEntry(fname='/home/runner/micromamba/envs/trajan/lib/python3.14/site-packages/matplotlib/mpl-data/fonts/ttf/cmsy10.ttf', index=0, name='cmsy10', style='normal', variant='normal', weight=400, stretch='normal', size='scalable')) = 10.05
2026-07-21 14:55:57 runnervm3jd5f matplotlib.font_manager[2874] DEBUG findfont: score(FontEntry(fname='/home/runner/micromamba/envs/trajan/lib/python3.14/site-packages/matplotlib/mpl-data/fonts/ttf/DejaVuSansMono-Oblique.ttf', index=0, name='DejaVu Sans Mono', style='oblique', variant='normal', weight=400, stretch='normal', size='scalable')) = 11.05
2026-07-21 14:55:57 runnervm3jd5f matplotlib.font_manager[2874] DEBUG findfont: score(FontEntry(fname='/home/runner/micromamba/envs/trajan/lib/python3.14/site-packages/matplotlib/mpl-data/fonts/ttf/STIXNonUniIta.ttf', index=0, name='STIXNonUnicode', style='italic', variant='normal', weight=400, stretch='normal', size='scalable')) = 11.05
2026-07-21 14:55:57 runnervm3jd5f matplotlib.font_manager[2874] DEBUG findfont: score(FontEntry(fname='/home/runner/micromamba/envs/trajan/lib/python3.14/site-packages/matplotlib/mpl-data/fonts/ttf/STIXGeneral.ttf', index=0, name='STIXGeneral', style='normal', variant='normal', weight=400, stretch='normal', size='scalable')) = 10.05
2026-07-21 14:55:57 runnervm3jd5f matplotlib.font_manager[2874] DEBUG findfont: score(FontEntry(fname='/home/runner/micromamba/envs/trajan/lib/python3.14/site-packages/matplotlib/mpl-data/fonts/ttf/cmti10.ttf', index=0, name='cmti10', style='normal', variant='normal', weight=400, stretch='normal', size='scalable')) = 10.05
2026-07-21 14:55:57 runnervm3jd5f matplotlib.font_manager[2874] DEBUG findfont: score(FontEntry(fname='/home/runner/micromamba/envs/trajan/lib/python3.14/site-packages/matplotlib/mpl-data/fonts/ttf/DejaVuSansMono-BoldOblique.ttf', index=0, name='DejaVu Sans Mono', style='oblique', variant='normal', weight=700, stretch='normal', size='scalable')) = 11.335
2026-07-21 14:55:57 runnervm3jd5f matplotlib.font_manager[2874] DEBUG findfont: score(FontEntry(fname='/home/runner/micromamba/envs/trajan/lib/python3.14/site-packages/matplotlib/mpl-data/fonts/ttf/DejaVuSerif.ttf', index=0, name='DejaVu Serif', style='normal', variant='normal', weight=400, stretch='normal', size='scalable')) = 10.05
2026-07-21 14:55:57 runnervm3jd5f matplotlib.font_manager[2874] DEBUG findfont: score(FontEntry(fname='/home/runner/micromamba/envs/trajan/lib/python3.14/site-packages/matplotlib/mpl-data/fonts/ttf/LastResortHE-Regular.ttf', index=0, name='Last Resort High-Efficiency', style='normal', variant='normal', weight=400, stretch='normal', size='scalable')) = 10.05
2026-07-21 14:55:57 runnervm3jd5f matplotlib.font_manager[2874] DEBUG findfont: score(FontEntry(fname='/home/runner/micromamba/envs/trajan/lib/python3.14/site-packages/matplotlib/mpl-data/fonts/ttf/cmex10.ttf', index=0, name='cmex10', style='normal', variant='normal', weight=400, stretch='normal', size='scalable')) = 10.05
2026-07-21 14:55:57 runnervm3jd5f matplotlib.font_manager[2874] DEBUG findfont: score(FontEntry(fname='/home/runner/micromamba/envs/trajan/lib/python3.14/site-packages/matplotlib/mpl-data/fonts/ttf/STIXSizFiveSymReg.ttf', index=0, name='STIXSizeFiveSym', style='normal', variant='normal', weight=400, stretch='normal', size='scalable')) = 10.05
2026-07-21 14:55:57 runnervm3jd5f matplotlib.font_manager[2874] DEBUG findfont: score(FontEntry(fname='/home/runner/micromamba/envs/trajan/lib/python3.14/site-packages/matplotlib/mpl-data/fonts/ttf/STIXNonUniBol.ttf', index=0, name='STIXNonUnicode', style='normal', variant='normal', weight=700, stretch='normal', size='scalable')) = 10.335
2026-07-21 14:55:57 runnervm3jd5f matplotlib.font_manager[2874] DEBUG findfont: score(FontEntry(fname='/home/runner/micromamba/envs/trajan/lib/python3.14/site-packages/matplotlib/mpl-data/fonts/ttf/DejaVuSansDisplay.ttf', index=0, name='DejaVu Sans Display', style='normal', variant='normal', weight=400, stretch='normal', size='scalable')) = 10.05
2026-07-21 14:55:57 runnervm3jd5f matplotlib.font_manager[2874] DEBUG findfont: score(FontEntry(fname='/home/runner/micromamba/envs/trajan/lib/python3.14/site-packages/matplotlib/mpl-data/fonts/ttf/DejaVuSansMono.ttf', index=0, name='DejaVu Sans Mono', style='normal', variant='normal', weight=400, stretch='normal', size='scalable')) = 10.05
2026-07-21 14:55:57 runnervm3jd5f matplotlib.font_manager[2874] DEBUG findfont: score(FontEntry(fname='/home/runner/micromamba/envs/trajan/lib/python3.14/site-packages/matplotlib/mpl-data/fonts/ttf/cmb10.ttf', index=0, name='cmb10', style='normal', variant='normal', weight=400, stretch='normal', size='scalable')) = 10.05
2026-07-21 14:55:57 runnervm3jd5f matplotlib.font_manager[2874] DEBUG findfont: score(FontEntry(fname='/home/runner/micromamba/envs/trajan/lib/python3.14/site-packages/matplotlib/mpl-data/fonts/ttf/STIXSizTwoSymReg.ttf', index=0, name='STIXSizeTwoSym', style='normal', variant='normal', weight=400, stretch='normal', size='scalable')) = 0.05
2026-07-21 14:55:57 runnervm3jd5f matplotlib.font_manager[2874] DEBUG findfont: score(FontEntry(fname='/home/runner/micromamba/envs/trajan/lib/python3.14/site-packages/matplotlib/mpl-data/fonts/ttf/DejaVuSans.ttf', index=0, name='DejaVu Sans', style='normal', variant='normal', weight=400, stretch='normal', size='scalable')) = 10.05
2026-07-21 14:55:57 runnervm3jd5f matplotlib.font_manager[2874] DEBUG findfont: score(FontEntry(fname='/home/runner/micromamba/envs/trajan/lib/python3.14/site-packages/matplotlib/mpl-data/fonts/ttf/STIXNonUni.ttf', index=0, name='STIXNonUnicode', style='normal', variant='normal', weight=400, stretch='normal', size='scalable')) = 10.05
2026-07-21 14:55:57 runnervm3jd5f matplotlib.font_manager[2874] DEBUG findfont: score(FontEntry(fname='/home/runner/micromamba/envs/trajan/lib/python3.14/site-packages/matplotlib/mpl-data/fonts/ttf/STIXGeneralItalic.ttf', index=0, name='STIXGeneral', style='italic', variant='normal', weight=400, stretch='normal', size='scalable')) = 11.05
2026-07-21 14:55:57 runnervm3jd5f matplotlib.font_manager[2874] DEBUG findfont: score(FontEntry(fname='/home/runner/micromamba/envs/trajan/lib/python3.14/site-packages/matplotlib/mpl-data/fonts/ttf/STIXSizOneSymBol.ttf', index=0, name='STIXSizeOneSym', style='normal', variant='normal', weight=700, stretch='normal', size='scalable')) = 10.335
2026-07-21 14:55:57 runnervm3jd5f matplotlib.font_manager[2874] DEBUG findfont: score(FontEntry(fname='/home/runner/micromamba/envs/trajan/lib/python3.14/site-packages/matplotlib/mpl-data/fonts/ttf/DejaVuSansMono-Bold.ttf', index=0, name='DejaVu Sans Mono', style='normal', variant='normal', weight=700, stretch='normal', size='scalable')) = 10.335
2026-07-21 14:55:57 runnervm3jd5f matplotlib.font_manager[2874] DEBUG findfont: score(FontEntry(fname='/home/runner/micromamba/envs/trajan/lib/python3.14/site-packages/matplotlib/mpl-data/fonts/ttf/STIXSizTwoSymBol.ttf', index=0, name='STIXSizeTwoSym', style='normal', variant='normal', weight=700, stretch='normal', size='scalable')) = 0.33499999999999996
2026-07-21 14:55:57 runnervm3jd5f matplotlib.font_manager[2874] DEBUG findfont: score(FontEntry(fname='/home/runner/micromamba/envs/trajan/lib/python3.14/site-packages/matplotlib/mpl-data/fonts/ttf/STIXSizThreeSymBol.ttf', index=0, name='STIXSizeThreeSym', style='normal', variant='normal', weight=700, stretch='normal', size='scalable')) = 10.335
2026-07-21 14:55:57 runnervm3jd5f matplotlib.font_manager[2874] DEBUG findfont: score(FontEntry(fname='/home/runner/micromamba/envs/trajan/lib/python3.14/site-packages/matplotlib/mpl-data/fonts/ttf/DejaVuSerif-BoldItalic.ttf', index=0, name='DejaVu Serif', style='italic', variant='normal', weight=700, stretch='normal', size='scalable')) = 11.335
2026-07-21 14:55:57 runnervm3jd5f matplotlib.font_manager[2874] DEBUG findfont: score(FontEntry(fname='/home/runner/micromamba/envs/trajan/lib/python3.14/site-packages/matplotlib/mpl-data/fonts/ttf/DejaVuSerif-Italic.ttf', index=0, name='DejaVu Serif', style='italic', variant='normal', weight=400, stretch='normal', size='scalable')) = 11.05
2026-07-21 14:55:57 runnervm3jd5f matplotlib.font_manager[2874] DEBUG findfont: score(FontEntry(fname='/home/runner/micromamba/envs/trajan/lib/python3.14/site-packages/matplotlib/mpl-data/fonts/ttf/DejaVuSans-Bold.ttf', index=0, name='DejaVu Sans', style='normal', variant='normal', weight=700, stretch='normal', size='scalable')) = 10.335
2026-07-21 14:55:57 runnervm3jd5f matplotlib.font_manager[2874] DEBUG findfont: score(FontEntry(fname='/home/runner/micromamba/envs/trajan/lib/python3.14/site-packages/matplotlib/mpl-data/fonts/ttf/STIXSizFourSymBol.ttf', index=0, name='STIXSizeFourSym', style='normal', variant='normal', weight=700, stretch='normal', size='scalable')) = 10.335
2026-07-21 14:55:57 runnervm3jd5f matplotlib.font_manager[2874] DEBUG findfont: score(FontEntry(fname='/home/runner/micromamba/envs/trajan/lib/python3.14/site-packages/matplotlib/mpl-data/fonts/ttf/STIXSizOneSymReg.ttf', index=0, name='STIXSizeOneSym', style='normal', variant='normal', weight=400, stretch='normal', size='scalable')) = 10.05
2026-07-21 14:55:57 runnervm3jd5f matplotlib.font_manager[2874] DEBUG findfont: score(FontEntry(fname='/home/runner/micromamba/envs/trajan/lib/python3.14/site-packages/matplotlib/mpl-data/fonts/ttf/cmr10.ttf', index=0, name='cmr10', style='normal', variant='normal', weight=400, stretch='normal', size='scalable')) = 10.05
2026-07-21 14:55:57 runnervm3jd5f matplotlib.font_manager[2874] DEBUG findfont: score(FontEntry(fname='/home/runner/micromamba/envs/trajan/lib/python3.14/site-packages/matplotlib/mpl-data/fonts/ttf/STIXGeneralBol.ttf', index=0, name='STIXGeneral', style='normal', variant='normal', weight=700, stretch='normal', size='scalable')) = 10.335
2026-07-21 14:55:57 runnervm3jd5f matplotlib.font_manager[2874] DEBUG findfont: score(FontEntry(fname='/home/runner/micromamba/envs/trajan/lib/python3.14/site-packages/matplotlib/mpl-data/fonts/ttf/DejaVuSans-BoldOblique.ttf', index=0, name='DejaVu Sans', style='oblique', variant='normal', weight=700, stretch='normal', size='scalable')) = 11.335
2026-07-21 14:55:57 runnervm3jd5f matplotlib.font_manager[2874] DEBUG findfont: score(FontEntry(fname='/home/runner/micromamba/envs/trajan/lib/python3.14/site-packages/matplotlib/mpl-data/fonts/ttf/STIXSizFourSymReg.ttf', index=0, name='STIXSizeFourSym', style='normal', variant='normal', weight=400, stretch='normal', size='scalable')) = 10.05
2026-07-21 14:55:57 runnervm3jd5f matplotlib.font_manager[2874] DEBUG findfont: score(FontEntry(fname='/usr/share/fonts/truetype/lato/Lato-Black.ttf', index=0, name='Lato', style='normal', variant='normal', weight=900, stretch='normal', size='scalable')) = 10.525
2026-07-21 14:55:57 runnervm3jd5f matplotlib.font_manager[2874] DEBUG findfont: score(FontEntry(fname='/usr/share/fonts/truetype/lato/Lato-Black.ttf', index=0, name='Lato Black', style='normal', variant='normal', weight=400, stretch='normal', size='scalable')) = 10.05
2026-07-21 14:55:57 runnervm3jd5f matplotlib.font_manager[2874] DEBUG findfont: score(FontEntry(fname='/usr/share/fonts/truetype/liberation/LiberationSerif-Regular.ttf', index=0, name='Liberation Serif', style='normal', variant='normal', weight=400, stretch='normal', size='scalable')) = 10.05
2026-07-21 14:55:57 runnervm3jd5f matplotlib.font_manager[2874] DEBUG findfont: score(FontEntry(fname='/usr/share/fonts/truetype/dejavu/DejaVuSerifCondensed.ttf', index=0, name='DejaVu Serif', style='normal', variant='normal', weight=400, stretch='condensed', size='scalable')) = 10.25
2026-07-21 14:55:57 runnervm3jd5f matplotlib.font_manager[2874] DEBUG findfont: score(FontEntry(fname='/usr/share/fonts/truetype/dejavu/DejaVuSerifCondensed.ttf', index=0, name='DejaVu Serif Condensed', style='normal', variant='normal', weight=380, stretch='condensed', size='scalable')) = 10.269
2026-07-21 14:55:57 runnervm3jd5f matplotlib.font_manager[2874] DEBUG findfont: score(FontEntry(fname='/home/runner/micromamba/envs/trajan/fonts/UbuntuMono-BI.ttf', index=0, name='Ubuntu Mono', style='italic', variant='normal', weight=700, stretch='normal', size='scalable')) = 11.335
2026-07-21 14:55:57 runnervm3jd5f matplotlib.font_manager[2874] DEBUG findfont: score(FontEntry(fname='/usr/share/fonts/truetype/dejavu/DejaVuSans.ttf', index=0, name='DejaVu Sans', style='normal', variant='normal', weight=400, stretch='normal', size='scalable')) = 10.05
2026-07-21 14:55:57 runnervm3jd5f matplotlib.font_manager[2874] DEBUG findfont: score(FontEntry(fname='/usr/share/fonts/truetype/lato/Lato-Italic.ttf', index=0, name='Lato', style='italic', variant='normal', weight=400, stretch='normal', size='scalable')) = 11.05
2026-07-21 14:55:57 runnervm3jd5f matplotlib.font_manager[2874] DEBUG findfont: score(FontEntry(fname='/usr/share/fonts/truetype/liberation/LiberationSans-Italic.ttf', index=0, name='Liberation Sans', style='italic', variant='normal', weight=400, stretch='normal', size='scalable')) = 11.05
2026-07-21 14:55:57 runnervm3jd5f matplotlib.font_manager[2874] DEBUG findfont: score(FontEntry(fname='/home/runner/micromamba/envs/trajan/fonts/Ubuntu-B.ttf', index=0, name='Ubuntu', style='normal', variant='normal', weight=700, stretch='normal', size='scalable')) = 10.335
2026-07-21 14:55:57 runnervm3jd5f matplotlib.font_manager[2874] DEBUG findfont: score(FontEntry(fname='/home/runner/micromamba/envs/trajan/fonts/SourceCodePro-Semibold.ttf', index=0, name='Source Code Pro', style='normal', variant='normal', weight=600, stretch='normal', size='scalable')) = 10.24
2026-07-21 14:55:57 runnervm3jd5f matplotlib.font_manager[2874] DEBUG findfont: score(FontEntry(fname='/home/runner/micromamba/envs/trajan/fonts/SourceCodePro-Semibold.ttf', index=0, name='Source Code Pro Semibold', style='normal', variant='normal', weight=400, stretch='normal', size='scalable')) = 10.05
2026-07-21 14:55:57 runnervm3jd5f matplotlib.font_manager[2874] DEBUG findfont: score(FontEntry(fname='/home/runner/micromamba/envs/trajan/fonts/SourceCodePro-Bold.ttf', index=0, name='Source Code Pro', style='normal', variant='normal', weight=700, stretch='normal', size='scalable')) = 10.335
2026-07-21 14:55:57 runnervm3jd5f matplotlib.font_manager[2874] DEBUG findfont: score(FontEntry(fname='/home/runner/micromamba/envs/trajan/fonts/Ubuntu-MI.ttf', index=0, name='Ubuntu', style='italic', variant='normal', weight=500, stretch='normal', size='scalable')) = 11.145
2026-07-21 14:55:57 runnervm3jd5f matplotlib.font_manager[2874] DEBUG findfont: score(FontEntry(fname='/home/runner/micromamba/envs/trajan/fonts/Ubuntu-MI.ttf', index=0, name='Ubuntu Light', style='italic', variant='normal', weight=700, stretch='normal', size='scalable')) = 11.335
2026-07-21 14:55:57 runnervm3jd5f matplotlib.font_manager[2874] DEBUG findfont: score(FontEntry(fname='/usr/share/fonts/truetype/lato/Lato-Regular.ttf', index=0, name='Lato', style='normal', variant='normal', weight=400, stretch='normal', size='scalable')) = 10.05
2026-07-21 14:55:57 runnervm3jd5f matplotlib.font_manager[2874] DEBUG findfont: score(FontEntry(fname='/usr/share/fonts/truetype/lato/Lato-ThinItalic.ttf', index=0, name='Lato', style='italic', variant='normal', weight=275, stretch='normal', size='scalable')) = 11.16875
2026-07-21 14:55:57 runnervm3jd5f matplotlib.font_manager[2874] DEBUG findfont: score(FontEntry(fname='/usr/share/fonts/truetype/lato/Lato-ThinItalic.ttf', index=0, name='Lato Thin', style='italic', variant='normal', weight=400, stretch='normal', size='scalable')) = 11.05
2026-07-21 14:55:57 runnervm3jd5f matplotlib.font_manager[2874] DEBUG findfont: score(FontEntry(fname='/usr/share/fonts/truetype/lato/Lato-BlackItalic.ttf', index=0, name='Lato', style='italic', variant='normal', weight=900, stretch='normal', size='scalable')) = 11.525
2026-07-21 14:55:57 runnervm3jd5f matplotlib.font_manager[2874] DEBUG findfont: score(FontEntry(fname='/usr/share/fonts/truetype/lato/Lato-BlackItalic.ttf', index=0, name='Lato Black', style='italic', variant='normal', weight=400, stretch='normal', size='scalable')) = 11.05
2026-07-21 14:55:57 runnervm3jd5f matplotlib.font_manager[2874] DEBUG findfont: score(FontEntry(fname='/usr/share/fonts/truetype/dejavu/DejaVuSerifCondensed-Italic.ttf', index=0, name='DejaVu Serif', style='italic', variant='normal', weight=400, stretch='condensed', size='scalable')) = 11.25
2026-07-21 14:55:57 runnervm3jd5f matplotlib.font_manager[2874] DEBUG findfont: score(FontEntry(fname='/usr/share/fonts/truetype/dejavu/DejaVuSerifCondensed-Italic.ttf', index=0, name='DejaVu Serif Condensed', style='italic', variant='normal', weight=400, stretch='condensed', size='scalable')) = 11.25
2026-07-21 14:55:57 runnervm3jd5f matplotlib.font_manager[2874] DEBUG findfont: score(FontEntry(fname='/usr/share/fonts/truetype/dejavu/DejaVuSans-Bold.ttf', index=0, name='DejaVu Sans', style='normal', variant='normal', weight=700, stretch='normal', size='scalable')) = 10.335
2026-07-21 14:55:57 runnervm3jd5f matplotlib.font_manager[2874] DEBUG findfont: score(FontEntry(fname='/home/runner/micromamba/envs/trajan/fonts/UbuntuMono-R.ttf', index=0, name='Ubuntu Mono', style='normal', variant='normal', weight=400, stretch='normal', size='scalable')) = 10.05
2026-07-21 14:55:57 runnervm3jd5f matplotlib.font_manager[2874] DEBUG findfont: score(FontEntry(fname='/usr/share/fonts/truetype/dejavu/DejaVuSerif-BoldItalic.ttf', index=0, name='DejaVu Serif', style='italic', variant='normal', weight=700, stretch='normal', size='scalable')) = 11.335
2026-07-21 14:55:57 runnervm3jd5f matplotlib.font_manager[2874] DEBUG findfont: score(FontEntry(fname='/usr/share/fonts/truetype/lato/Lato-Hairline.ttf', index=0, name='Lato', style='normal', variant='normal', weight=250, stretch='normal', size='scalable')) = 10.1925
2026-07-21 14:55:57 runnervm3jd5f matplotlib.font_manager[2874] DEBUG findfont: score(FontEntry(fname='/usr/share/fonts/truetype/lato/Lato-Hairline.ttf', index=0, name='Lato Hairline', style='normal', variant='normal', weight=400, stretch='normal', size='scalable')) = 10.05
2026-07-21 14:55:57 runnervm3jd5f matplotlib.font_manager[2874] DEBUG findfont: score(FontEntry(fname='/usr/share/fonts/truetype/lato/Lato-LightItalic.ttf', index=0, name='Lato', style='italic', variant='normal', weight=300, stretch='normal', size='scalable')) = 11.145
2026-07-21 14:55:57 runnervm3jd5f matplotlib.font_manager[2874] DEBUG findfont: score(FontEntry(fname='/usr/share/fonts/truetype/lato/Lato-LightItalic.ttf', index=0, name='Lato Light', style='italic', variant='normal', weight=400, stretch='normal', size='scalable')) = 11.05
2026-07-21 14:55:57 runnervm3jd5f matplotlib.font_manager[2874] DEBUG findfont: score(FontEntry(fname='/usr/share/fonts/truetype/dejavu/DejaVuSansCondensed-BoldOblique.ttf', index=0, name='DejaVu Sans', style='oblique', variant='normal', weight=700, stretch='condensed', size='scalable')) = 11.535
2026-07-21 14:55:57 runnervm3jd5f matplotlib.font_manager[2874] DEBUG findfont: score(FontEntry(fname='/usr/share/fonts/truetype/dejavu/DejaVuSansCondensed-BoldOblique.ttf', index=0, name='DejaVu Sans Condensed', style='oblique', variant='normal', weight=700, stretch='condensed', size='scalable')) = 11.535
2026-07-21 14:55:57 runnervm3jd5f matplotlib.font_manager[2874] DEBUG findfont: score(FontEntry(fname='/home/runner/micromamba/envs/trajan/fonts/SourceCodePro-It.ttf', index=0, name='Source Code Pro', style='italic', variant='normal', weight=400, stretch='normal', size='scalable')) = 11.05
2026-07-21 14:55:57 runnervm3jd5f matplotlib.font_manager[2874] DEBUG findfont: score(FontEntry(fname='/home/runner/micromamba/envs/trajan/fonts/SourceCodePro-ExtraLightIt.ttf', index=0, name='Source Code Pro', style='italic', variant='normal', weight=200, stretch='normal', size='scalable')) = 11.24
2026-07-21 14:55:57 runnervm3jd5f matplotlib.font_manager[2874] DEBUG findfont: score(FontEntry(fname='/home/runner/micromamba/envs/trajan/fonts/SourceCodePro-ExtraLightIt.ttf', index=0, name='Source Code Pro ExtraLight', style='italic', variant='normal', weight=400, stretch='normal', size='scalable')) = 11.05
2026-07-21 14:55:57 runnervm3jd5f matplotlib.font_manager[2874] DEBUG findfont: score(FontEntry(fname='/usr/share/fonts/truetype/lato/Lato-Medium.ttf', index=0, name='Lato', style='normal', variant='normal', weight=500, stretch='normal', size='scalable')) = 10.145
2026-07-21 14:55:57 runnervm3jd5f matplotlib.font_manager[2874] DEBUG findfont: score(FontEntry(fname='/usr/share/fonts/truetype/lato/Lato-Medium.ttf', index=0, name='Lato Medium', style='normal', variant='normal', weight=400, stretch='normal', size='scalable')) = 10.05
2026-07-21 14:55:57 runnervm3jd5f matplotlib.font_manager[2874] DEBUG findfont: score(FontEntry(fname='/usr/share/fonts/truetype/lato/Lato-BoldItalic.ttf', index=0, name='Lato', style='italic', variant='normal', weight=700, stretch='normal', size='scalable')) = 11.335
2026-07-21 14:55:57 runnervm3jd5f matplotlib.font_manager[2874] DEBUG findfont: score(FontEntry(fname='/home/runner/micromamba/envs/trajan/fonts/DejaVuSans.ttf', index=0, name='DejaVu Sans', style='normal', variant='normal', weight=400, stretch='normal', size='scalable')) = 10.05
2026-07-21 14:55:57 runnervm3jd5f matplotlib.font_manager[2874] DEBUG findfont: score(FontEntry(fname='/home/runner/micromamba/envs/trajan/fonts/UbuntuMono-B.ttf', index=0, name='Ubuntu Mono', style='normal', variant='normal', weight=700, stretch='normal', size='scalable')) = 10.335
2026-07-21 14:55:57 runnervm3jd5f matplotlib.font_manager[2874] DEBUG findfont: score(FontEntry(fname='/home/runner/micromamba/envs/trajan/fonts/SourceCodePro-LightIt.ttf', index=0, name='Source Code Pro', style='italic', variant='normal', weight=300, stretch='normal', size='scalable')) = 11.145
2026-07-21 14:55:57 runnervm3jd5f matplotlib.font_manager[2874] DEBUG findfont: score(FontEntry(fname='/home/runner/micromamba/envs/trajan/fonts/SourceCodePro-LightIt.ttf', index=0, name='Source Code Pro Light', style='italic', variant='normal', weight=400, stretch='normal', size='scalable')) = 11.05
2026-07-21 14:55:57 runnervm3jd5f matplotlib.font_manager[2874] DEBUG findfont: score(FontEntry(fname='/usr/share/fonts/truetype/liberation/LiberationSans-BoldItalic.ttf', index=0, name='Liberation Sans', style='italic', variant='normal', weight=700, stretch='normal', size='scalable')) = 11.335
2026-07-21 14:55:57 runnervm3jd5f matplotlib.font_manager[2874] DEBUG findfont: score(FontEntry(fname='/usr/share/fonts/truetype/liberation/LiberationSans-Regular.ttf', index=0, name='Liberation Sans', style='normal', variant='normal', weight=400, stretch='normal', size='scalable')) = 10.05
2026-07-21 14:55:57 runnervm3jd5f matplotlib.font_manager[2874] DEBUG findfont: score(FontEntry(fname='/usr/share/fonts/truetype/dejavu/DejaVuSansMono-Bold.ttf', index=0, name='DejaVu Sans Mono', style='normal', variant='normal', weight=700, stretch='normal', size='scalable')) = 10.335
2026-07-21 14:55:57 runnervm3jd5f matplotlib.font_manager[2874] DEBUG findfont: score(FontEntry(fname='/home/runner/micromamba/envs/trajan/fonts/SourceCodePro-BoldIt.ttf', index=0, name='Source Code Pro', style='italic', variant='normal', weight=700, stretch='normal', size='scalable')) = 11.335
2026-07-21 14:55:57 runnervm3jd5f matplotlib.font_manager[2874] DEBUG findfont: score(FontEntry(fname='/usr/share/fonts/truetype/lato/Lato-Bold.ttf', index=0, name='Lato', style='normal', variant='normal', weight=700, stretch='normal', size='scalable')) = 10.335
2026-07-21 14:55:57 runnervm3jd5f matplotlib.font_manager[2874] DEBUG findfont: score(FontEntry(fname='/usr/share/fonts/truetype/dejavu/DejaVuSansCondensed.ttf', index=0, name='DejaVu Sans', style='normal', variant='normal', weight=400, stretch='condensed', size='scalable')) = 10.25
2026-07-21 14:55:57 runnervm3jd5f matplotlib.font_manager[2874] DEBUG findfont: score(FontEntry(fname='/usr/share/fonts/truetype/dejavu/DejaVuSansCondensed.ttf', index=0, name='DejaVu Sans Condensed', style='normal', variant='normal', weight=380, stretch='condensed', size='scalable')) = 10.269
2026-07-21 14:55:57 runnervm3jd5f matplotlib.font_manager[2874] DEBUG findfont: score(FontEntry(fname='/usr/share/fonts/truetype/lato/Lato-MediumItalic.ttf', index=0, name='Lato', style='italic', variant='normal', weight=500, stretch='normal', size='scalable')) = 11.145
2026-07-21 14:55:57 runnervm3jd5f matplotlib.font_manager[2874] DEBUG findfont: score(FontEntry(fname='/usr/share/fonts/truetype/lato/Lato-MediumItalic.ttf', index=0, name='Lato Medium', style='italic', variant='normal', weight=400, stretch='normal', size='scalable')) = 11.05
2026-07-21 14:55:57 runnervm3jd5f matplotlib.font_manager[2874] DEBUG findfont: score(FontEntry(fname='/usr/share/fonts/truetype/liberation/LiberationSans-Bold.ttf', index=0, name='Liberation Sans', style='normal', variant='normal', weight=700, stretch='normal', size='scalable')) = 10.335
2026-07-21 14:55:57 runnervm3jd5f matplotlib.font_manager[2874] DEBUG findfont: score(FontEntry(fname='/usr/share/fonts/truetype/dejavu/DejaVuSerifCondensed-BoldItalic.ttf', index=0, name='DejaVu Serif', style='italic', variant='normal', weight=700, stretch='condensed', size='scalable')) = 11.535
2026-07-21 14:55:57 runnervm3jd5f matplotlib.font_manager[2874] DEBUG findfont: score(FontEntry(fname='/usr/share/fonts/truetype/dejavu/DejaVuSerifCondensed-BoldItalic.ttf', index=0, name='DejaVu Serif Condensed', style='italic', variant='normal', weight=700, stretch='condensed', size='scalable')) = 11.535
2026-07-21 14:55:57 runnervm3jd5f matplotlib.font_manager[2874] DEBUG findfont: score(FontEntry(fname='/home/runner/micromamba/envs/trajan/fonts/Ubuntu-R.ttf', index=0, name='Ubuntu', style='normal', variant='normal', weight=400, stretch='normal', size='scalable')) = 10.05
2026-07-21 14:55:57 runnervm3jd5f matplotlib.font_manager[2874] DEBUG findfont: score(FontEntry(fname='/usr/share/fonts/truetype/lato/Lato-Light.ttf', index=0, name='Lato', style='normal', variant='normal', weight=300, stretch='normal', size='scalable')) = 10.145
2026-07-21 14:55:57 runnervm3jd5f matplotlib.font_manager[2874] DEBUG findfont: score(FontEntry(fname='/usr/share/fonts/truetype/lato/Lato-Light.ttf', index=0, name='Lato Light', style='normal', variant='normal', weight=400, stretch='normal', size='scalable')) = 10.05
2026-07-21 14:55:57 runnervm3jd5f matplotlib.font_manager[2874] DEBUG findfont: score(FontEntry(fname='/usr/share/fonts/truetype/liberation/LiberationSerif-BoldItalic.ttf', index=0, name='Liberation Serif', style='italic', variant='normal', weight=700, stretch='normal', size='scalable')) = 11.335
2026-07-21 14:55:57 runnervm3jd5f matplotlib.font_manager[2874] DEBUG findfont: score(FontEntry(fname='/home/runner/micromamba/envs/trajan/fonts/Ubuntu-Th.ttf', index=0, name='Ubuntu', style='normal', variant='normal', weight=250, stretch='normal', size='scalable')) = 10.1925
2026-07-21 14:55:57 runnervm3jd5f matplotlib.font_manager[2874] DEBUG findfont: score(FontEntry(fname='/home/runner/micromamba/envs/trajan/fonts/Ubuntu-Th.ttf', index=0, name='Ubuntu Thin', style='normal', variant='normal', weight=400, stretch='normal', size='scalable')) = 10.05
2026-07-21 14:55:57 runnervm3jd5f matplotlib.font_manager[2874] DEBUG findfont: score(FontEntry(fname='/home/runner/micromamba/envs/trajan/fonts/SourceCodePro-ExtraLight.ttf', index=0, name='Source Code Pro', style='normal', variant='normal', weight=200, stretch='normal', size='scalable')) = 10.24
2026-07-21 14:55:57 runnervm3jd5f matplotlib.font_manager[2874] DEBUG findfont: score(FontEntry(fname='/home/runner/micromamba/envs/trajan/fonts/SourceCodePro-ExtraLight.ttf', index=0, name='Source Code Pro ExtraLight', style='normal', variant='normal', weight=400, stretch='normal', size='scalable')) = 10.05
2026-07-21 14:55:57 runnervm3jd5f matplotlib.font_manager[2874] DEBUG findfont: score(FontEntry(fname='/usr/share/fonts/truetype/lato/Lato-Thin.ttf', index=0, name='Lato', style='normal', variant='normal', weight=275, stretch='normal', size='scalable')) = 10.16875
2026-07-21 14:55:57 runnervm3jd5f matplotlib.font_manager[2874] DEBUG findfont: score(FontEntry(fname='/usr/share/fonts/truetype/lato/Lato-Thin.ttf', index=0, name='Lato Thin', style='normal', variant='normal', weight=400, stretch='normal', size='scalable')) = 10.05
2026-07-21 14:55:57 runnervm3jd5f matplotlib.font_manager[2874] DEBUG findfont: score(FontEntry(fname='/usr/share/fonts/truetype/liberation/LiberationSerif-Bold.ttf', index=0, name='Liberation Serif', style='normal', variant='normal', weight=700, stretch='normal', size='scalable')) = 10.335
2026-07-21 14:55:57 runnervm3jd5f matplotlib.font_manager[2874] DEBUG findfont: score(FontEntry(fname='/home/runner/micromamba/envs/trajan/fonts/Inconsolata-Regular.ttf', index=0, name='Inconsolata', style='normal', variant='normal', weight=400, stretch='normal', size='scalable')) = 10.05
2026-07-21 14:55:57 runnervm3jd5f matplotlib.font_manager[2874] DEBUG findfont: score(FontEntry(fname='/home/runner/micromamba/envs/trajan/fonts/Ubuntu-C.ttf', index=0, name='Ubuntu Condensed', style='normal', variant='normal', weight=400, stretch='condensed', size='scalable')) = 10.25
2026-07-21 14:55:57 runnervm3jd5f matplotlib.font_manager[2874] DEBUG findfont: score(FontEntry(fname='/usr/share/fonts/truetype/dejavu/DejaVuSansCondensed-Bold.ttf', index=0, name='DejaVu Sans', style='normal', variant='normal', weight=700, stretch='condensed', size='scalable')) = 10.535
2026-07-21 14:55:57 runnervm3jd5f matplotlib.font_manager[2874] DEBUG findfont: score(FontEntry(fname='/usr/share/fonts/truetype/dejavu/DejaVuSansCondensed-Bold.ttf', index=0, name='DejaVu Sans Condensed', style='normal', variant='normal', weight=700, stretch='condensed', size='scalable')) = 10.535
2026-07-21 14:55:57 runnervm3jd5f matplotlib.font_manager[2874] DEBUG findfont: score(FontEntry(fname='/usr/share/fonts/truetype/liberation/LiberationMono-Bold.ttf', index=0, name='Liberation Mono', style='normal', variant='normal', weight=700, stretch='normal', size='scalable')) = 10.335
2026-07-21 14:55:57 runnervm3jd5f matplotlib.font_manager[2874] DEBUG findfont: score(FontEntry(fname='/home/runner/micromamba/envs/trajan/fonts/SourceCodePro-Black.ttf', index=0, name='Source Code Pro', style='normal', variant='normal', weight=900, stretch='normal', size='scalable')) = 10.525
2026-07-21 14:55:57 runnervm3jd5f matplotlib.font_manager[2874] DEBUG findfont: score(FontEntry(fname='/home/runner/micromamba/envs/trajan/fonts/SourceCodePro-Black.ttf', index=0, name='Source Code Pro Black', style='normal', variant='normal', weight=400, stretch='normal', size='scalable')) = 10.05
2026-07-21 14:55:57 runnervm3jd5f matplotlib.font_manager[2874] DEBUG findfont: score(FontEntry(fname='/home/runner/micromamba/envs/trajan/fonts/SourceCodePro-BlackIt.ttf', index=0, name='Source Code Pro', style='italic', variant='normal', weight=900, stretch='normal', size='scalable')) = 11.525
2026-07-21 14:55:57 runnervm3jd5f matplotlib.font_manager[2874] DEBUG findfont: score(FontEntry(fname='/home/runner/micromamba/envs/trajan/fonts/SourceCodePro-BlackIt.ttf', index=0, name='Source Code Pro Black', style='italic', variant='normal', weight=400, stretch='normal', size='scalable')) = 11.05
2026-07-21 14:55:57 runnervm3jd5f matplotlib.font_manager[2874] DEBUG findfont: score(FontEntry(fname='/home/runner/micromamba/envs/trajan/fonts/Ubuntu-LI.ttf', index=0, name='Ubuntu', style='italic', variant='normal', weight=300, stretch='normal', size='scalable')) = 11.145
2026-07-21 14:55:57 runnervm3jd5f matplotlib.font_manager[2874] DEBUG findfont: score(FontEntry(fname='/home/runner/micromamba/envs/trajan/fonts/Ubuntu-LI.ttf', index=0, name='Ubuntu Light', style='italic', variant='normal', weight=400, stretch='normal', size='scalable')) = 11.05
2026-07-21 14:55:57 runnervm3jd5f matplotlib.font_manager[2874] DEBUG findfont: score(FontEntry(fname='/usr/share/fonts/truetype/liberation/LiberationMono-Regular.ttf', index=0, name='Liberation Mono', style='normal', variant='normal', weight=400, stretch='normal', size='scalable')) = 10.05
2026-07-21 14:55:57 runnervm3jd5f matplotlib.font_manager[2874] DEBUG findfont: score(FontEntry(fname='/home/runner/micromamba/envs/trajan/fonts/UbuntuMono-RI.ttf', index=0, name='Ubuntu Mono', style='italic', variant='normal', weight=400, stretch='normal', size='scalable')) = 11.05
2026-07-21 14:55:57 runnervm3jd5f matplotlib.font_manager[2874] DEBUG findfont: score(FontEntry(fname='/usr/share/fonts/truetype/lato/Lato-Heavy.ttf', index=0, name='Lato', style='normal', variant='normal', weight=800, stretch='normal', size='scalable')) = 10.43
2026-07-21 14:55:57 runnervm3jd5f matplotlib.font_manager[2874] DEBUG findfont: score(FontEntry(fname='/usr/share/fonts/truetype/lato/Lato-Heavy.ttf', index=0, name='Lato Heavy', style='normal', variant='normal', weight=400, stretch='normal', size='scalable')) = 10.05
2026-07-21 14:55:57 runnervm3jd5f matplotlib.font_manager[2874] DEBUG findfont: score(FontEntry(fname='/usr/share/fonts/truetype/lato/Lato-HairlineItalic.ttf', index=0, name='Lato', style='italic', variant='normal', weight=250, stretch='normal', size='scalable')) = 11.1925
2026-07-21 14:55:57 runnervm3jd5f matplotlib.font_manager[2874] DEBUG findfont: score(FontEntry(fname='/usr/share/fonts/truetype/lato/Lato-HairlineItalic.ttf', index=0, name='Lato Hairline', style='italic', variant='normal', weight=400, stretch='normal', size='scalable')) = 11.05
2026-07-21 14:55:57 runnervm3jd5f matplotlib.font_manager[2874] DEBUG findfont: score(FontEntry(fname='/usr/share/fonts/truetype/dejavu/DejaVuSerifCondensed-Bold.ttf', index=0, name='DejaVu Serif', style='normal', variant='normal', weight=700, stretch='condensed', size='scalable')) = 10.535
2026-07-21 14:55:57 runnervm3jd5f matplotlib.font_manager[2874] DEBUG findfont: score(FontEntry(fname='/usr/share/fonts/truetype/dejavu/DejaVuSerifCondensed-Bold.ttf', index=0, name='DejaVu Serif Condensed', style='normal', variant='normal', weight=700, stretch='condensed', size='scalable')) = 10.535
2026-07-21 14:55:57 runnervm3jd5f matplotlib.font_manager[2874] DEBUG findfont: score(FontEntry(fname='/usr/share/fonts/truetype/dejavu/DejaVuSansCondensed-Oblique.ttf', index=0, name='DejaVu Sans', style='oblique', variant='normal', weight=400, stretch='condensed', size='scalable')) = 11.25
2026-07-21 14:55:57 runnervm3jd5f matplotlib.font_manager[2874] DEBUG findfont: score(FontEntry(fname='/usr/share/fonts/truetype/dejavu/DejaVuSansCondensed-Oblique.ttf', index=0, name='DejaVu Sans Condensed', style='oblique', variant='normal', weight=400, stretch='condensed', size='scalable')) = 11.25
2026-07-21 14:55:57 runnervm3jd5f matplotlib.font_manager[2874] DEBUG findfont: score(FontEntry(fname='/usr/share/fonts/truetype/lato/Lato-SemiboldItalic.ttf', index=0, name='Lato', style='italic', variant='normal', weight=600, stretch='normal', size='scalable')) = 11.24
2026-07-21 14:55:57 runnervm3jd5f matplotlib.font_manager[2874] DEBUG findfont: score(FontEntry(fname='/usr/share/fonts/truetype/lato/Lato-SemiboldItalic.ttf', index=0, name='Lato Semibold', style='italic', variant='normal', weight=400, stretch='normal', size='scalable')) = 11.05
2026-07-21 14:55:57 runnervm3jd5f matplotlib.font_manager[2874] DEBUG findfont: score(FontEntry(fname='/usr/share/fonts/truetype/lato/Lato-Semibold.ttf', index=0, name='Lato', style='normal', variant='normal', weight=600, stretch='normal', size='scalable')) = 10.24
2026-07-21 14:55:57 runnervm3jd5f matplotlib.font_manager[2874] DEBUG findfont: score(FontEntry(fname='/usr/share/fonts/truetype/lato/Lato-Semibold.ttf', index=0, name='Lato Semibold', style='normal', variant='normal', weight=400, stretch='normal', size='scalable')) = 10.05
2026-07-21 14:55:57 runnervm3jd5f matplotlib.font_manager[2874] DEBUG findfont: score(FontEntry(fname='/home/runner/micromamba/envs/trajan/fonts/Inconsolata-Bold.ttf', index=0, name='Inconsolata', style='normal', variant='normal', weight=700, stretch='normal', size='scalable')) = 10.335
2026-07-21 14:55:57 runnervm3jd5f matplotlib.font_manager[2874] DEBUG findfont: score(FontEntry(fname='/usr/share/fonts/truetype/dejavu/DejaVuSans-ExtraLight.ttf', index=0, name='DejaVu Sans', style='normal', variant='normal', weight=200, stretch='normal', size='scalable')) = 10.24
2026-07-21 14:55:57 runnervm3jd5f matplotlib.font_manager[2874] DEBUG findfont: score(FontEntry(fname='/usr/share/fonts/truetype/dejavu/DejaVuSans-ExtraLight.ttf', index=0, name='DejaVu Sans Light', style='normal', variant='normal', weight=200, stretch='normal', size='scalable')) = 10.24
2026-07-21 14:55:57 runnervm3jd5f matplotlib.font_manager[2874] DEBUG findfont: score(FontEntry(fname='/home/runner/micromamba/envs/trajan/fonts/Ubuntu-BI.ttf', index=0, name='Ubuntu', style='italic', variant='normal', weight=700, stretch='normal', size='scalable')) = 11.335
2026-07-21 14:55:57 runnervm3jd5f matplotlib.font_manager[2874] DEBUG findfont: score(FontEntry(fname='/usr/share/fonts/truetype/dejavu/DejaVuSans-BoldOblique.ttf', index=0, name='DejaVu Sans', style='oblique', variant='normal', weight=700, stretch='normal', size='scalable')) = 11.335
2026-07-21 14:55:57 runnervm3jd5f matplotlib.font_manager[2874] DEBUG findfont: score(FontEntry(fname='/home/runner/micromamba/envs/trajan/fonts/Ubuntu-RI.ttf', index=0, name='Ubuntu', style='italic', variant='normal', weight=400, stretch='normal', size='scalable')) = 11.05
2026-07-21 14:55:57 runnervm3jd5f matplotlib.font_manager[2874] DEBUG findfont: score(FontEntry(fname='/usr/share/fonts/truetype/dejavu/DejaVuSerif-Italic.ttf', index=0, name='DejaVu Serif', style='italic', variant='normal', weight=400, stretch='normal', size='scalable')) = 11.05
2026-07-21 14:55:57 runnervm3jd5f matplotlib.font_manager[2874] DEBUG findfont: score(FontEntry(fname='/home/runner/micromamba/envs/trajan/fonts/SourceCodePro-Medium.ttf', index=0, name='Source Code Pro', style='normal', variant='normal', weight=500, stretch='normal', size='scalable')) = 10.145
2026-07-21 14:55:57 runnervm3jd5f matplotlib.font_manager[2874] DEBUG findfont: score(FontEntry(fname='/home/runner/micromamba/envs/trajan/fonts/SourceCodePro-Medium.ttf', index=0, name='Source Code Pro Medium', style='normal', variant='normal', weight=400, stretch='normal', size='scalable')) = 10.05
2026-07-21 14:55:57 runnervm3jd5f matplotlib.font_manager[2874] DEBUG findfont: score(FontEntry(fname='/usr/share/fonts/truetype/lato/Lato-HeavyItalic.ttf', index=0, name='Lato', style='italic', variant='normal', weight=800, stretch='normal', size='scalable')) = 11.43
2026-07-21 14:55:57 runnervm3jd5f matplotlib.font_manager[2874] DEBUG findfont: score(FontEntry(fname='/usr/share/fonts/truetype/lato/Lato-HeavyItalic.ttf', index=0, name='Lato Heavy', style='italic', variant='normal', weight=400, stretch='normal', size='scalable')) = 11.05
2026-07-21 14:55:57 runnervm3jd5f matplotlib.font_manager[2874] DEBUG findfont: score(FontEntry(fname='/usr/share/fonts/truetype/dejavu/DejaVuSans-Oblique.ttf', index=0, name='DejaVu Sans', style='oblique', variant='normal', weight=400, stretch='normal', size='scalable')) = 11.05
2026-07-21 14:55:57 runnervm3jd5f matplotlib.font_manager[2874] DEBUG findfont: score(FontEntry(fname='/home/runner/micromamba/envs/trajan/fonts/Ubuntu-M.ttf', index=0, name='Ubuntu', style='normal', variant='normal', weight=500, stretch='normal', size='scalable')) = 10.145
2026-07-21 14:55:57 runnervm3jd5f matplotlib.font_manager[2874] DEBUG findfont: score(FontEntry(fname='/home/runner/micromamba/envs/trajan/fonts/Ubuntu-M.ttf', index=0, name='Ubuntu Light', style='normal', variant='normal', weight=700, stretch='normal', size='scalable')) = 10.335
2026-07-21 14:55:57 runnervm3jd5f matplotlib.font_manager[2874] DEBUG findfont: score(FontEntry(fname='/usr/share/fonts/truetype/liberation/LiberationMono-BoldItalic.ttf', index=0, name='Liberation Mono', style='italic', variant='normal', weight=700, stretch='normal', size='scalable')) = 11.335
2026-07-21 14:55:57 runnervm3jd5f matplotlib.font_manager[2874] DEBUG findfont: score(FontEntry(fname='/usr/share/fonts/truetype/dejavu/DejaVuSansMono.ttf', index=0, name='DejaVu Sans Mono', style='normal', variant='normal', weight=400, stretch='normal', size='scalable')) = 10.05
2026-07-21 14:55:57 runnervm3jd5f matplotlib.font_manager[2874] DEBUG findfont: score(FontEntry(fname='/usr/share/fonts/truetype/dejavu/DejaVuMathTeXGyre.ttf', index=0, name='DejaVu Math TeX Gyre', style='normal', variant='normal', weight=400, stretch='normal', size='scalable')) = 10.05
2026-07-21 14:55:57 runnervm3jd5f matplotlib.font_manager[2874] DEBUG findfont: score(FontEntry(fname='/usr/share/fonts/truetype/dejavu/DejaVuSansMono-Oblique.ttf', index=0, name='DejaVu Sans Mono', style='oblique', variant='normal', weight=400, stretch='normal', size='scalable')) = 11.05
2026-07-21 14:55:57 runnervm3jd5f matplotlib.font_manager[2874] DEBUG findfont: score(FontEntry(fname='/home/runner/micromamba/envs/trajan/fonts/Ubuntu-L.ttf', index=0, name='Ubuntu', style='normal', variant='normal', weight=300, stretch='normal', size='scalable')) = 10.145
2026-07-21 14:55:57 runnervm3jd5f matplotlib.font_manager[2874] DEBUG findfont: score(FontEntry(fname='/home/runner/micromamba/envs/trajan/fonts/Ubuntu-L.ttf', index=0, name='Ubuntu Light', style='normal', variant='normal', weight=400, stretch='normal', size='scalable')) = 10.05
2026-07-21 14:55:57 runnervm3jd5f matplotlib.font_manager[2874] DEBUG findfont: score(FontEntry(fname='/home/runner/micromamba/envs/trajan/fonts/SourceCodePro-MediumIt.ttf', index=0, name='Source Code Pro', style='italic', variant='normal', weight=500, stretch='normal', size='scalable')) = 11.145
2026-07-21 14:55:57 runnervm3jd5f matplotlib.font_manager[2874] DEBUG findfont: score(FontEntry(fname='/home/runner/micromamba/envs/trajan/fonts/SourceCodePro-MediumIt.ttf', index=0, name='Source Code Pro Medium', style='italic', variant='normal', weight=400, stretch='normal', size='scalable')) = 11.05
2026-07-21 14:55:57 runnervm3jd5f matplotlib.font_manager[2874] DEBUG findfont: score(FontEntry(fname='/home/runner/micromamba/envs/trajan/fonts/SourceCodePro-Regular.ttf', index=0, name='Source Code Pro', style='normal', variant='normal', weight=400, stretch='normal', size='scalable')) = 10.05
2026-07-21 14:55:57 runnervm3jd5f matplotlib.font_manager[2874] DEBUG findfont: score(FontEntry(fname='/home/runner/micromamba/envs/trajan/fonts/SourceCodePro-SemiboldIt.ttf', index=0, name='Source Code Pro', style='italic', variant='normal', weight=600, stretch='normal', size='scalable')) = 11.24
2026-07-21 14:55:57 runnervm3jd5f matplotlib.font_manager[2874] DEBUG findfont: score(FontEntry(fname='/home/runner/micromamba/envs/trajan/fonts/SourceCodePro-SemiboldIt.ttf', index=0, name='Source Code Pro Semibold', style='italic', variant='normal', weight=400, stretch='normal', size='scalable')) = 11.05
2026-07-21 14:55:57 runnervm3jd5f matplotlib.font_manager[2874] DEBUG findfont: score(FontEntry(fname='/usr/share/fonts/truetype/dejavu/DejaVuSerif.ttf', index=0, name='DejaVu Serif', style='normal', variant='normal', weight=400, stretch='normal', size='scalable')) = 10.05
2026-07-21 14:55:57 runnervm3jd5f matplotlib.font_manager[2874] DEBUG findfont: score(FontEntry(fname='/usr/share/fonts/truetype/dejavu/DejaVuSerif-Bold.ttf', index=0, name='DejaVu Serif', style='normal', variant='normal', weight=700, stretch='normal', size='scalable')) = 10.335
2026-07-21 14:55:57 runnervm3jd5f matplotlib.font_manager[2874] DEBUG findfont: score(FontEntry(fname='/usr/share/fonts/truetype/liberation/LiberationSerif-Italic.ttf', index=0, name='Liberation Serif', style='italic', variant='normal', weight=400, stretch='normal', size='scalable')) = 11.05
2026-07-21 14:55:57 runnervm3jd5f matplotlib.font_manager[2874] DEBUG findfont: score(FontEntry(fname='/usr/share/fonts/truetype/dejavu/DejaVuSansMono-BoldOblique.ttf', index=0, name='DejaVu Sans Mono', style='oblique', variant='normal', weight=700, stretch='normal', size='scalable')) = 11.335
2026-07-21 14:55:57 runnervm3jd5f matplotlib.font_manager[2874] DEBUG findfont: score(FontEntry(fname='/home/runner/micromamba/envs/trajan/fonts/SourceCodePro-Light.ttf', index=0, name='Source Code Pro', style='normal', variant='normal', weight=300, stretch='normal', size='scalable')) = 10.145
2026-07-21 14:55:57 runnervm3jd5f matplotlib.font_manager[2874] DEBUG findfont: score(FontEntry(fname='/home/runner/micromamba/envs/trajan/fonts/SourceCodePro-Light.ttf', index=0, name='Source Code Pro Light', style='normal', variant='normal', weight=400, stretch='normal', size='scalable')) = 10.05
2026-07-21 14:55:57 runnervm3jd5f matplotlib.font_manager[2874] DEBUG findfont: score(FontEntry(fname='/usr/share/fonts/truetype/liberation/LiberationMono-Italic.ttf', index=0, name='Liberation Mono', style='italic', variant='normal', weight=400, stretch='normal', size='scalable')) = 11.05
2026-07-21 14:55:57 runnervm3jd5f matplotlib.font_manager[2874] DEBUG findfont: Matching STIXSizeTwoSym:style=normal:variant=normal:weight=normal:stretch=normal:size=10.0 to STIXSizeTwoSym ('/home/runner/micromamba/envs/trajan/lib/python3.14/site-packages/matplotlib/mpl-data/fonts/ttf/STIXSizTwoSymReg.ttf') with score of 0.050000.
2026-07-21 14:55:57 runnervm3jd5f matplotlib.font_manager[2874] DEBUG findfont: Matching STIXSizeThreeSym:style=normal:variant=normal:weight=normal:stretch=normal:size=10.0.
2026-07-21 14:55:57 runnervm3jd5f matplotlib.font_manager[2874] DEBUG findfont: score(FontEntry(fname='/home/runner/micromamba/envs/trajan/lib/python3.14/site-packages/matplotlib/mpl-data/fonts/ttf/cmmi10.ttf', index=0, name='cmmi10', style='normal', variant='normal', weight=400, stretch='normal', size='scalable')) = 10.05
2026-07-21 14:55:57 runnervm3jd5f matplotlib.font_manager[2874] DEBUG findfont: score(FontEntry(fname='/home/runner/micromamba/envs/trajan/lib/python3.14/site-packages/matplotlib/mpl-data/fonts/ttf/DejaVuSerif-Bold.ttf', index=0, name='DejaVu Serif', style='normal', variant='normal', weight=700, stretch='normal', size='scalable')) = 10.335
2026-07-21 14:55:57 runnervm3jd5f matplotlib.font_manager[2874] DEBUG findfont: score(FontEntry(fname='/home/runner/micromamba/envs/trajan/lib/python3.14/site-packages/matplotlib/mpl-data/fonts/ttf/DejaVuSans-Oblique.ttf', index=0, name='DejaVu Sans', style='oblique', variant='normal', weight=400, stretch='normal', size='scalable')) = 11.05
2026-07-21 14:55:57 runnervm3jd5f matplotlib.font_manager[2874] DEBUG findfont: score(FontEntry(fname='/home/runner/micromamba/envs/trajan/lib/python3.14/site-packages/matplotlib/mpl-data/fonts/ttf/STIXSizThreeSymReg.ttf', index=0, name='STIXSizeThreeSym', style='normal', variant='normal', weight=400, stretch='normal', size='scalable')) = 0.05
2026-07-21 14:55:57 runnervm3jd5f matplotlib.font_manager[2874] DEBUG findfont: score(FontEntry(fname='/home/runner/micromamba/envs/trajan/lib/python3.14/site-packages/matplotlib/mpl-data/fonts/ttf/STIXNonUniBolIta.ttf', index=0, name='STIXNonUnicode', style='italic', variant='normal', weight=700, stretch='normal', size='scalable')) = 11.335
2026-07-21 14:55:57 runnervm3jd5f matplotlib.font_manager[2874] DEBUG findfont: score(FontEntry(fname='/home/runner/micromamba/envs/trajan/lib/python3.14/site-packages/matplotlib/mpl-data/fonts/ttf/DejaVuSerifDisplay.ttf', index=0, name='DejaVu Serif Display', style='normal', variant='normal', weight=400, stretch='normal', size='scalable')) = 10.05
2026-07-21 14:55:57 runnervm3jd5f matplotlib.font_manager[2874] DEBUG findfont: score(FontEntry(fname='/home/runner/micromamba/envs/trajan/lib/python3.14/site-packages/matplotlib/mpl-data/fonts/ttf/cmss10.ttf', index=0, name='cmss10', style='normal', variant='normal', weight=400, stretch='normal', size='scalable')) = 10.05
2026-07-21 14:55:57 runnervm3jd5f matplotlib.font_manager[2874] DEBUG findfont: score(FontEntry(fname='/home/runner/micromamba/envs/trajan/lib/python3.14/site-packages/matplotlib/mpl-data/fonts/ttf/STIXGeneralBolIta.ttf', index=0, name='STIXGeneral', style='italic', variant='normal', weight=700, stretch='normal', size='scalable')) = 11.335
2026-07-21 14:55:57 runnervm3jd5f matplotlib.font_manager[2874] DEBUG findfont: score(FontEntry(fname='/home/runner/micromamba/envs/trajan/lib/python3.14/site-packages/matplotlib/mpl-data/fonts/ttf/cmtt10.ttf', index=0, name='cmtt10', style='normal', variant='normal', weight=400, stretch='normal', size='scalable')) = 10.05
2026-07-21 14:55:57 runnervm3jd5f matplotlib.font_manager[2874] DEBUG findfont: score(FontEntry(fname='/home/runner/micromamba/envs/trajan/lib/python3.14/site-packages/matplotlib/mpl-data/fonts/ttf/cmsy10.ttf', index=0, name='cmsy10', style='normal', variant='normal', weight=400, stretch='normal', size='scalable')) = 10.05
2026-07-21 14:55:57 runnervm3jd5f matplotlib.font_manager[2874] DEBUG findfont: score(FontEntry(fname='/home/runner/micromamba/envs/trajan/lib/python3.14/site-packages/matplotlib/mpl-data/fonts/ttf/DejaVuSansMono-Oblique.ttf', index=0, name='DejaVu Sans Mono', style='oblique', variant='normal', weight=400, stretch='normal', size='scalable')) = 11.05
2026-07-21 14:55:57 runnervm3jd5f matplotlib.font_manager[2874] DEBUG findfont: score(FontEntry(fname='/home/runner/micromamba/envs/trajan/lib/python3.14/site-packages/matplotlib/mpl-data/fonts/ttf/STIXNonUniIta.ttf', index=0, name='STIXNonUnicode', style='italic', variant='normal', weight=400, stretch='normal', size='scalable')) = 11.05
2026-07-21 14:55:57 runnervm3jd5f matplotlib.font_manager[2874] DEBUG findfont: score(FontEntry(fname='/home/runner/micromamba/envs/trajan/lib/python3.14/site-packages/matplotlib/mpl-data/fonts/ttf/STIXGeneral.ttf', index=0, name='STIXGeneral', style='normal', variant='normal', weight=400, stretch='normal', size='scalable')) = 10.05
2026-07-21 14:55:57 runnervm3jd5f matplotlib.font_manager[2874] DEBUG findfont: score(FontEntry(fname='/home/runner/micromamba/envs/trajan/lib/python3.14/site-packages/matplotlib/mpl-data/fonts/ttf/cmti10.ttf', index=0, name='cmti10', style='normal', variant='normal', weight=400, stretch='normal', size='scalable')) = 10.05
2026-07-21 14:55:57 runnervm3jd5f matplotlib.font_manager[2874] DEBUG findfont: score(FontEntry(fname='/home/runner/micromamba/envs/trajan/lib/python3.14/site-packages/matplotlib/mpl-data/fonts/ttf/DejaVuSansMono-BoldOblique.ttf', index=0, name='DejaVu Sans Mono', style='oblique', variant='normal', weight=700, stretch='normal', size='scalable')) = 11.335
2026-07-21 14:55:57 runnervm3jd5f matplotlib.font_manager[2874] DEBUG findfont: score(FontEntry(fname='/home/runner/micromamba/envs/trajan/lib/python3.14/site-packages/matplotlib/mpl-data/fonts/ttf/DejaVuSerif.ttf', index=0, name='DejaVu Serif', style='normal', variant='normal', weight=400, stretch='normal', size='scalable')) = 10.05
2026-07-21 14:55:57 runnervm3jd5f matplotlib.font_manager[2874] DEBUG findfont: score(FontEntry(fname='/home/runner/micromamba/envs/trajan/lib/python3.14/site-packages/matplotlib/mpl-data/fonts/ttf/LastResortHE-Regular.ttf', index=0, name='Last Resort High-Efficiency', style='normal', variant='normal', weight=400, stretch='normal', size='scalable')) = 10.05
2026-07-21 14:55:57 runnervm3jd5f matplotlib.font_manager[2874] DEBUG findfont: score(FontEntry(fname='/home/runner/micromamba/envs/trajan/lib/python3.14/site-packages/matplotlib/mpl-data/fonts/ttf/cmex10.ttf', index=0, name='cmex10', style='normal', variant='normal', weight=400, stretch='normal', size='scalable')) = 10.05
2026-07-21 14:55:57 runnervm3jd5f matplotlib.font_manager[2874] DEBUG findfont: score(FontEntry(fname='/home/runner/micromamba/envs/trajan/lib/python3.14/site-packages/matplotlib/mpl-data/fonts/ttf/STIXSizFiveSymReg.ttf', index=0, name='STIXSizeFiveSym', style='normal', variant='normal', weight=400, stretch='normal', size='scalable')) = 10.05
2026-07-21 14:55:57 runnervm3jd5f matplotlib.font_manager[2874] DEBUG findfont: score(FontEntry(fname='/home/runner/micromamba/envs/trajan/lib/python3.14/site-packages/matplotlib/mpl-data/fonts/ttf/STIXNonUniBol.ttf', index=0, name='STIXNonUnicode', style='normal', variant='normal', weight=700, stretch='normal', size='scalable')) = 10.335
2026-07-21 14:55:57 runnervm3jd5f matplotlib.font_manager[2874] DEBUG findfont: score(FontEntry(fname='/home/runner/micromamba/envs/trajan/lib/python3.14/site-packages/matplotlib/mpl-data/fonts/ttf/DejaVuSansDisplay.ttf', index=0, name='DejaVu Sans Display', style='normal', variant='normal', weight=400, stretch='normal', size='scalable')) = 10.05
2026-07-21 14:55:57 runnervm3jd5f matplotlib.font_manager[2874] DEBUG findfont: score(FontEntry(fname='/home/runner/micromamba/envs/trajan/lib/python3.14/site-packages/matplotlib/mpl-data/fonts/ttf/DejaVuSansMono.ttf', index=0, name='DejaVu Sans Mono', style='normal', variant='normal', weight=400, stretch='normal', size='scalable')) = 10.05
2026-07-21 14:55:57 runnervm3jd5f matplotlib.font_manager[2874] DEBUG findfont: score(FontEntry(fname='/home/runner/micromamba/envs/trajan/lib/python3.14/site-packages/matplotlib/mpl-data/fonts/ttf/cmb10.ttf', index=0, name='cmb10', style='normal', variant='normal', weight=400, stretch='normal', size='scalable')) = 10.05
2026-07-21 14:55:57 runnervm3jd5f matplotlib.font_manager[2874] DEBUG findfont: score(FontEntry(fname='/home/runner/micromamba/envs/trajan/lib/python3.14/site-packages/matplotlib/mpl-data/fonts/ttf/STIXSizTwoSymReg.ttf', index=0, name='STIXSizeTwoSym', style='normal', variant='normal', weight=400, stretch='normal', size='scalable')) = 10.05
2026-07-21 14:55:57 runnervm3jd5f matplotlib.font_manager[2874] DEBUG findfont: score(FontEntry(fname='/home/runner/micromamba/envs/trajan/lib/python3.14/site-packages/matplotlib/mpl-data/fonts/ttf/DejaVuSans.ttf', index=0, name='DejaVu Sans', style='normal', variant='normal', weight=400, stretch='normal', size='scalable')) = 10.05
2026-07-21 14:55:57 runnervm3jd5f matplotlib.font_manager[2874] DEBUG findfont: score(FontEntry(fname='/home/runner/micromamba/envs/trajan/lib/python3.14/site-packages/matplotlib/mpl-data/fonts/ttf/STIXNonUni.ttf', index=0, name='STIXNonUnicode', style='normal', variant='normal', weight=400, stretch='normal', size='scalable')) = 10.05
2026-07-21 14:55:57 runnervm3jd5f matplotlib.font_manager[2874] DEBUG findfont: score(FontEntry(fname='/home/runner/micromamba/envs/trajan/lib/python3.14/site-packages/matplotlib/mpl-data/fonts/ttf/STIXGeneralItalic.ttf', index=0, name='STIXGeneral', style='italic', variant='normal', weight=400, stretch='normal', size='scalable')) = 11.05
2026-07-21 14:55:57 runnervm3jd5f matplotlib.font_manager[2874] DEBUG findfont: score(FontEntry(fname='/home/runner/micromamba/envs/trajan/lib/python3.14/site-packages/matplotlib/mpl-data/fonts/ttf/STIXSizOneSymBol.ttf', index=0, name='STIXSizeOneSym', style='normal', variant='normal', weight=700, stretch='normal', size='scalable')) = 10.335
2026-07-21 14:55:57 runnervm3jd5f matplotlib.font_manager[2874] DEBUG findfont: score(FontEntry(fname='/home/runner/micromamba/envs/trajan/lib/python3.14/site-packages/matplotlib/mpl-data/fonts/ttf/DejaVuSansMono-Bold.ttf', index=0, name='DejaVu Sans Mono', style='normal', variant='normal', weight=700, stretch='normal', size='scalable')) = 10.335
2026-07-21 14:55:57 runnervm3jd5f matplotlib.font_manager[2874] DEBUG findfont: score(FontEntry(fname='/home/runner/micromamba/envs/trajan/lib/python3.14/site-packages/matplotlib/mpl-data/fonts/ttf/STIXSizTwoSymBol.ttf', index=0, name='STIXSizeTwoSym', style='normal', variant='normal', weight=700, stretch='normal', size='scalable')) = 10.335
2026-07-21 14:55:57 runnervm3jd5f matplotlib.font_manager[2874] DEBUG findfont: score(FontEntry(fname='/home/runner/micromamba/envs/trajan/lib/python3.14/site-packages/matplotlib/mpl-data/fonts/ttf/STIXSizThreeSymBol.ttf', index=0, name='STIXSizeThreeSym', style='normal', variant='normal', weight=700, stretch='normal', size='scalable')) = 0.33499999999999996
2026-07-21 14:55:57 runnervm3jd5f matplotlib.font_manager[2874] DEBUG findfont: score(FontEntry(fname='/home/runner/micromamba/envs/trajan/lib/python3.14/site-packages/matplotlib/mpl-data/fonts/ttf/DejaVuSerif-BoldItalic.ttf', index=0, name='DejaVu Serif', style='italic', variant='normal', weight=700, stretch='normal', size='scalable')) = 11.335
2026-07-21 14:55:57 runnervm3jd5f matplotlib.font_manager[2874] DEBUG findfont: score(FontEntry(fname='/home/runner/micromamba/envs/trajan/lib/python3.14/site-packages/matplotlib/mpl-data/fonts/ttf/DejaVuSerif-Italic.ttf', index=0, name='DejaVu Serif', style='italic', variant='normal', weight=400, stretch='normal', size='scalable')) = 11.05
2026-07-21 14:55:57 runnervm3jd5f matplotlib.font_manager[2874] DEBUG findfont: score(FontEntry(fname='/home/runner/micromamba/envs/trajan/lib/python3.14/site-packages/matplotlib/mpl-data/fonts/ttf/DejaVuSans-Bold.ttf', index=0, name='DejaVu Sans', style='normal', variant='normal', weight=700, stretch='normal', size='scalable')) = 10.335
2026-07-21 14:55:57 runnervm3jd5f matplotlib.font_manager[2874] DEBUG findfont: score(FontEntry(fname='/home/runner/micromamba/envs/trajan/lib/python3.14/site-packages/matplotlib/mpl-data/fonts/ttf/STIXSizFourSymBol.ttf', index=0, name='STIXSizeFourSym', style='normal', variant='normal', weight=700, stretch='normal', size='scalable')) = 10.335
2026-07-21 14:55:57 runnervm3jd5f matplotlib.font_manager[2874] DEBUG findfont: score(FontEntry(fname='/home/runner/micromamba/envs/trajan/lib/python3.14/site-packages/matplotlib/mpl-data/fonts/ttf/STIXSizOneSymReg.ttf', index=0, name='STIXSizeOneSym', style='normal', variant='normal', weight=400, stretch='normal', size='scalable')) = 10.05
2026-07-21 14:55:57 runnervm3jd5f matplotlib.font_manager[2874] DEBUG findfont: score(FontEntry(fname='/home/runner/micromamba/envs/trajan/lib/python3.14/site-packages/matplotlib/mpl-data/fonts/ttf/cmr10.ttf', index=0, name='cmr10', style='normal', variant='normal', weight=400, stretch='normal', size='scalable')) = 10.05
2026-07-21 14:55:57 runnervm3jd5f matplotlib.font_manager[2874] DEBUG findfont: score(FontEntry(fname='/home/runner/micromamba/envs/trajan/lib/python3.14/site-packages/matplotlib/mpl-data/fonts/ttf/STIXGeneralBol.ttf', index=0, name='STIXGeneral', style='normal', variant='normal', weight=700, stretch='normal', size='scalable')) = 10.335
2026-07-21 14:55:57 runnervm3jd5f matplotlib.font_manager[2874] DEBUG findfont: score(FontEntry(fname='/home/runner/micromamba/envs/trajan/lib/python3.14/site-packages/matplotlib/mpl-data/fonts/ttf/DejaVuSans-BoldOblique.ttf', index=0, name='DejaVu Sans', style='oblique', variant='normal', weight=700, stretch='normal', size='scalable')) = 11.335
2026-07-21 14:55:57 runnervm3jd5f matplotlib.font_manager[2874] DEBUG findfont: score(FontEntry(fname='/home/runner/micromamba/envs/trajan/lib/python3.14/site-packages/matplotlib/mpl-data/fonts/ttf/STIXSizFourSymReg.ttf', index=0, name='STIXSizeFourSym', style='normal', variant='normal', weight=400, stretch='normal', size='scalable')) = 10.05
2026-07-21 14:55:57 runnervm3jd5f matplotlib.font_manager[2874] DEBUG findfont: score(FontEntry(fname='/usr/share/fonts/truetype/lato/Lato-Black.ttf', index=0, name='Lato', style='normal', variant='normal', weight=900, stretch='normal', size='scalable')) = 10.525
2026-07-21 14:55:57 runnervm3jd5f matplotlib.font_manager[2874] DEBUG findfont: score(FontEntry(fname='/usr/share/fonts/truetype/lato/Lato-Black.ttf', index=0, name='Lato Black', style='normal', variant='normal', weight=400, stretch='normal', size='scalable')) = 10.05
2026-07-21 14:55:57 runnervm3jd5f matplotlib.font_manager[2874] DEBUG findfont: score(FontEntry(fname='/usr/share/fonts/truetype/liberation/LiberationSerif-Regular.ttf', index=0, name='Liberation Serif', style='normal', variant='normal', weight=400, stretch='normal', size='scalable')) = 10.05
2026-07-21 14:55:57 runnervm3jd5f matplotlib.font_manager[2874] DEBUG findfont: score(FontEntry(fname='/usr/share/fonts/truetype/dejavu/DejaVuSerifCondensed.ttf', index=0, name='DejaVu Serif', style='normal', variant='normal', weight=400, stretch='condensed', size='scalable')) = 10.25
2026-07-21 14:55:57 runnervm3jd5f matplotlib.font_manager[2874] DEBUG findfont: score(FontEntry(fname='/usr/share/fonts/truetype/dejavu/DejaVuSerifCondensed.ttf', index=0, name='DejaVu Serif Condensed', style='normal', variant='normal', weight=380, stretch='condensed', size='scalable')) = 10.269
2026-07-21 14:55:57 runnervm3jd5f matplotlib.font_manager[2874] DEBUG findfont: score(FontEntry(fname='/home/runner/micromamba/envs/trajan/fonts/UbuntuMono-BI.ttf', index=0, name='Ubuntu Mono', style='italic', variant='normal', weight=700, stretch='normal', size='scalable')) = 11.335
2026-07-21 14:55:57 runnervm3jd5f matplotlib.font_manager[2874] DEBUG findfont: score(FontEntry(fname='/usr/share/fonts/truetype/dejavu/DejaVuSans.ttf', index=0, name='DejaVu Sans', style='normal', variant='normal', weight=400, stretch='normal', size='scalable')) = 10.05
2026-07-21 14:55:57 runnervm3jd5f matplotlib.font_manager[2874] DEBUG findfont: score(FontEntry(fname='/usr/share/fonts/truetype/lato/Lato-Italic.ttf', index=0, name='Lato', style='italic', variant='normal', weight=400, stretch='normal', size='scalable')) = 11.05
2026-07-21 14:55:57 runnervm3jd5f matplotlib.font_manager[2874] DEBUG findfont: score(FontEntry(fname='/usr/share/fonts/truetype/liberation/LiberationSans-Italic.ttf', index=0, name='Liberation Sans', style='italic', variant='normal', weight=400, stretch='normal', size='scalable')) = 11.05
2026-07-21 14:55:57 runnervm3jd5f matplotlib.font_manager[2874] DEBUG findfont: score(FontEntry(fname='/home/runner/micromamba/envs/trajan/fonts/Ubuntu-B.ttf', index=0, name='Ubuntu', style='normal', variant='normal', weight=700, stretch='normal', size='scalable')) = 10.335
2026-07-21 14:55:57 runnervm3jd5f matplotlib.font_manager[2874] DEBUG findfont: score(FontEntry(fname='/home/runner/micromamba/envs/trajan/fonts/SourceCodePro-Semibold.ttf', index=0, name='Source Code Pro', style='normal', variant='normal', weight=600, stretch='normal', size='scalable')) = 10.24
2026-07-21 14:55:57 runnervm3jd5f matplotlib.font_manager[2874] DEBUG findfont: score(FontEntry(fname='/home/runner/micromamba/envs/trajan/fonts/SourceCodePro-Semibold.ttf', index=0, name='Source Code Pro Semibold', style='normal', variant='normal', weight=400, stretch='normal', size='scalable')) = 10.05
2026-07-21 14:55:57 runnervm3jd5f matplotlib.font_manager[2874] DEBUG findfont: score(FontEntry(fname='/home/runner/micromamba/envs/trajan/fonts/SourceCodePro-Bold.ttf', index=0, name='Source Code Pro', style='normal', variant='normal', weight=700, stretch='normal', size='scalable')) = 10.335
2026-07-21 14:55:57 runnervm3jd5f matplotlib.font_manager[2874] DEBUG findfont: score(FontEntry(fname='/home/runner/micromamba/envs/trajan/fonts/Ubuntu-MI.ttf', index=0, name='Ubuntu', style='italic', variant='normal', weight=500, stretch='normal', size='scalable')) = 11.145
2026-07-21 14:55:57 runnervm3jd5f matplotlib.font_manager[2874] DEBUG findfont: score(FontEntry(fname='/home/runner/micromamba/envs/trajan/fonts/Ubuntu-MI.ttf', index=0, name='Ubuntu Light', style='italic', variant='normal', weight=700, stretch='normal', size='scalable')) = 11.335
2026-07-21 14:55:57 runnervm3jd5f matplotlib.font_manager[2874] DEBUG findfont: score(FontEntry(fname='/usr/share/fonts/truetype/lato/Lato-Regular.ttf', index=0, name='Lato', style='normal', variant='normal', weight=400, stretch='normal', size='scalable')) = 10.05
2026-07-21 14:55:57 runnervm3jd5f matplotlib.font_manager[2874] DEBUG findfont: score(FontEntry(fname='/usr/share/fonts/truetype/lato/Lato-ThinItalic.ttf', index=0, name='Lato', style='italic', variant='normal', weight=275, stretch='normal', size='scalable')) = 11.16875
2026-07-21 14:55:57 runnervm3jd5f matplotlib.font_manager[2874] DEBUG findfont: score(FontEntry(fname='/usr/share/fonts/truetype/lato/Lato-ThinItalic.ttf', index=0, name='Lato Thin', style='italic', variant='normal', weight=400, stretch='normal', size='scalable')) = 11.05
2026-07-21 14:55:57 runnervm3jd5f matplotlib.font_manager[2874] DEBUG findfont: score(FontEntry(fname='/usr/share/fonts/truetype/lato/Lato-BlackItalic.ttf', index=0, name='Lato', style='italic', variant='normal', weight=900, stretch='normal', size='scalable')) = 11.525
2026-07-21 14:55:57 runnervm3jd5f matplotlib.font_manager[2874] DEBUG findfont: score(FontEntry(fname='/usr/share/fonts/truetype/lato/Lato-BlackItalic.ttf', index=0, name='Lato Black', style='italic', variant='normal', weight=400, stretch='normal', size='scalable')) = 11.05
2026-07-21 14:55:57 runnervm3jd5f matplotlib.font_manager[2874] DEBUG findfont: score(FontEntry(fname='/usr/share/fonts/truetype/dejavu/DejaVuSerifCondensed-Italic.ttf', index=0, name='DejaVu Serif', style='italic', variant='normal', weight=400, stretch='condensed', size='scalable')) = 11.25
2026-07-21 14:55:57 runnervm3jd5f matplotlib.font_manager[2874] DEBUG findfont: score(FontEntry(fname='/usr/share/fonts/truetype/dejavu/DejaVuSerifCondensed-Italic.ttf', index=0, name='DejaVu Serif Condensed', style='italic', variant='normal', weight=400, stretch='condensed', size='scalable')) = 11.25
2026-07-21 14:55:57 runnervm3jd5f matplotlib.font_manager[2874] DEBUG findfont: score(FontEntry(fname='/usr/share/fonts/truetype/dejavu/DejaVuSans-Bold.ttf', index=0, name='DejaVu Sans', style='normal', variant='normal', weight=700, stretch='normal', size='scalable')) = 10.335
2026-07-21 14:55:57 runnervm3jd5f matplotlib.font_manager[2874] DEBUG findfont: score(FontEntry(fname='/home/runner/micromamba/envs/trajan/fonts/UbuntuMono-R.ttf', index=0, name='Ubuntu Mono', style='normal', variant='normal', weight=400, stretch='normal', size='scalable')) = 10.05
2026-07-21 14:55:57 runnervm3jd5f matplotlib.font_manager[2874] DEBUG findfont: score(FontEntry(fname='/usr/share/fonts/truetype/dejavu/DejaVuSerif-BoldItalic.ttf', index=0, name='DejaVu Serif', style='italic', variant='normal', weight=700, stretch='normal', size='scalable')) = 11.335
2026-07-21 14:55:57 runnervm3jd5f matplotlib.font_manager[2874] DEBUG findfont: score(FontEntry(fname='/usr/share/fonts/truetype/lato/Lato-Hairline.ttf', index=0, name='Lato', style='normal', variant='normal', weight=250, stretch='normal', size='scalable')) = 10.1925
2026-07-21 14:55:57 runnervm3jd5f matplotlib.font_manager[2874] DEBUG findfont: score(FontEntry(fname='/usr/share/fonts/truetype/lato/Lato-Hairline.ttf', index=0, name='Lato Hairline', style='normal', variant='normal', weight=400, stretch='normal', size='scalable')) = 10.05
2026-07-21 14:55:57 runnervm3jd5f matplotlib.font_manager[2874] DEBUG findfont: score(FontEntry(fname='/usr/share/fonts/truetype/lato/Lato-LightItalic.ttf', index=0, name='Lato', style='italic', variant='normal', weight=300, stretch='normal', size='scalable')) = 11.145
2026-07-21 14:55:57 runnervm3jd5f matplotlib.font_manager[2874] DEBUG findfont: score(FontEntry(fname='/usr/share/fonts/truetype/lato/Lato-LightItalic.ttf', index=0, name='Lato Light', style='italic', variant='normal', weight=400, stretch='normal', size='scalable')) = 11.05
2026-07-21 14:55:57 runnervm3jd5f matplotlib.font_manager[2874] DEBUG findfont: score(FontEntry(fname='/usr/share/fonts/truetype/dejavu/DejaVuSansCondensed-BoldOblique.ttf', index=0, name='DejaVu Sans', style='oblique', variant='normal', weight=700, stretch='condensed', size='scalable')) = 11.535
2026-07-21 14:55:57 runnervm3jd5f matplotlib.font_manager[2874] DEBUG findfont: score(FontEntry(fname='/usr/share/fonts/truetype/dejavu/DejaVuSansCondensed-BoldOblique.ttf', index=0, name='DejaVu Sans Condensed', style='oblique', variant='normal', weight=700, stretch='condensed', size='scalable')) = 11.535
2026-07-21 14:55:57 runnervm3jd5f matplotlib.font_manager[2874] DEBUG findfont: score(FontEntry(fname='/home/runner/micromamba/envs/trajan/fonts/SourceCodePro-It.ttf', index=0, name='Source Code Pro', style='italic', variant='normal', weight=400, stretch='normal', size='scalable')) = 11.05
2026-07-21 14:55:57 runnervm3jd5f matplotlib.font_manager[2874] DEBUG findfont: score(FontEntry(fname='/home/runner/micromamba/envs/trajan/fonts/SourceCodePro-ExtraLightIt.ttf', index=0, name='Source Code Pro', style='italic', variant='normal', weight=200, stretch='normal', size='scalable')) = 11.24
2026-07-21 14:55:57 runnervm3jd5f matplotlib.font_manager[2874] DEBUG findfont: score(FontEntry(fname='/home/runner/micromamba/envs/trajan/fonts/SourceCodePro-ExtraLightIt.ttf', index=0, name='Source Code Pro ExtraLight', style='italic', variant='normal', weight=400, stretch='normal', size='scalable')) = 11.05
2026-07-21 14:55:57 runnervm3jd5f matplotlib.font_manager[2874] DEBUG findfont: score(FontEntry(fname='/usr/share/fonts/truetype/lato/Lato-Medium.ttf', index=0, name='Lato', style='normal', variant='normal', weight=500, stretch='normal', size='scalable')) = 10.145
2026-07-21 14:55:57 runnervm3jd5f matplotlib.font_manager[2874] DEBUG findfont: score(FontEntry(fname='/usr/share/fonts/truetype/lato/Lato-Medium.ttf', index=0, name='Lato Medium', style='normal', variant='normal', weight=400, stretch='normal', size='scalable')) = 10.05
2026-07-21 14:55:57 runnervm3jd5f matplotlib.font_manager[2874] DEBUG findfont: score(FontEntry(fname='/usr/share/fonts/truetype/lato/Lato-BoldItalic.ttf', index=0, name='Lato', style='italic', variant='normal', weight=700, stretch='normal', size='scalable')) = 11.335
2026-07-21 14:55:57 runnervm3jd5f matplotlib.font_manager[2874] DEBUG findfont: score(FontEntry(fname='/home/runner/micromamba/envs/trajan/fonts/DejaVuSans.ttf', index=0, name='DejaVu Sans', style='normal', variant='normal', weight=400, stretch='normal', size='scalable')) = 10.05
2026-07-21 14:55:57 runnervm3jd5f matplotlib.font_manager[2874] DEBUG findfont: score(FontEntry(fname='/home/runner/micromamba/envs/trajan/fonts/UbuntuMono-B.ttf', index=0, name='Ubuntu Mono', style='normal', variant='normal', weight=700, stretch='normal', size='scalable')) = 10.335
2026-07-21 14:55:57 runnervm3jd5f matplotlib.font_manager[2874] DEBUG findfont: score(FontEntry(fname='/home/runner/micromamba/envs/trajan/fonts/SourceCodePro-LightIt.ttf', index=0, name='Source Code Pro', style='italic', variant='normal', weight=300, stretch='normal', size='scalable')) = 11.145
2026-07-21 14:55:57 runnervm3jd5f matplotlib.font_manager[2874] DEBUG findfont: score(FontEntry(fname='/home/runner/micromamba/envs/trajan/fonts/SourceCodePro-LightIt.ttf', index=0, name='Source Code Pro Light', style='italic', variant='normal', weight=400, stretch='normal', size='scalable')) = 11.05
2026-07-21 14:55:57 runnervm3jd5f matplotlib.font_manager[2874] DEBUG findfont: score(FontEntry(fname='/usr/share/fonts/truetype/liberation/LiberationSans-BoldItalic.ttf', index=0, name='Liberation Sans', style='italic', variant='normal', weight=700, stretch='normal', size='scalable')) = 11.335
2026-07-21 14:55:57 runnervm3jd5f matplotlib.font_manager[2874] DEBUG findfont: score(FontEntry(fname='/usr/share/fonts/truetype/liberation/LiberationSans-Regular.ttf', index=0, name='Liberation Sans', style='normal', variant='normal', weight=400, stretch='normal', size='scalable')) = 10.05
2026-07-21 14:55:57 runnervm3jd5f matplotlib.font_manager[2874] DEBUG findfont: score(FontEntry(fname='/usr/share/fonts/truetype/dejavu/DejaVuSansMono-Bold.ttf', index=0, name='DejaVu Sans Mono', style='normal', variant='normal', weight=700, stretch='normal', size='scalable')) = 10.335
2026-07-21 14:55:57 runnervm3jd5f matplotlib.font_manager[2874] DEBUG findfont: score(FontEntry(fname='/home/runner/micromamba/envs/trajan/fonts/SourceCodePro-BoldIt.ttf', index=0, name='Source Code Pro', style='italic', variant='normal', weight=700, stretch='normal', size='scalable')) = 11.335
2026-07-21 14:55:57 runnervm3jd5f matplotlib.font_manager[2874] DEBUG findfont: score(FontEntry(fname='/usr/share/fonts/truetype/lato/Lato-Bold.ttf', index=0, name='Lato', style='normal', variant='normal', weight=700, stretch='normal', size='scalable')) = 10.335
2026-07-21 14:55:57 runnervm3jd5f matplotlib.font_manager[2874] DEBUG findfont: score(FontEntry(fname='/usr/share/fonts/truetype/dejavu/DejaVuSansCondensed.ttf', index=0, name='DejaVu Sans', style='normal', variant='normal', weight=400, stretch='condensed', size='scalable')) = 10.25
2026-07-21 14:55:57 runnervm3jd5f matplotlib.font_manager[2874] DEBUG findfont: score(FontEntry(fname='/usr/share/fonts/truetype/dejavu/DejaVuSansCondensed.ttf', index=0, name='DejaVu Sans Condensed', style='normal', variant='normal', weight=380, stretch='condensed', size='scalable')) = 10.269
2026-07-21 14:55:57 runnervm3jd5f matplotlib.font_manager[2874] DEBUG findfont: score(FontEntry(fname='/usr/share/fonts/truetype/lato/Lato-MediumItalic.ttf', index=0, name='Lato', style='italic', variant='normal', weight=500, stretch='normal', size='scalable')) = 11.145
2026-07-21 14:55:57 runnervm3jd5f matplotlib.font_manager[2874] DEBUG findfont: score(FontEntry(fname='/usr/share/fonts/truetype/lato/Lato-MediumItalic.ttf', index=0, name='Lato Medium', style='italic', variant='normal', weight=400, stretch='normal', size='scalable')) = 11.05
2026-07-21 14:55:57 runnervm3jd5f matplotlib.font_manager[2874] DEBUG findfont: score(FontEntry(fname='/usr/share/fonts/truetype/liberation/LiberationSans-Bold.ttf', index=0, name='Liberation Sans', style='normal', variant='normal', weight=700, stretch='normal', size='scalable')) = 10.335
2026-07-21 14:55:57 runnervm3jd5f matplotlib.font_manager[2874] DEBUG findfont: score(FontEntry(fname='/usr/share/fonts/truetype/dejavu/DejaVuSerifCondensed-BoldItalic.ttf', index=0, name='DejaVu Serif', style='italic', variant='normal', weight=700, stretch='condensed', size='scalable')) = 11.535
2026-07-21 14:55:57 runnervm3jd5f matplotlib.font_manager[2874] DEBUG findfont: score(FontEntry(fname='/usr/share/fonts/truetype/dejavu/DejaVuSerifCondensed-BoldItalic.ttf', index=0, name='DejaVu Serif Condensed', style='italic', variant='normal', weight=700, stretch='condensed', size='scalable')) = 11.535
2026-07-21 14:55:57 runnervm3jd5f matplotlib.font_manager[2874] DEBUG findfont: score(FontEntry(fname='/home/runner/micromamba/envs/trajan/fonts/Ubuntu-R.ttf', index=0, name='Ubuntu', style='normal', variant='normal', weight=400, stretch='normal', size='scalable')) = 10.05
2026-07-21 14:55:57 runnervm3jd5f matplotlib.font_manager[2874] DEBUG findfont: score(FontEntry(fname='/usr/share/fonts/truetype/lato/Lato-Light.ttf', index=0, name='Lato', style='normal', variant='normal', weight=300, stretch='normal', size='scalable')) = 10.145
2026-07-21 14:55:57 runnervm3jd5f matplotlib.font_manager[2874] DEBUG findfont: score(FontEntry(fname='/usr/share/fonts/truetype/lato/Lato-Light.ttf', index=0, name='Lato Light', style='normal', variant='normal', weight=400, stretch='normal', size='scalable')) = 10.05
2026-07-21 14:55:57 runnervm3jd5f matplotlib.font_manager[2874] DEBUG findfont: score(FontEntry(fname='/usr/share/fonts/truetype/liberation/LiberationSerif-BoldItalic.ttf', index=0, name='Liberation Serif', style='italic', variant='normal', weight=700, stretch='normal', size='scalable')) = 11.335
2026-07-21 14:55:57 runnervm3jd5f matplotlib.font_manager[2874] DEBUG findfont: score(FontEntry(fname='/home/runner/micromamba/envs/trajan/fonts/Ubuntu-Th.ttf', index=0, name='Ubuntu', style='normal', variant='normal', weight=250, stretch='normal', size='scalable')) = 10.1925
2026-07-21 14:55:57 runnervm3jd5f matplotlib.font_manager[2874] DEBUG findfont: score(FontEntry(fname='/home/runner/micromamba/envs/trajan/fonts/Ubuntu-Th.ttf', index=0, name='Ubuntu Thin', style='normal', variant='normal', weight=400, stretch='normal', size='scalable')) = 10.05
2026-07-21 14:55:57 runnervm3jd5f matplotlib.font_manager[2874] DEBUG findfont: score(FontEntry(fname='/home/runner/micromamba/envs/trajan/fonts/SourceCodePro-ExtraLight.ttf', index=0, name='Source Code Pro', style='normal', variant='normal', weight=200, stretch='normal', size='scalable')) = 10.24
2026-07-21 14:55:57 runnervm3jd5f matplotlib.font_manager[2874] DEBUG findfont: score(FontEntry(fname='/home/runner/micromamba/envs/trajan/fonts/SourceCodePro-ExtraLight.ttf', index=0, name='Source Code Pro ExtraLight', style='normal', variant='normal', weight=400, stretch='normal', size='scalable')) = 10.05
2026-07-21 14:55:57 runnervm3jd5f matplotlib.font_manager[2874] DEBUG findfont: score(FontEntry(fname='/usr/share/fonts/truetype/lato/Lato-Thin.ttf', index=0, name='Lato', style='normal', variant='normal', weight=275, stretch='normal', size='scalable')) = 10.16875
2026-07-21 14:55:57 runnervm3jd5f matplotlib.font_manager[2874] DEBUG findfont: score(FontEntry(fname='/usr/share/fonts/truetype/lato/Lato-Thin.ttf', index=0, name='Lato Thin', style='normal', variant='normal', weight=400, stretch='normal', size='scalable')) = 10.05
2026-07-21 14:55:57 runnervm3jd5f matplotlib.font_manager[2874] DEBUG findfont: score(FontEntry(fname='/usr/share/fonts/truetype/liberation/LiberationSerif-Bold.ttf', index=0, name='Liberation Serif', style='normal', variant='normal', weight=700, stretch='normal', size='scalable')) = 10.335
2026-07-21 14:55:57 runnervm3jd5f matplotlib.font_manager[2874] DEBUG findfont: score(FontEntry(fname='/home/runner/micromamba/envs/trajan/fonts/Inconsolata-Regular.ttf', index=0, name='Inconsolata', style='normal', variant='normal', weight=400, stretch='normal', size='scalable')) = 10.05
2026-07-21 14:55:57 runnervm3jd5f matplotlib.font_manager[2874] DEBUG findfont: score(FontEntry(fname='/home/runner/micromamba/envs/trajan/fonts/Ubuntu-C.ttf', index=0, name='Ubuntu Condensed', style='normal', variant='normal', weight=400, stretch='condensed', size='scalable')) = 10.25
2026-07-21 14:55:57 runnervm3jd5f matplotlib.font_manager[2874] DEBUG findfont: score(FontEntry(fname='/usr/share/fonts/truetype/dejavu/DejaVuSansCondensed-Bold.ttf', index=0, name='DejaVu Sans', style='normal', variant='normal', weight=700, stretch='condensed', size='scalable')) = 10.535
2026-07-21 14:55:57 runnervm3jd5f matplotlib.font_manager[2874] DEBUG findfont: score(FontEntry(fname='/usr/share/fonts/truetype/dejavu/DejaVuSansCondensed-Bold.ttf', index=0, name='DejaVu Sans Condensed', style='normal', variant='normal', weight=700, stretch='condensed', size='scalable')) = 10.535
2026-07-21 14:55:57 runnervm3jd5f matplotlib.font_manager[2874] DEBUG findfont: score(FontEntry(fname='/usr/share/fonts/truetype/liberation/LiberationMono-Bold.ttf', index=0, name='Liberation Mono', style='normal', variant='normal', weight=700, stretch='normal', size='scalable')) = 10.335
2026-07-21 14:55:57 runnervm3jd5f matplotlib.font_manager[2874] DEBUG findfont: score(FontEntry(fname='/home/runner/micromamba/envs/trajan/fonts/SourceCodePro-Black.ttf', index=0, name='Source Code Pro', style='normal', variant='normal', weight=900, stretch='normal', size='scalable')) = 10.525
2026-07-21 14:55:57 runnervm3jd5f matplotlib.font_manager[2874] DEBUG findfont: score(FontEntry(fname='/home/runner/micromamba/envs/trajan/fonts/SourceCodePro-Black.ttf', index=0, name='Source Code Pro Black', style='normal', variant='normal', weight=400, stretch='normal', size='scalable')) = 10.05
2026-07-21 14:55:57 runnervm3jd5f matplotlib.font_manager[2874] DEBUG findfont: score(FontEntry(fname='/home/runner/micromamba/envs/trajan/fonts/SourceCodePro-BlackIt.ttf', index=0, name='Source Code Pro', style='italic', variant='normal', weight=900, stretch='normal', size='scalable')) = 11.525
2026-07-21 14:55:57 runnervm3jd5f matplotlib.font_manager[2874] DEBUG findfont: score(FontEntry(fname='/home/runner/micromamba/envs/trajan/fonts/SourceCodePro-BlackIt.ttf', index=0, name='Source Code Pro Black', style='italic', variant='normal', weight=400, stretch='normal', size='scalable')) = 11.05
2026-07-21 14:55:57 runnervm3jd5f matplotlib.font_manager[2874] DEBUG findfont: score(FontEntry(fname='/home/runner/micromamba/envs/trajan/fonts/Ubuntu-LI.ttf', index=0, name='Ubuntu', style='italic', variant='normal', weight=300, stretch='normal', size='scalable')) = 11.145
2026-07-21 14:55:57 runnervm3jd5f matplotlib.font_manager[2874] DEBUG findfont: score(FontEntry(fname='/home/runner/micromamba/envs/trajan/fonts/Ubuntu-LI.ttf', index=0, name='Ubuntu Light', style='italic', variant='normal', weight=400, stretch='normal', size='scalable')) = 11.05
2026-07-21 14:55:57 runnervm3jd5f matplotlib.font_manager[2874] DEBUG findfont: score(FontEntry(fname='/usr/share/fonts/truetype/liberation/LiberationMono-Regular.ttf', index=0, name='Liberation Mono', style='normal', variant='normal', weight=400, stretch='normal', size='scalable')) = 10.05
2026-07-21 14:55:57 runnervm3jd5f matplotlib.font_manager[2874] DEBUG findfont: score(FontEntry(fname='/home/runner/micromamba/envs/trajan/fonts/UbuntuMono-RI.ttf', index=0, name='Ubuntu Mono', style='italic', variant='normal', weight=400, stretch='normal', size='scalable')) = 11.05
2026-07-21 14:55:57 runnervm3jd5f matplotlib.font_manager[2874] DEBUG findfont: score(FontEntry(fname='/usr/share/fonts/truetype/lato/Lato-Heavy.ttf', index=0, name='Lato', style='normal', variant='normal', weight=800, stretch='normal', size='scalable')) = 10.43
2026-07-21 14:55:57 runnervm3jd5f matplotlib.font_manager[2874] DEBUG findfont: score(FontEntry(fname='/usr/share/fonts/truetype/lato/Lato-Heavy.ttf', index=0, name='Lato Heavy', style='normal', variant='normal', weight=400, stretch='normal', size='scalable')) = 10.05
2026-07-21 14:55:57 runnervm3jd5f matplotlib.font_manager[2874] DEBUG findfont: score(FontEntry(fname='/usr/share/fonts/truetype/lato/Lato-HairlineItalic.ttf', index=0, name='Lato', style='italic', variant='normal', weight=250, stretch='normal', size='scalable')) = 11.1925
2026-07-21 14:55:57 runnervm3jd5f matplotlib.font_manager[2874] DEBUG findfont: score(FontEntry(fname='/usr/share/fonts/truetype/lato/Lato-HairlineItalic.ttf', index=0, name='Lato Hairline', style='italic', variant='normal', weight=400, stretch='normal', size='scalable')) = 11.05
2026-07-21 14:55:57 runnervm3jd5f matplotlib.font_manager[2874] DEBUG findfont: score(FontEntry(fname='/usr/share/fonts/truetype/dejavu/DejaVuSerifCondensed-Bold.ttf', index=0, name='DejaVu Serif', style='normal', variant='normal', weight=700, stretch='condensed', size='scalable')) = 10.535
2026-07-21 14:55:57 runnervm3jd5f matplotlib.font_manager[2874] DEBUG findfont: score(FontEntry(fname='/usr/share/fonts/truetype/dejavu/DejaVuSerifCondensed-Bold.ttf', index=0, name='DejaVu Serif Condensed', style='normal', variant='normal', weight=700, stretch='condensed', size='scalable')) = 10.535
2026-07-21 14:55:57 runnervm3jd5f matplotlib.font_manager[2874] DEBUG findfont: score(FontEntry(fname='/usr/share/fonts/truetype/dejavu/DejaVuSansCondensed-Oblique.ttf', index=0, name='DejaVu Sans', style='oblique', variant='normal', weight=400, stretch='condensed', size='scalable')) = 11.25
2026-07-21 14:55:57 runnervm3jd5f matplotlib.font_manager[2874] DEBUG findfont: score(FontEntry(fname='/usr/share/fonts/truetype/dejavu/DejaVuSansCondensed-Oblique.ttf', index=0, name='DejaVu Sans Condensed', style='oblique', variant='normal', weight=400, stretch='condensed', size='scalable')) = 11.25
2026-07-21 14:55:57 runnervm3jd5f matplotlib.font_manager[2874] DEBUG findfont: score(FontEntry(fname='/usr/share/fonts/truetype/lato/Lato-SemiboldItalic.ttf', index=0, name='Lato', style='italic', variant='normal', weight=600, stretch='normal', size='scalable')) = 11.24
2026-07-21 14:55:57 runnervm3jd5f matplotlib.font_manager[2874] DEBUG findfont: score(FontEntry(fname='/usr/share/fonts/truetype/lato/Lato-SemiboldItalic.ttf', index=0, name='Lato Semibold', style='italic', variant='normal', weight=400, stretch='normal', size='scalable')) = 11.05
2026-07-21 14:55:57 runnervm3jd5f matplotlib.font_manager[2874] DEBUG findfont: score(FontEntry(fname='/usr/share/fonts/truetype/lato/Lato-Semibold.ttf', index=0, name='Lato', style='normal', variant='normal', weight=600, stretch='normal', size='scalable')) = 10.24
2026-07-21 14:55:57 runnervm3jd5f matplotlib.font_manager[2874] DEBUG findfont: score(FontEntry(fname='/usr/share/fonts/truetype/lato/Lato-Semibold.ttf', index=0, name='Lato Semibold', style='normal', variant='normal', weight=400, stretch='normal', size='scalable')) = 10.05
2026-07-21 14:55:57 runnervm3jd5f matplotlib.font_manager[2874] DEBUG findfont: score(FontEntry(fname='/home/runner/micromamba/envs/trajan/fonts/Inconsolata-Bold.ttf', index=0, name='Inconsolata', style='normal', variant='normal', weight=700, stretch='normal', size='scalable')) = 10.335
2026-07-21 14:55:57 runnervm3jd5f matplotlib.font_manager[2874] DEBUG findfont: score(FontEntry(fname='/usr/share/fonts/truetype/dejavu/DejaVuSans-ExtraLight.ttf', index=0, name='DejaVu Sans', style='normal', variant='normal', weight=200, stretch='normal', size='scalable')) = 10.24
2026-07-21 14:55:57 runnervm3jd5f matplotlib.font_manager[2874] DEBUG findfont: score(FontEntry(fname='/usr/share/fonts/truetype/dejavu/DejaVuSans-ExtraLight.ttf', index=0, name='DejaVu Sans Light', style='normal', variant='normal', weight=200, stretch='normal', size='scalable')) = 10.24
2026-07-21 14:55:57 runnervm3jd5f matplotlib.font_manager[2874] DEBUG findfont: score(FontEntry(fname='/home/runner/micromamba/envs/trajan/fonts/Ubuntu-BI.ttf', index=0, name='Ubuntu', style='italic', variant='normal', weight=700, stretch='normal', size='scalable')) = 11.335
2026-07-21 14:55:57 runnervm3jd5f matplotlib.font_manager[2874] DEBUG findfont: score(FontEntry(fname='/usr/share/fonts/truetype/dejavu/DejaVuSans-BoldOblique.ttf', index=0, name='DejaVu Sans', style='oblique', variant='normal', weight=700, stretch='normal', size='scalable')) = 11.335
2026-07-21 14:55:57 runnervm3jd5f matplotlib.font_manager[2874] DEBUG findfont: score(FontEntry(fname='/home/runner/micromamba/envs/trajan/fonts/Ubuntu-RI.ttf', index=0, name='Ubuntu', style='italic', variant='normal', weight=400, stretch='normal', size='scalable')) = 11.05
2026-07-21 14:55:57 runnervm3jd5f matplotlib.font_manager[2874] DEBUG findfont: score(FontEntry(fname='/usr/share/fonts/truetype/dejavu/DejaVuSerif-Italic.ttf', index=0, name='DejaVu Serif', style='italic', variant='normal', weight=400, stretch='normal', size='scalable')) = 11.05
2026-07-21 14:55:57 runnervm3jd5f matplotlib.font_manager[2874] DEBUG findfont: score(FontEntry(fname='/home/runner/micromamba/envs/trajan/fonts/SourceCodePro-Medium.ttf', index=0, name='Source Code Pro', style='normal', variant='normal', weight=500, stretch='normal', size='scalable')) = 10.145
2026-07-21 14:55:57 runnervm3jd5f matplotlib.font_manager[2874] DEBUG findfont: score(FontEntry(fname='/home/runner/micromamba/envs/trajan/fonts/SourceCodePro-Medium.ttf', index=0, name='Source Code Pro Medium', style='normal', variant='normal', weight=400, stretch='normal', size='scalable')) = 10.05
2026-07-21 14:55:57 runnervm3jd5f matplotlib.font_manager[2874] DEBUG findfont: score(FontEntry(fname='/usr/share/fonts/truetype/lato/Lato-HeavyItalic.ttf', index=0, name='Lato', style='italic', variant='normal', weight=800, stretch='normal', size='scalable')) = 11.43
2026-07-21 14:55:57 runnervm3jd5f matplotlib.font_manager[2874] DEBUG findfont: score(FontEntry(fname='/usr/share/fonts/truetype/lato/Lato-HeavyItalic.ttf', index=0, name='Lato Heavy', style='italic', variant='normal', weight=400, stretch='normal', size='scalable')) = 11.05
2026-07-21 14:55:57 runnervm3jd5f matplotlib.font_manager[2874] DEBUG findfont: score(FontEntry(fname='/usr/share/fonts/truetype/dejavu/DejaVuSans-Oblique.ttf', index=0, name='DejaVu Sans', style='oblique', variant='normal', weight=400, stretch='normal', size='scalable')) = 11.05
2026-07-21 14:55:57 runnervm3jd5f matplotlib.font_manager[2874] DEBUG findfont: score(FontEntry(fname='/home/runner/micromamba/envs/trajan/fonts/Ubuntu-M.ttf', index=0, name='Ubuntu', style='normal', variant='normal', weight=500, stretch='normal', size='scalable')) = 10.145
2026-07-21 14:55:57 runnervm3jd5f matplotlib.font_manager[2874] DEBUG findfont: score(FontEntry(fname='/home/runner/micromamba/envs/trajan/fonts/Ubuntu-M.ttf', index=0, name='Ubuntu Light', style='normal', variant='normal', weight=700, stretch='normal', size='scalable')) = 10.335
2026-07-21 14:55:57 runnervm3jd5f matplotlib.font_manager[2874] DEBUG findfont: score(FontEntry(fname='/usr/share/fonts/truetype/liberation/LiberationMono-BoldItalic.ttf', index=0, name='Liberation Mono', style='italic', variant='normal', weight=700, stretch='normal', size='scalable')) = 11.335
2026-07-21 14:55:57 runnervm3jd5f matplotlib.font_manager[2874] DEBUG findfont: score(FontEntry(fname='/usr/share/fonts/truetype/dejavu/DejaVuSansMono.ttf', index=0, name='DejaVu Sans Mono', style='normal', variant='normal', weight=400, stretch='normal', size='scalable')) = 10.05
2026-07-21 14:55:57 runnervm3jd5f matplotlib.font_manager[2874] DEBUG findfont: score(FontEntry(fname='/usr/share/fonts/truetype/dejavu/DejaVuMathTeXGyre.ttf', index=0, name='DejaVu Math TeX Gyre', style='normal', variant='normal', weight=400, stretch='normal', size='scalable')) = 10.05
2026-07-21 14:55:57 runnervm3jd5f matplotlib.font_manager[2874] DEBUG findfont: score(FontEntry(fname='/usr/share/fonts/truetype/dejavu/DejaVuSansMono-Oblique.ttf', index=0, name='DejaVu Sans Mono', style='oblique', variant='normal', weight=400, stretch='normal', size='scalable')) = 11.05
2026-07-21 14:55:57 runnervm3jd5f matplotlib.font_manager[2874] DEBUG findfont: score(FontEntry(fname='/home/runner/micromamba/envs/trajan/fonts/Ubuntu-L.ttf', index=0, name='Ubuntu', style='normal', variant='normal', weight=300, stretch='normal', size='scalable')) = 10.145
2026-07-21 14:55:57 runnervm3jd5f matplotlib.font_manager[2874] DEBUG findfont: score(FontEntry(fname='/home/runner/micromamba/envs/trajan/fonts/Ubuntu-L.ttf', index=0, name='Ubuntu Light', style='normal', variant='normal', weight=400, stretch='normal', size='scalable')) = 10.05
2026-07-21 14:55:57 runnervm3jd5f matplotlib.font_manager[2874] DEBUG findfont: score(FontEntry(fname='/home/runner/micromamba/envs/trajan/fonts/SourceCodePro-MediumIt.ttf', index=0, name='Source Code Pro', style='italic', variant='normal', weight=500, stretch='normal', size='scalable')) = 11.145
2026-07-21 14:55:57 runnervm3jd5f matplotlib.font_manager[2874] DEBUG findfont: score(FontEntry(fname='/home/runner/micromamba/envs/trajan/fonts/SourceCodePro-MediumIt.ttf', index=0, name='Source Code Pro Medium', style='italic', variant='normal', weight=400, stretch='normal', size='scalable')) = 11.05
2026-07-21 14:55:57 runnervm3jd5f matplotlib.font_manager[2874] DEBUG findfont: score(FontEntry(fname='/home/runner/micromamba/envs/trajan/fonts/SourceCodePro-Regular.ttf', index=0, name='Source Code Pro', style='normal', variant='normal', weight=400, stretch='normal', size='scalable')) = 10.05
2026-07-21 14:55:57 runnervm3jd5f matplotlib.font_manager[2874] DEBUG findfont: score(FontEntry(fname='/home/runner/micromamba/envs/trajan/fonts/SourceCodePro-SemiboldIt.ttf', index=0, name='Source Code Pro', style='italic', variant='normal', weight=600, stretch='normal', size='scalable')) = 11.24
2026-07-21 14:55:57 runnervm3jd5f matplotlib.font_manager[2874] DEBUG findfont: score(FontEntry(fname='/home/runner/micromamba/envs/trajan/fonts/SourceCodePro-SemiboldIt.ttf', index=0, name='Source Code Pro Semibold', style='italic', variant='normal', weight=400, stretch='normal', size='scalable')) = 11.05
2026-07-21 14:55:57 runnervm3jd5f matplotlib.font_manager[2874] DEBUG findfont: score(FontEntry(fname='/usr/share/fonts/truetype/dejavu/DejaVuSerif.ttf', index=0, name='DejaVu Serif', style='normal', variant='normal', weight=400, stretch='normal', size='scalable')) = 10.05
2026-07-21 14:55:57 runnervm3jd5f matplotlib.font_manager[2874] DEBUG findfont: score(FontEntry(fname='/usr/share/fonts/truetype/dejavu/DejaVuSerif-Bold.ttf', index=0, name='DejaVu Serif', style='normal', variant='normal', weight=700, stretch='normal', size='scalable')) = 10.335
2026-07-21 14:55:57 runnervm3jd5f matplotlib.font_manager[2874] DEBUG findfont: score(FontEntry(fname='/usr/share/fonts/truetype/liberation/LiberationSerif-Italic.ttf', index=0, name='Liberation Serif', style='italic', variant='normal', weight=400, stretch='normal', size='scalable')) = 11.05
2026-07-21 14:55:57 runnervm3jd5f matplotlib.font_manager[2874] DEBUG findfont: score(FontEntry(fname='/usr/share/fonts/truetype/dejavu/DejaVuSansMono-BoldOblique.ttf', index=0, name='DejaVu Sans Mono', style='oblique', variant='normal', weight=700, stretch='normal', size='scalable')) = 11.335
2026-07-21 14:55:57 runnervm3jd5f matplotlib.font_manager[2874] DEBUG findfont: score(FontEntry(fname='/home/runner/micromamba/envs/trajan/fonts/SourceCodePro-Light.ttf', index=0, name='Source Code Pro', style='normal', variant='normal', weight=300, stretch='normal', size='scalable')) = 10.145
2026-07-21 14:55:57 runnervm3jd5f matplotlib.font_manager[2874] DEBUG findfont: score(FontEntry(fname='/home/runner/micromamba/envs/trajan/fonts/SourceCodePro-Light.ttf', index=0, name='Source Code Pro Light', style='normal', variant='normal', weight=400, stretch='normal', size='scalable')) = 10.05
2026-07-21 14:55:57 runnervm3jd5f matplotlib.font_manager[2874] DEBUG findfont: score(FontEntry(fname='/usr/share/fonts/truetype/liberation/LiberationMono-Italic.ttf', index=0, name='Liberation Mono', style='italic', variant='normal', weight=400, stretch='normal', size='scalable')) = 11.05
2026-07-21 14:55:57 runnervm3jd5f matplotlib.font_manager[2874] DEBUG findfont: Matching STIXSizeThreeSym:style=normal:variant=normal:weight=normal:stretch=normal:size=10.0 to STIXSizeThreeSym ('/home/runner/micromamba/envs/trajan/lib/python3.14/site-packages/matplotlib/mpl-data/fonts/ttf/STIXSizThreeSymReg.ttf') with score of 0.050000.
2026-07-21 14:55:57 runnervm3jd5f matplotlib.font_manager[2874] DEBUG findfont: Matching STIXSizeFourSym:style=normal:variant=normal:weight=normal:stretch=normal:size=10.0.
2026-07-21 14:55:57 runnervm3jd5f matplotlib.font_manager[2874] DEBUG findfont: score(FontEntry(fname='/home/runner/micromamba/envs/trajan/lib/python3.14/site-packages/matplotlib/mpl-data/fonts/ttf/cmmi10.ttf', index=0, name='cmmi10', style='normal', variant='normal', weight=400, stretch='normal', size='scalable')) = 10.05
2026-07-21 14:55:57 runnervm3jd5f matplotlib.font_manager[2874] DEBUG findfont: score(FontEntry(fname='/home/runner/micromamba/envs/trajan/lib/python3.14/site-packages/matplotlib/mpl-data/fonts/ttf/DejaVuSerif-Bold.ttf', index=0, name='DejaVu Serif', style='normal', variant='normal', weight=700, stretch='normal', size='scalable')) = 10.335
2026-07-21 14:55:57 runnervm3jd5f matplotlib.font_manager[2874] DEBUG findfont: score(FontEntry(fname='/home/runner/micromamba/envs/trajan/lib/python3.14/site-packages/matplotlib/mpl-data/fonts/ttf/DejaVuSans-Oblique.ttf', index=0, name='DejaVu Sans', style='oblique', variant='normal', weight=400, stretch='normal', size='scalable')) = 11.05
2026-07-21 14:55:57 runnervm3jd5f matplotlib.font_manager[2874] DEBUG findfont: score(FontEntry(fname='/home/runner/micromamba/envs/trajan/lib/python3.14/site-packages/matplotlib/mpl-data/fonts/ttf/STIXSizThreeSymReg.ttf', index=0, name='STIXSizeThreeSym', style='normal', variant='normal', weight=400, stretch='normal', size='scalable')) = 10.05
2026-07-21 14:55:57 runnervm3jd5f matplotlib.font_manager[2874] DEBUG findfont: score(FontEntry(fname='/home/runner/micromamba/envs/trajan/lib/python3.14/site-packages/matplotlib/mpl-data/fonts/ttf/STIXNonUniBolIta.ttf', index=0, name='STIXNonUnicode', style='italic', variant='normal', weight=700, stretch='normal', size='scalable')) = 11.335
2026-07-21 14:55:57 runnervm3jd5f matplotlib.font_manager[2874] DEBUG findfont: score(FontEntry(fname='/home/runner/micromamba/envs/trajan/lib/python3.14/site-packages/matplotlib/mpl-data/fonts/ttf/DejaVuSerifDisplay.ttf', index=0, name='DejaVu Serif Display', style='normal', variant='normal', weight=400, stretch='normal', size='scalable')) = 10.05
2026-07-21 14:55:57 runnervm3jd5f matplotlib.font_manager[2874] DEBUG findfont: score(FontEntry(fname='/home/runner/micromamba/envs/trajan/lib/python3.14/site-packages/matplotlib/mpl-data/fonts/ttf/cmss10.ttf', index=0, name='cmss10', style='normal', variant='normal', weight=400, stretch='normal', size='scalable')) = 10.05
2026-07-21 14:55:57 runnervm3jd5f matplotlib.font_manager[2874] DEBUG findfont: score(FontEntry(fname='/home/runner/micromamba/envs/trajan/lib/python3.14/site-packages/matplotlib/mpl-data/fonts/ttf/STIXGeneralBolIta.ttf', index=0, name='STIXGeneral', style='italic', variant='normal', weight=700, stretch='normal', size='scalable')) = 11.335
2026-07-21 14:55:57 runnervm3jd5f matplotlib.font_manager[2874] DEBUG findfont: score(FontEntry(fname='/home/runner/micromamba/envs/trajan/lib/python3.14/site-packages/matplotlib/mpl-data/fonts/ttf/cmtt10.ttf', index=0, name='cmtt10', style='normal', variant='normal', weight=400, stretch='normal', size='scalable')) = 10.05
2026-07-21 14:55:57 runnervm3jd5f matplotlib.font_manager[2874] DEBUG findfont: score(FontEntry(fname='/home/runner/micromamba/envs/trajan/lib/python3.14/site-packages/matplotlib/mpl-data/fonts/ttf/cmsy10.ttf', index=0, name='cmsy10', style='normal', variant='normal', weight=400, stretch='normal', size='scalable')) = 10.05
2026-07-21 14:55:57 runnervm3jd5f matplotlib.font_manager[2874] DEBUG findfont: score(FontEntry(fname='/home/runner/micromamba/envs/trajan/lib/python3.14/site-packages/matplotlib/mpl-data/fonts/ttf/DejaVuSansMono-Oblique.ttf', index=0, name='DejaVu Sans Mono', style='oblique', variant='normal', weight=400, stretch='normal', size='scalable')) = 11.05
2026-07-21 14:55:57 runnervm3jd5f matplotlib.font_manager[2874] DEBUG findfont: score(FontEntry(fname='/home/runner/micromamba/envs/trajan/lib/python3.14/site-packages/matplotlib/mpl-data/fonts/ttf/STIXNonUniIta.ttf', index=0, name='STIXNonUnicode', style='italic', variant='normal', weight=400, stretch='normal', size='scalable')) = 11.05
2026-07-21 14:55:57 runnervm3jd5f matplotlib.font_manager[2874] DEBUG findfont: score(FontEntry(fname='/home/runner/micromamba/envs/trajan/lib/python3.14/site-packages/matplotlib/mpl-data/fonts/ttf/STIXGeneral.ttf', index=0, name='STIXGeneral', style='normal', variant='normal', weight=400, stretch='normal', size='scalable')) = 10.05
2026-07-21 14:55:57 runnervm3jd5f matplotlib.font_manager[2874] DEBUG findfont: score(FontEntry(fname='/home/runner/micromamba/envs/trajan/lib/python3.14/site-packages/matplotlib/mpl-data/fonts/ttf/cmti10.ttf', index=0, name='cmti10', style='normal', variant='normal', weight=400, stretch='normal', size='scalable')) = 10.05
2026-07-21 14:55:57 runnervm3jd5f matplotlib.font_manager[2874] DEBUG findfont: score(FontEntry(fname='/home/runner/micromamba/envs/trajan/lib/python3.14/site-packages/matplotlib/mpl-data/fonts/ttf/DejaVuSansMono-BoldOblique.ttf', index=0, name='DejaVu Sans Mono', style='oblique', variant='normal', weight=700, stretch='normal', size='scalable')) = 11.335
2026-07-21 14:55:57 runnervm3jd5f matplotlib.font_manager[2874] DEBUG findfont: score(FontEntry(fname='/home/runner/micromamba/envs/trajan/lib/python3.14/site-packages/matplotlib/mpl-data/fonts/ttf/DejaVuSerif.ttf', index=0, name='DejaVu Serif', style='normal', variant='normal', weight=400, stretch='normal', size='scalable')) = 10.05
2026-07-21 14:55:57 runnervm3jd5f matplotlib.font_manager[2874] DEBUG findfont: score(FontEntry(fname='/home/runner/micromamba/envs/trajan/lib/python3.14/site-packages/matplotlib/mpl-data/fonts/ttf/LastResortHE-Regular.ttf', index=0, name='Last Resort High-Efficiency', style='normal', variant='normal', weight=400, stretch='normal', size='scalable')) = 10.05
2026-07-21 14:55:57 runnervm3jd5f matplotlib.font_manager[2874] DEBUG findfont: score(FontEntry(fname='/home/runner/micromamba/envs/trajan/lib/python3.14/site-packages/matplotlib/mpl-data/fonts/ttf/cmex10.ttf', index=0, name='cmex10', style='normal', variant='normal', weight=400, stretch='normal', size='scalable')) = 10.05
2026-07-21 14:55:57 runnervm3jd5f matplotlib.font_manager[2874] DEBUG findfont: score(FontEntry(fname='/home/runner/micromamba/envs/trajan/lib/python3.14/site-packages/matplotlib/mpl-data/fonts/ttf/STIXSizFiveSymReg.ttf', index=0, name='STIXSizeFiveSym', style='normal', variant='normal', weight=400, stretch='normal', size='scalable')) = 10.05
2026-07-21 14:55:57 runnervm3jd5f matplotlib.font_manager[2874] DEBUG findfont: score(FontEntry(fname='/home/runner/micromamba/envs/trajan/lib/python3.14/site-packages/matplotlib/mpl-data/fonts/ttf/STIXNonUniBol.ttf', index=0, name='STIXNonUnicode', style='normal', variant='normal', weight=700, stretch='normal', size='scalable')) = 10.335
2026-07-21 14:55:57 runnervm3jd5f matplotlib.font_manager[2874] DEBUG findfont: score(FontEntry(fname='/home/runner/micromamba/envs/trajan/lib/python3.14/site-packages/matplotlib/mpl-data/fonts/ttf/DejaVuSansDisplay.ttf', index=0, name='DejaVu Sans Display', style='normal', variant='normal', weight=400, stretch='normal', size='scalable')) = 10.05
2026-07-21 14:55:57 runnervm3jd5f matplotlib.font_manager[2874] DEBUG findfont: score(FontEntry(fname='/home/runner/micromamba/envs/trajan/lib/python3.14/site-packages/matplotlib/mpl-data/fonts/ttf/DejaVuSansMono.ttf', index=0, name='DejaVu Sans Mono', style='normal', variant='normal', weight=400, stretch='normal', size='scalable')) = 10.05
2026-07-21 14:55:57 runnervm3jd5f matplotlib.font_manager[2874] DEBUG findfont: score(FontEntry(fname='/home/runner/micromamba/envs/trajan/lib/python3.14/site-packages/matplotlib/mpl-data/fonts/ttf/cmb10.ttf', index=0, name='cmb10', style='normal', variant='normal', weight=400, stretch='normal', size='scalable')) = 10.05
2026-07-21 14:55:57 runnervm3jd5f matplotlib.font_manager[2874] DEBUG findfont: score(FontEntry(fname='/home/runner/micromamba/envs/trajan/lib/python3.14/site-packages/matplotlib/mpl-data/fonts/ttf/STIXSizTwoSymReg.ttf', index=0, name='STIXSizeTwoSym', style='normal', variant='normal', weight=400, stretch='normal', size='scalable')) = 10.05
2026-07-21 14:55:57 runnervm3jd5f matplotlib.font_manager[2874] DEBUG findfont: score(FontEntry(fname='/home/runner/micromamba/envs/trajan/lib/python3.14/site-packages/matplotlib/mpl-data/fonts/ttf/DejaVuSans.ttf', index=0, name='DejaVu Sans', style='normal', variant='normal', weight=400, stretch='normal', size='scalable')) = 10.05
2026-07-21 14:55:57 runnervm3jd5f matplotlib.font_manager[2874] DEBUG findfont: score(FontEntry(fname='/home/runner/micromamba/envs/trajan/lib/python3.14/site-packages/matplotlib/mpl-data/fonts/ttf/STIXNonUni.ttf', index=0, name='STIXNonUnicode', style='normal', variant='normal', weight=400, stretch='normal', size='scalable')) = 10.05
2026-07-21 14:55:57 runnervm3jd5f matplotlib.font_manager[2874] DEBUG findfont: score(FontEntry(fname='/home/runner/micromamba/envs/trajan/lib/python3.14/site-packages/matplotlib/mpl-data/fonts/ttf/STIXGeneralItalic.ttf', index=0, name='STIXGeneral', style='italic', variant='normal', weight=400, stretch='normal', size='scalable')) = 11.05
2026-07-21 14:55:57 runnervm3jd5f matplotlib.font_manager[2874] DEBUG findfont: score(FontEntry(fname='/home/runner/micromamba/envs/trajan/lib/python3.14/site-packages/matplotlib/mpl-data/fonts/ttf/STIXSizOneSymBol.ttf', index=0, name='STIXSizeOneSym', style='normal', variant='normal', weight=700, stretch='normal', size='scalable')) = 10.335
2026-07-21 14:55:57 runnervm3jd5f matplotlib.font_manager[2874] DEBUG findfont: score(FontEntry(fname='/home/runner/micromamba/envs/trajan/lib/python3.14/site-packages/matplotlib/mpl-data/fonts/ttf/DejaVuSansMono-Bold.ttf', index=0, name='DejaVu Sans Mono', style='normal', variant='normal', weight=700, stretch='normal', size='scalable')) = 10.335
2026-07-21 14:55:57 runnervm3jd5f matplotlib.font_manager[2874] DEBUG findfont: score(FontEntry(fname='/home/runner/micromamba/envs/trajan/lib/python3.14/site-packages/matplotlib/mpl-data/fonts/ttf/STIXSizTwoSymBol.ttf', index=0, name='STIXSizeTwoSym', style='normal', variant='normal', weight=700, stretch='normal', size='scalable')) = 10.335
2026-07-21 14:55:57 runnervm3jd5f matplotlib.font_manager[2874] DEBUG findfont: score(FontEntry(fname='/home/runner/micromamba/envs/trajan/lib/python3.14/site-packages/matplotlib/mpl-data/fonts/ttf/STIXSizThreeSymBol.ttf', index=0, name='STIXSizeThreeSym', style='normal', variant='normal', weight=700, stretch='normal', size='scalable')) = 10.335
2026-07-21 14:55:57 runnervm3jd5f matplotlib.font_manager[2874] DEBUG findfont: score(FontEntry(fname='/home/runner/micromamba/envs/trajan/lib/python3.14/site-packages/matplotlib/mpl-data/fonts/ttf/DejaVuSerif-BoldItalic.ttf', index=0, name='DejaVu Serif', style='italic', variant='normal', weight=700, stretch='normal', size='scalable')) = 11.335
2026-07-21 14:55:57 runnervm3jd5f matplotlib.font_manager[2874] DEBUG findfont: score(FontEntry(fname='/home/runner/micromamba/envs/trajan/lib/python3.14/site-packages/matplotlib/mpl-data/fonts/ttf/DejaVuSerif-Italic.ttf', index=0, name='DejaVu Serif', style='italic', variant='normal', weight=400, stretch='normal', size='scalable')) = 11.05
2026-07-21 14:55:57 runnervm3jd5f matplotlib.font_manager[2874] DEBUG findfont: score(FontEntry(fname='/home/runner/micromamba/envs/trajan/lib/python3.14/site-packages/matplotlib/mpl-data/fonts/ttf/DejaVuSans-Bold.ttf', index=0, name='DejaVu Sans', style='normal', variant='normal', weight=700, stretch='normal', size='scalable')) = 10.335
2026-07-21 14:55:57 runnervm3jd5f matplotlib.font_manager[2874] DEBUG findfont: score(FontEntry(fname='/home/runner/micromamba/envs/trajan/lib/python3.14/site-packages/matplotlib/mpl-data/fonts/ttf/STIXSizFourSymBol.ttf', index=0, name='STIXSizeFourSym', style='normal', variant='normal', weight=700, stretch='normal', size='scalable')) = 0.33499999999999996
2026-07-21 14:55:57 runnervm3jd5f matplotlib.font_manager[2874] DEBUG findfont: score(FontEntry(fname='/home/runner/micromamba/envs/trajan/lib/python3.14/site-packages/matplotlib/mpl-data/fonts/ttf/STIXSizOneSymReg.ttf', index=0, name='STIXSizeOneSym', style='normal', variant='normal', weight=400, stretch='normal', size='scalable')) = 10.05
2026-07-21 14:55:57 runnervm3jd5f matplotlib.font_manager[2874] DEBUG findfont: score(FontEntry(fname='/home/runner/micromamba/envs/trajan/lib/python3.14/site-packages/matplotlib/mpl-data/fonts/ttf/cmr10.ttf', index=0, name='cmr10', style='normal', variant='normal', weight=400, stretch='normal', size='scalable')) = 10.05
2026-07-21 14:55:57 runnervm3jd5f matplotlib.font_manager[2874] DEBUG findfont: score(FontEntry(fname='/home/runner/micromamba/envs/trajan/lib/python3.14/site-packages/matplotlib/mpl-data/fonts/ttf/STIXGeneralBol.ttf', index=0, name='STIXGeneral', style='normal', variant='normal', weight=700, stretch='normal', size='scalable')) = 10.335
2026-07-21 14:55:57 runnervm3jd5f matplotlib.font_manager[2874] DEBUG findfont: score(FontEntry(fname='/home/runner/micromamba/envs/trajan/lib/python3.14/site-packages/matplotlib/mpl-data/fonts/ttf/DejaVuSans-BoldOblique.ttf', index=0, name='DejaVu Sans', style='oblique', variant='normal', weight=700, stretch='normal', size='scalable')) = 11.335
2026-07-21 14:55:57 runnervm3jd5f matplotlib.font_manager[2874] DEBUG findfont: score(FontEntry(fname='/home/runner/micromamba/envs/trajan/lib/python3.14/site-packages/matplotlib/mpl-data/fonts/ttf/STIXSizFourSymReg.ttf', index=0, name='STIXSizeFourSym', style='normal', variant='normal', weight=400, stretch='normal', size='scalable')) = 0.05
2026-07-21 14:55:57 runnervm3jd5f matplotlib.font_manager[2874] DEBUG findfont: score(FontEntry(fname='/usr/share/fonts/truetype/lato/Lato-Black.ttf', index=0, name='Lato', style='normal', variant='normal', weight=900, stretch='normal', size='scalable')) = 10.525
2026-07-21 14:55:57 runnervm3jd5f matplotlib.font_manager[2874] DEBUG findfont: score(FontEntry(fname='/usr/share/fonts/truetype/lato/Lato-Black.ttf', index=0, name='Lato Black', style='normal', variant='normal', weight=400, stretch='normal', size='scalable')) = 10.05
2026-07-21 14:55:57 runnervm3jd5f matplotlib.font_manager[2874] DEBUG findfont: score(FontEntry(fname='/usr/share/fonts/truetype/liberation/LiberationSerif-Regular.ttf', index=0, name='Liberation Serif', style='normal', variant='normal', weight=400, stretch='normal', size='scalable')) = 10.05
2026-07-21 14:55:57 runnervm3jd5f matplotlib.font_manager[2874] DEBUG findfont: score(FontEntry(fname='/usr/share/fonts/truetype/dejavu/DejaVuSerifCondensed.ttf', index=0, name='DejaVu Serif', style='normal', variant='normal', weight=400, stretch='condensed', size='scalable')) = 10.25
2026-07-21 14:55:57 runnervm3jd5f matplotlib.font_manager[2874] DEBUG findfont: score(FontEntry(fname='/usr/share/fonts/truetype/dejavu/DejaVuSerifCondensed.ttf', index=0, name='DejaVu Serif Condensed', style='normal', variant='normal', weight=380, stretch='condensed', size='scalable')) = 10.269
2026-07-21 14:55:57 runnervm3jd5f matplotlib.font_manager[2874] DEBUG findfont: score(FontEntry(fname='/home/runner/micromamba/envs/trajan/fonts/UbuntuMono-BI.ttf', index=0, name='Ubuntu Mono', style='italic', variant='normal', weight=700, stretch='normal', size='scalable')) = 11.335
2026-07-21 14:55:57 runnervm3jd5f matplotlib.font_manager[2874] DEBUG findfont: score(FontEntry(fname='/usr/share/fonts/truetype/dejavu/DejaVuSans.ttf', index=0, name='DejaVu Sans', style='normal', variant='normal', weight=400, stretch='normal', size='scalable')) = 10.05
2026-07-21 14:55:57 runnervm3jd5f matplotlib.font_manager[2874] DEBUG findfont: score(FontEntry(fname='/usr/share/fonts/truetype/lato/Lato-Italic.ttf', index=0, name='Lato', style='italic', variant='normal', weight=400, stretch='normal', size='scalable')) = 11.05
2026-07-21 14:55:57 runnervm3jd5f matplotlib.font_manager[2874] DEBUG findfont: score(FontEntry(fname='/usr/share/fonts/truetype/liberation/LiberationSans-Italic.ttf', index=0, name='Liberation Sans', style='italic', variant='normal', weight=400, stretch='normal', size='scalable')) = 11.05
2026-07-21 14:55:57 runnervm3jd5f matplotlib.font_manager[2874] DEBUG findfont: score(FontEntry(fname='/home/runner/micromamba/envs/trajan/fonts/Ubuntu-B.ttf', index=0, name='Ubuntu', style='normal', variant='normal', weight=700, stretch='normal', size='scalable')) = 10.335
2026-07-21 14:55:57 runnervm3jd5f matplotlib.font_manager[2874] DEBUG findfont: score(FontEntry(fname='/home/runner/micromamba/envs/trajan/fonts/SourceCodePro-Semibold.ttf', index=0, name='Source Code Pro', style='normal', variant='normal', weight=600, stretch='normal', size='scalable')) = 10.24
2026-07-21 14:55:57 runnervm3jd5f matplotlib.font_manager[2874] DEBUG findfont: score(FontEntry(fname='/home/runner/micromamba/envs/trajan/fonts/SourceCodePro-Semibold.ttf', index=0, name='Source Code Pro Semibold', style='normal', variant='normal', weight=400, stretch='normal', size='scalable')) = 10.05
2026-07-21 14:55:57 runnervm3jd5f matplotlib.font_manager[2874] DEBUG findfont: score(FontEntry(fname='/home/runner/micromamba/envs/trajan/fonts/SourceCodePro-Bold.ttf', index=0, name='Source Code Pro', style='normal', variant='normal', weight=700, stretch='normal', size='scalable')) = 10.335
2026-07-21 14:55:57 runnervm3jd5f matplotlib.font_manager[2874] DEBUG findfont: score(FontEntry(fname='/home/runner/micromamba/envs/trajan/fonts/Ubuntu-MI.ttf', index=0, name='Ubuntu', style='italic', variant='normal', weight=500, stretch='normal', size='scalable')) = 11.145
2026-07-21 14:55:57 runnervm3jd5f matplotlib.font_manager[2874] DEBUG findfont: score(FontEntry(fname='/home/runner/micromamba/envs/trajan/fonts/Ubuntu-MI.ttf', index=0, name='Ubuntu Light', style='italic', variant='normal', weight=700, stretch='normal', size='scalable')) = 11.335
2026-07-21 14:55:57 runnervm3jd5f matplotlib.font_manager[2874] DEBUG findfont: score(FontEntry(fname='/usr/share/fonts/truetype/lato/Lato-Regular.ttf', index=0, name='Lato', style='normal', variant='normal', weight=400, stretch='normal', size='scalable')) = 10.05
2026-07-21 14:55:57 runnervm3jd5f matplotlib.font_manager[2874] DEBUG findfont: score(FontEntry(fname='/usr/share/fonts/truetype/lato/Lato-ThinItalic.ttf', index=0, name='Lato', style='italic', variant='normal', weight=275, stretch='normal', size='scalable')) = 11.16875
2026-07-21 14:55:57 runnervm3jd5f matplotlib.font_manager[2874] DEBUG findfont: score(FontEntry(fname='/usr/share/fonts/truetype/lato/Lato-ThinItalic.ttf', index=0, name='Lato Thin', style='italic', variant='normal', weight=400, stretch='normal', size='scalable')) = 11.05
2026-07-21 14:55:57 runnervm3jd5f matplotlib.font_manager[2874] DEBUG findfont: score(FontEntry(fname='/usr/share/fonts/truetype/lato/Lato-BlackItalic.ttf', index=0, name='Lato', style='italic', variant='normal', weight=900, stretch='normal', size='scalable')) = 11.525
2026-07-21 14:55:57 runnervm3jd5f matplotlib.font_manager[2874] DEBUG findfont: score(FontEntry(fname='/usr/share/fonts/truetype/lato/Lato-BlackItalic.ttf', index=0, name='Lato Black', style='italic', variant='normal', weight=400, stretch='normal', size='scalable')) = 11.05
2026-07-21 14:55:57 runnervm3jd5f matplotlib.font_manager[2874] DEBUG findfont: score(FontEntry(fname='/usr/share/fonts/truetype/dejavu/DejaVuSerifCondensed-Italic.ttf', index=0, name='DejaVu Serif', style='italic', variant='normal', weight=400, stretch='condensed', size='scalable')) = 11.25
2026-07-21 14:55:57 runnervm3jd5f matplotlib.font_manager[2874] DEBUG findfont: score(FontEntry(fname='/usr/share/fonts/truetype/dejavu/DejaVuSerifCondensed-Italic.ttf', index=0, name='DejaVu Serif Condensed', style='italic', variant='normal', weight=400, stretch='condensed', size='scalable')) = 11.25
2026-07-21 14:55:57 runnervm3jd5f matplotlib.font_manager[2874] DEBUG findfont: score(FontEntry(fname='/usr/share/fonts/truetype/dejavu/DejaVuSans-Bold.ttf', index=0, name='DejaVu Sans', style='normal', variant='normal', weight=700, stretch='normal', size='scalable')) = 10.335
2026-07-21 14:55:57 runnervm3jd5f matplotlib.font_manager[2874] DEBUG findfont: score(FontEntry(fname='/home/runner/micromamba/envs/trajan/fonts/UbuntuMono-R.ttf', index=0, name='Ubuntu Mono', style='normal', variant='normal', weight=400, stretch='normal', size='scalable')) = 10.05
2026-07-21 14:55:57 runnervm3jd5f matplotlib.font_manager[2874] DEBUG findfont: score(FontEntry(fname='/usr/share/fonts/truetype/dejavu/DejaVuSerif-BoldItalic.ttf', index=0, name='DejaVu Serif', style='italic', variant='normal', weight=700, stretch='normal', size='scalable')) = 11.335
2026-07-21 14:55:57 runnervm3jd5f matplotlib.font_manager[2874] DEBUG findfont: score(FontEntry(fname='/usr/share/fonts/truetype/lato/Lato-Hairline.ttf', index=0, name='Lato', style='normal', variant='normal', weight=250, stretch='normal', size='scalable')) = 10.1925
2026-07-21 14:55:57 runnervm3jd5f matplotlib.font_manager[2874] DEBUG findfont: score(FontEntry(fname='/usr/share/fonts/truetype/lato/Lato-Hairline.ttf', index=0, name='Lato Hairline', style='normal', variant='normal', weight=400, stretch='normal', size='scalable')) = 10.05
2026-07-21 14:55:57 runnervm3jd5f matplotlib.font_manager[2874] DEBUG findfont: score(FontEntry(fname='/usr/share/fonts/truetype/lato/Lato-LightItalic.ttf', index=0, name='Lato', style='italic', variant='normal', weight=300, stretch='normal', size='scalable')) = 11.145
2026-07-21 14:55:57 runnervm3jd5f matplotlib.font_manager[2874] DEBUG findfont: score(FontEntry(fname='/usr/share/fonts/truetype/lato/Lato-LightItalic.ttf', index=0, name='Lato Light', style='italic', variant='normal', weight=400, stretch='normal', size='scalable')) = 11.05
2026-07-21 14:55:57 runnervm3jd5f matplotlib.font_manager[2874] DEBUG findfont: score(FontEntry(fname='/usr/share/fonts/truetype/dejavu/DejaVuSansCondensed-BoldOblique.ttf', index=0, name='DejaVu Sans', style='oblique', variant='normal', weight=700, stretch='condensed', size='scalable')) = 11.535
2026-07-21 14:55:57 runnervm3jd5f matplotlib.font_manager[2874] DEBUG findfont: score(FontEntry(fname='/usr/share/fonts/truetype/dejavu/DejaVuSansCondensed-BoldOblique.ttf', index=0, name='DejaVu Sans Condensed', style='oblique', variant='normal', weight=700, stretch='condensed', size='scalable')) = 11.535
2026-07-21 14:55:57 runnervm3jd5f matplotlib.font_manager[2874] DEBUG findfont: score(FontEntry(fname='/home/runner/micromamba/envs/trajan/fonts/SourceCodePro-It.ttf', index=0, name='Source Code Pro', style='italic', variant='normal', weight=400, stretch='normal', size='scalable')) = 11.05
2026-07-21 14:55:57 runnervm3jd5f matplotlib.font_manager[2874] DEBUG findfont: score(FontEntry(fname='/home/runner/micromamba/envs/trajan/fonts/SourceCodePro-ExtraLightIt.ttf', index=0, name='Source Code Pro', style='italic', variant='normal', weight=200, stretch='normal', size='scalable')) = 11.24
2026-07-21 14:55:57 runnervm3jd5f matplotlib.font_manager[2874] DEBUG findfont: score(FontEntry(fname='/home/runner/micromamba/envs/trajan/fonts/SourceCodePro-ExtraLightIt.ttf', index=0, name='Source Code Pro ExtraLight', style='italic', variant='normal', weight=400, stretch='normal', size='scalable')) = 11.05
2026-07-21 14:55:57 runnervm3jd5f matplotlib.font_manager[2874] DEBUG findfont: score(FontEntry(fname='/usr/share/fonts/truetype/lato/Lato-Medium.ttf', index=0, name='Lato', style='normal', variant='normal', weight=500, stretch='normal', size='scalable')) = 10.145
2026-07-21 14:55:57 runnervm3jd5f matplotlib.font_manager[2874] DEBUG findfont: score(FontEntry(fname='/usr/share/fonts/truetype/lato/Lato-Medium.ttf', index=0, name='Lato Medium', style='normal', variant='normal', weight=400, stretch='normal', size='scalable')) = 10.05
2026-07-21 14:55:57 runnervm3jd5f matplotlib.font_manager[2874] DEBUG findfont: score(FontEntry(fname='/usr/share/fonts/truetype/lato/Lato-BoldItalic.ttf', index=0, name='Lato', style='italic', variant='normal', weight=700, stretch='normal', size='scalable')) = 11.335
2026-07-21 14:55:57 runnervm3jd5f matplotlib.font_manager[2874] DEBUG findfont: score(FontEntry(fname='/home/runner/micromamba/envs/trajan/fonts/DejaVuSans.ttf', index=0, name='DejaVu Sans', style='normal', variant='normal', weight=400, stretch='normal', size='scalable')) = 10.05
2026-07-21 14:55:57 runnervm3jd5f matplotlib.font_manager[2874] DEBUG findfont: score(FontEntry(fname='/home/runner/micromamba/envs/trajan/fonts/UbuntuMono-B.ttf', index=0, name='Ubuntu Mono', style='normal', variant='normal', weight=700, stretch='normal', size='scalable')) = 10.335
2026-07-21 14:55:57 runnervm3jd5f matplotlib.font_manager[2874] DEBUG findfont: score(FontEntry(fname='/home/runner/micromamba/envs/trajan/fonts/SourceCodePro-LightIt.ttf', index=0, name='Source Code Pro', style='italic', variant='normal', weight=300, stretch='normal', size='scalable')) = 11.145
2026-07-21 14:55:57 runnervm3jd5f matplotlib.font_manager[2874] DEBUG findfont: score(FontEntry(fname='/home/runner/micromamba/envs/trajan/fonts/SourceCodePro-LightIt.ttf', index=0, name='Source Code Pro Light', style='italic', variant='normal', weight=400, stretch='normal', size='scalable')) = 11.05
2026-07-21 14:55:57 runnervm3jd5f matplotlib.font_manager[2874] DEBUG findfont: score(FontEntry(fname='/usr/share/fonts/truetype/liberation/LiberationSans-BoldItalic.ttf', index=0, name='Liberation Sans', style='italic', variant='normal', weight=700, stretch='normal', size='scalable')) = 11.335
2026-07-21 14:55:57 runnervm3jd5f matplotlib.font_manager[2874] DEBUG findfont: score(FontEntry(fname='/usr/share/fonts/truetype/liberation/LiberationSans-Regular.ttf', index=0, name='Liberation Sans', style='normal', variant='normal', weight=400, stretch='normal', size='scalable')) = 10.05
2026-07-21 14:55:57 runnervm3jd5f matplotlib.font_manager[2874] DEBUG findfont: score(FontEntry(fname='/usr/share/fonts/truetype/dejavu/DejaVuSansMono-Bold.ttf', index=0, name='DejaVu Sans Mono', style='normal', variant='normal', weight=700, stretch='normal', size='scalable')) = 10.335
2026-07-21 14:55:57 runnervm3jd5f matplotlib.font_manager[2874] DEBUG findfont: score(FontEntry(fname='/home/runner/micromamba/envs/trajan/fonts/SourceCodePro-BoldIt.ttf', index=0, name='Source Code Pro', style='italic', variant='normal', weight=700, stretch='normal', size='scalable')) = 11.335
2026-07-21 14:55:57 runnervm3jd5f matplotlib.font_manager[2874] DEBUG findfont: score(FontEntry(fname='/usr/share/fonts/truetype/lato/Lato-Bold.ttf', index=0, name='Lato', style='normal', variant='normal', weight=700, stretch='normal', size='scalable')) = 10.335
2026-07-21 14:55:57 runnervm3jd5f matplotlib.font_manager[2874] DEBUG findfont: score(FontEntry(fname='/usr/share/fonts/truetype/dejavu/DejaVuSansCondensed.ttf', index=0, name='DejaVu Sans', style='normal', variant='normal', weight=400, stretch='condensed', size='scalable')) = 10.25
2026-07-21 14:55:57 runnervm3jd5f matplotlib.font_manager[2874] DEBUG findfont: score(FontEntry(fname='/usr/share/fonts/truetype/dejavu/DejaVuSansCondensed.ttf', index=0, name='DejaVu Sans Condensed', style='normal', variant='normal', weight=380, stretch='condensed', size='scalable')) = 10.269
2026-07-21 14:55:57 runnervm3jd5f matplotlib.font_manager[2874] DEBUG findfont: score(FontEntry(fname='/usr/share/fonts/truetype/lato/Lato-MediumItalic.ttf', index=0, name='Lato', style='italic', variant='normal', weight=500, stretch='normal', size='scalable')) = 11.145
2026-07-21 14:55:57 runnervm3jd5f matplotlib.font_manager[2874] DEBUG findfont: score(FontEntry(fname='/usr/share/fonts/truetype/lato/Lato-MediumItalic.ttf', index=0, name='Lato Medium', style='italic', variant='normal', weight=400, stretch='normal', size='scalable')) = 11.05
2026-07-21 14:55:57 runnervm3jd5f matplotlib.font_manager[2874] DEBUG findfont: score(FontEntry(fname='/usr/share/fonts/truetype/liberation/LiberationSans-Bold.ttf', index=0, name='Liberation Sans', style='normal', variant='normal', weight=700, stretch='normal', size='scalable')) = 10.335
2026-07-21 14:55:57 runnervm3jd5f matplotlib.font_manager[2874] DEBUG findfont: score(FontEntry(fname='/usr/share/fonts/truetype/dejavu/DejaVuSerifCondensed-BoldItalic.ttf', index=0, name='DejaVu Serif', style='italic', variant='normal', weight=700, stretch='condensed', size='scalable')) = 11.535
2026-07-21 14:55:57 runnervm3jd5f matplotlib.font_manager[2874] DEBUG findfont: score(FontEntry(fname='/usr/share/fonts/truetype/dejavu/DejaVuSerifCondensed-BoldItalic.ttf', index=0, name='DejaVu Serif Condensed', style='italic', variant='normal', weight=700, stretch='condensed', size='scalable')) = 11.535
2026-07-21 14:55:57 runnervm3jd5f matplotlib.font_manager[2874] DEBUG findfont: score(FontEntry(fname='/home/runner/micromamba/envs/trajan/fonts/Ubuntu-R.ttf', index=0, name='Ubuntu', style='normal', variant='normal', weight=400, stretch='normal', size='scalable')) = 10.05
2026-07-21 14:55:57 runnervm3jd5f matplotlib.font_manager[2874] DEBUG findfont: score(FontEntry(fname='/usr/share/fonts/truetype/lato/Lato-Light.ttf', index=0, name='Lato', style='normal', variant='normal', weight=300, stretch='normal', size='scalable')) = 10.145
2026-07-21 14:55:57 runnervm3jd5f matplotlib.font_manager[2874] DEBUG findfont: score(FontEntry(fname='/usr/share/fonts/truetype/lato/Lato-Light.ttf', index=0, name='Lato Light', style='normal', variant='normal', weight=400, stretch='normal', size='scalable')) = 10.05
2026-07-21 14:55:57 runnervm3jd5f matplotlib.font_manager[2874] DEBUG findfont: score(FontEntry(fname='/usr/share/fonts/truetype/liberation/LiberationSerif-BoldItalic.ttf', index=0, name='Liberation Serif', style='italic', variant='normal', weight=700, stretch='normal', size='scalable')) = 11.335
2026-07-21 14:55:57 runnervm3jd5f matplotlib.font_manager[2874] DEBUG findfont: score(FontEntry(fname='/home/runner/micromamba/envs/trajan/fonts/Ubuntu-Th.ttf', index=0, name='Ubuntu', style='normal', variant='normal', weight=250, stretch='normal', size='scalable')) = 10.1925
2026-07-21 14:55:57 runnervm3jd5f matplotlib.font_manager[2874] DEBUG findfont: score(FontEntry(fname='/home/runner/micromamba/envs/trajan/fonts/Ubuntu-Th.ttf', index=0, name='Ubuntu Thin', style='normal', variant='normal', weight=400, stretch='normal', size='scalable')) = 10.05
2026-07-21 14:55:57 runnervm3jd5f matplotlib.font_manager[2874] DEBUG findfont: score(FontEntry(fname='/home/runner/micromamba/envs/trajan/fonts/SourceCodePro-ExtraLight.ttf', index=0, name='Source Code Pro', style='normal', variant='normal', weight=200, stretch='normal', size='scalable')) = 10.24
2026-07-21 14:55:57 runnervm3jd5f matplotlib.font_manager[2874] DEBUG findfont: score(FontEntry(fname='/home/runner/micromamba/envs/trajan/fonts/SourceCodePro-ExtraLight.ttf', index=0, name='Source Code Pro ExtraLight', style='normal', variant='normal', weight=400, stretch='normal', size='scalable')) = 10.05
2026-07-21 14:55:57 runnervm3jd5f matplotlib.font_manager[2874] DEBUG findfont: score(FontEntry(fname='/usr/share/fonts/truetype/lato/Lato-Thin.ttf', index=0, name='Lato', style='normal', variant='normal', weight=275, stretch='normal', size='scalable')) = 10.16875
2026-07-21 14:55:57 runnervm3jd5f matplotlib.font_manager[2874] DEBUG findfont: score(FontEntry(fname='/usr/share/fonts/truetype/lato/Lato-Thin.ttf', index=0, name='Lato Thin', style='normal', variant='normal', weight=400, stretch='normal', size='scalable')) = 10.05
2026-07-21 14:55:57 runnervm3jd5f matplotlib.font_manager[2874] DEBUG findfont: score(FontEntry(fname='/usr/share/fonts/truetype/liberation/LiberationSerif-Bold.ttf', index=0, name='Liberation Serif', style='normal', variant='normal', weight=700, stretch='normal', size='scalable')) = 10.335
2026-07-21 14:55:57 runnervm3jd5f matplotlib.font_manager[2874] DEBUG findfont: score(FontEntry(fname='/home/runner/micromamba/envs/trajan/fonts/Inconsolata-Regular.ttf', index=0, name='Inconsolata', style='normal', variant='normal', weight=400, stretch='normal', size='scalable')) = 10.05
2026-07-21 14:55:57 runnervm3jd5f matplotlib.font_manager[2874] DEBUG findfont: score(FontEntry(fname='/home/runner/micromamba/envs/trajan/fonts/Ubuntu-C.ttf', index=0, name='Ubuntu Condensed', style='normal', variant='normal', weight=400, stretch='condensed', size='scalable')) = 10.25
2026-07-21 14:55:57 runnervm3jd5f matplotlib.font_manager[2874] DEBUG findfont: score(FontEntry(fname='/usr/share/fonts/truetype/dejavu/DejaVuSansCondensed-Bold.ttf', index=0, name='DejaVu Sans', style='normal', variant='normal', weight=700, stretch='condensed', size='scalable')) = 10.535
2026-07-21 14:55:57 runnervm3jd5f matplotlib.font_manager[2874] DEBUG findfont: score(FontEntry(fname='/usr/share/fonts/truetype/dejavu/DejaVuSansCondensed-Bold.ttf', index=0, name='DejaVu Sans Condensed', style='normal', variant='normal', weight=700, stretch='condensed', size='scalable')) = 10.535
2026-07-21 14:55:57 runnervm3jd5f matplotlib.font_manager[2874] DEBUG findfont: score(FontEntry(fname='/usr/share/fonts/truetype/liberation/LiberationMono-Bold.ttf', index=0, name='Liberation Mono', style='normal', variant='normal', weight=700, stretch='normal', size='scalable')) = 10.335
2026-07-21 14:55:57 runnervm3jd5f matplotlib.font_manager[2874] DEBUG findfont: score(FontEntry(fname='/home/runner/micromamba/envs/trajan/fonts/SourceCodePro-Black.ttf', index=0, name='Source Code Pro', style='normal', variant='normal', weight=900, stretch='normal', size='scalable')) = 10.525
2026-07-21 14:55:57 runnervm3jd5f matplotlib.font_manager[2874] DEBUG findfont: score(FontEntry(fname='/home/runner/micromamba/envs/trajan/fonts/SourceCodePro-Black.ttf', index=0, name='Source Code Pro Black', style='normal', variant='normal', weight=400, stretch='normal', size='scalable')) = 10.05
2026-07-21 14:55:57 runnervm3jd5f matplotlib.font_manager[2874] DEBUG findfont: score(FontEntry(fname='/home/runner/micromamba/envs/trajan/fonts/SourceCodePro-BlackIt.ttf', index=0, name='Source Code Pro', style='italic', variant='normal', weight=900, stretch='normal', size='scalable')) = 11.525
2026-07-21 14:55:57 runnervm3jd5f matplotlib.font_manager[2874] DEBUG findfont: score(FontEntry(fname='/home/runner/micromamba/envs/trajan/fonts/SourceCodePro-BlackIt.ttf', index=0, name='Source Code Pro Black', style='italic', variant='normal', weight=400, stretch='normal', size='scalable')) = 11.05
2026-07-21 14:55:57 runnervm3jd5f matplotlib.font_manager[2874] DEBUG findfont: score(FontEntry(fname='/home/runner/micromamba/envs/trajan/fonts/Ubuntu-LI.ttf', index=0, name='Ubuntu', style='italic', variant='normal', weight=300, stretch='normal', size='scalable')) = 11.145
2026-07-21 14:55:57 runnervm3jd5f matplotlib.font_manager[2874] DEBUG findfont: score(FontEntry(fname='/home/runner/micromamba/envs/trajan/fonts/Ubuntu-LI.ttf', index=0, name='Ubuntu Light', style='italic', variant='normal', weight=400, stretch='normal', size='scalable')) = 11.05
2026-07-21 14:55:57 runnervm3jd5f matplotlib.font_manager[2874] DEBUG findfont: score(FontEntry(fname='/usr/share/fonts/truetype/liberation/LiberationMono-Regular.ttf', index=0, name='Liberation Mono', style='normal', variant='normal', weight=400, stretch='normal', size='scalable')) = 10.05
2026-07-21 14:55:57 runnervm3jd5f matplotlib.font_manager[2874] DEBUG findfont: score(FontEntry(fname='/home/runner/micromamba/envs/trajan/fonts/UbuntuMono-RI.ttf', index=0, name='Ubuntu Mono', style='italic', variant='normal', weight=400, stretch='normal', size='scalable')) = 11.05
2026-07-21 14:55:57 runnervm3jd5f matplotlib.font_manager[2874] DEBUG findfont: score(FontEntry(fname='/usr/share/fonts/truetype/lato/Lato-Heavy.ttf', index=0, name='Lato', style='normal', variant='normal', weight=800, stretch='normal', size='scalable')) = 10.43
2026-07-21 14:55:57 runnervm3jd5f matplotlib.font_manager[2874] DEBUG findfont: score(FontEntry(fname='/usr/share/fonts/truetype/lato/Lato-Heavy.ttf', index=0, name='Lato Heavy', style='normal', variant='normal', weight=400, stretch='normal', size='scalable')) = 10.05
2026-07-21 14:55:57 runnervm3jd5f matplotlib.font_manager[2874] DEBUG findfont: score(FontEntry(fname='/usr/share/fonts/truetype/lato/Lato-HairlineItalic.ttf', index=0, name='Lato', style='italic', variant='normal', weight=250, stretch='normal', size='scalable')) = 11.1925
2026-07-21 14:55:57 runnervm3jd5f matplotlib.font_manager[2874] DEBUG findfont: score(FontEntry(fname='/usr/share/fonts/truetype/lato/Lato-HairlineItalic.ttf', index=0, name='Lato Hairline', style='italic', variant='normal', weight=400, stretch='normal', size='scalable')) = 11.05
2026-07-21 14:55:57 runnervm3jd5f matplotlib.font_manager[2874] DEBUG findfont: score(FontEntry(fname='/usr/share/fonts/truetype/dejavu/DejaVuSerifCondensed-Bold.ttf', index=0, name='DejaVu Serif', style='normal', variant='normal', weight=700, stretch='condensed', size='scalable')) = 10.535
2026-07-21 14:55:57 runnervm3jd5f matplotlib.font_manager[2874] DEBUG findfont: score(FontEntry(fname='/usr/share/fonts/truetype/dejavu/DejaVuSerifCondensed-Bold.ttf', index=0, name='DejaVu Serif Condensed', style='normal', variant='normal', weight=700, stretch='condensed', size='scalable')) = 10.535
2026-07-21 14:55:57 runnervm3jd5f matplotlib.font_manager[2874] DEBUG findfont: score(FontEntry(fname='/usr/share/fonts/truetype/dejavu/DejaVuSansCondensed-Oblique.ttf', index=0, name='DejaVu Sans', style='oblique', variant='normal', weight=400, stretch='condensed', size='scalable')) = 11.25
2026-07-21 14:55:57 runnervm3jd5f matplotlib.font_manager[2874] DEBUG findfont: score(FontEntry(fname='/usr/share/fonts/truetype/dejavu/DejaVuSansCondensed-Oblique.ttf', index=0, name='DejaVu Sans Condensed', style='oblique', variant='normal', weight=400, stretch='condensed', size='scalable')) = 11.25
2026-07-21 14:55:57 runnervm3jd5f matplotlib.font_manager[2874] DEBUG findfont: score(FontEntry(fname='/usr/share/fonts/truetype/lato/Lato-SemiboldItalic.ttf', index=0, name='Lato', style='italic', variant='normal', weight=600, stretch='normal', size='scalable')) = 11.24
2026-07-21 14:55:57 runnervm3jd5f matplotlib.font_manager[2874] DEBUG findfont: score(FontEntry(fname='/usr/share/fonts/truetype/lato/Lato-SemiboldItalic.ttf', index=0, name='Lato Semibold', style='italic', variant='normal', weight=400, stretch='normal', size='scalable')) = 11.05
2026-07-21 14:55:57 runnervm3jd5f matplotlib.font_manager[2874] DEBUG findfont: score(FontEntry(fname='/usr/share/fonts/truetype/lato/Lato-Semibold.ttf', index=0, name='Lato', style='normal', variant='normal', weight=600, stretch='normal', size='scalable')) = 10.24
2026-07-21 14:55:57 runnervm3jd5f matplotlib.font_manager[2874] DEBUG findfont: score(FontEntry(fname='/usr/share/fonts/truetype/lato/Lato-Semibold.ttf', index=0, name='Lato Semibold', style='normal', variant='normal', weight=400, stretch='normal', size='scalable')) = 10.05
2026-07-21 14:55:57 runnervm3jd5f matplotlib.font_manager[2874] DEBUG findfont: score(FontEntry(fname='/home/runner/micromamba/envs/trajan/fonts/Inconsolata-Bold.ttf', index=0, name='Inconsolata', style='normal', variant='normal', weight=700, stretch='normal', size='scalable')) = 10.335
2026-07-21 14:55:57 runnervm3jd5f matplotlib.font_manager[2874] DEBUG findfont: score(FontEntry(fname='/usr/share/fonts/truetype/dejavu/DejaVuSans-ExtraLight.ttf', index=0, name='DejaVu Sans', style='normal', variant='normal', weight=200, stretch='normal', size='scalable')) = 10.24
2026-07-21 14:55:57 runnervm3jd5f matplotlib.font_manager[2874] DEBUG findfont: score(FontEntry(fname='/usr/share/fonts/truetype/dejavu/DejaVuSans-ExtraLight.ttf', index=0, name='DejaVu Sans Light', style='normal', variant='normal', weight=200, stretch='normal', size='scalable')) = 10.24
2026-07-21 14:55:57 runnervm3jd5f matplotlib.font_manager[2874] DEBUG findfont: score(FontEntry(fname='/home/runner/micromamba/envs/trajan/fonts/Ubuntu-BI.ttf', index=0, name='Ubuntu', style='italic', variant='normal', weight=700, stretch='normal', size='scalable')) = 11.335
2026-07-21 14:55:57 runnervm3jd5f matplotlib.font_manager[2874] DEBUG findfont: score(FontEntry(fname='/usr/share/fonts/truetype/dejavu/DejaVuSans-BoldOblique.ttf', index=0, name='DejaVu Sans', style='oblique', variant='normal', weight=700, stretch='normal', size='scalable')) = 11.335
2026-07-21 14:55:57 runnervm3jd5f matplotlib.font_manager[2874] DEBUG findfont: score(FontEntry(fname='/home/runner/micromamba/envs/trajan/fonts/Ubuntu-RI.ttf', index=0, name='Ubuntu', style='italic', variant='normal', weight=400, stretch='normal', size='scalable')) = 11.05
2026-07-21 14:55:57 runnervm3jd5f matplotlib.font_manager[2874] DEBUG findfont: score(FontEntry(fname='/usr/share/fonts/truetype/dejavu/DejaVuSerif-Italic.ttf', index=0, name='DejaVu Serif', style='italic', variant='normal', weight=400, stretch='normal', size='scalable')) = 11.05
2026-07-21 14:55:57 runnervm3jd5f matplotlib.font_manager[2874] DEBUG findfont: score(FontEntry(fname='/home/runner/micromamba/envs/trajan/fonts/SourceCodePro-Medium.ttf', index=0, name='Source Code Pro', style='normal', variant='normal', weight=500, stretch='normal', size='scalable')) = 10.145
2026-07-21 14:55:57 runnervm3jd5f matplotlib.font_manager[2874] DEBUG findfont: score(FontEntry(fname='/home/runner/micromamba/envs/trajan/fonts/SourceCodePro-Medium.ttf', index=0, name='Source Code Pro Medium', style='normal', variant='normal', weight=400, stretch='normal', size='scalable')) = 10.05
2026-07-21 14:55:57 runnervm3jd5f matplotlib.font_manager[2874] DEBUG findfont: score(FontEntry(fname='/usr/share/fonts/truetype/lato/Lato-HeavyItalic.ttf', index=0, name='Lato', style='italic', variant='normal', weight=800, stretch='normal', size='scalable')) = 11.43
2026-07-21 14:55:57 runnervm3jd5f matplotlib.font_manager[2874] DEBUG findfont: score(FontEntry(fname='/usr/share/fonts/truetype/lato/Lato-HeavyItalic.ttf', index=0, name='Lato Heavy', style='italic', variant='normal', weight=400, stretch='normal', size='scalable')) = 11.05
2026-07-21 14:55:57 runnervm3jd5f matplotlib.font_manager[2874] DEBUG findfont: score(FontEntry(fname='/usr/share/fonts/truetype/dejavu/DejaVuSans-Oblique.ttf', index=0, name='DejaVu Sans', style='oblique', variant='normal', weight=400, stretch='normal', size='scalable')) = 11.05
2026-07-21 14:55:57 runnervm3jd5f matplotlib.font_manager[2874] DEBUG findfont: score(FontEntry(fname='/home/runner/micromamba/envs/trajan/fonts/Ubuntu-M.ttf', index=0, name='Ubuntu', style='normal', variant='normal', weight=500, stretch='normal', size='scalable')) = 10.145
2026-07-21 14:55:57 runnervm3jd5f matplotlib.font_manager[2874] DEBUG findfont: score(FontEntry(fname='/home/runner/micromamba/envs/trajan/fonts/Ubuntu-M.ttf', index=0, name='Ubuntu Light', style='normal', variant='normal', weight=700, stretch='normal', size='scalable')) = 10.335
2026-07-21 14:55:57 runnervm3jd5f matplotlib.font_manager[2874] DEBUG findfont: score(FontEntry(fname='/usr/share/fonts/truetype/liberation/LiberationMono-BoldItalic.ttf', index=0, name='Liberation Mono', style='italic', variant='normal', weight=700, stretch='normal', size='scalable')) = 11.335
2026-07-21 14:55:57 runnervm3jd5f matplotlib.font_manager[2874] DEBUG findfont: score(FontEntry(fname='/usr/share/fonts/truetype/dejavu/DejaVuSansMono.ttf', index=0, name='DejaVu Sans Mono', style='normal', variant='normal', weight=400, stretch='normal', size='scalable')) = 10.05
2026-07-21 14:55:57 runnervm3jd5f matplotlib.font_manager[2874] DEBUG findfont: score(FontEntry(fname='/usr/share/fonts/truetype/dejavu/DejaVuMathTeXGyre.ttf', index=0, name='DejaVu Math TeX Gyre', style='normal', variant='normal', weight=400, stretch='normal', size='scalable')) = 10.05
2026-07-21 14:55:57 runnervm3jd5f matplotlib.font_manager[2874] DEBUG findfont: score(FontEntry(fname='/usr/share/fonts/truetype/dejavu/DejaVuSansMono-Oblique.ttf', index=0, name='DejaVu Sans Mono', style='oblique', variant='normal', weight=400, stretch='normal', size='scalable')) = 11.05
2026-07-21 14:55:57 runnervm3jd5f matplotlib.font_manager[2874] DEBUG findfont: score(FontEntry(fname='/home/runner/micromamba/envs/trajan/fonts/Ubuntu-L.ttf', index=0, name='Ubuntu', style='normal', variant='normal', weight=300, stretch='normal', size='scalable')) = 10.145
2026-07-21 14:55:57 runnervm3jd5f matplotlib.font_manager[2874] DEBUG findfont: score(FontEntry(fname='/home/runner/micromamba/envs/trajan/fonts/Ubuntu-L.ttf', index=0, name='Ubuntu Light', style='normal', variant='normal', weight=400, stretch='normal', size='scalable')) = 10.05
2026-07-21 14:55:57 runnervm3jd5f matplotlib.font_manager[2874] DEBUG findfont: score(FontEntry(fname='/home/runner/micromamba/envs/trajan/fonts/SourceCodePro-MediumIt.ttf', index=0, name='Source Code Pro', style='italic', variant='normal', weight=500, stretch='normal', size='scalable')) = 11.145
2026-07-21 14:55:57 runnervm3jd5f matplotlib.font_manager[2874] DEBUG findfont: score(FontEntry(fname='/home/runner/micromamba/envs/trajan/fonts/SourceCodePro-MediumIt.ttf', index=0, name='Source Code Pro Medium', style='italic', variant='normal', weight=400, stretch='normal', size='scalable')) = 11.05
2026-07-21 14:55:57 runnervm3jd5f matplotlib.font_manager[2874] DEBUG findfont: score(FontEntry(fname='/home/runner/micromamba/envs/trajan/fonts/SourceCodePro-Regular.ttf', index=0, name='Source Code Pro', style='normal', variant='normal', weight=400, stretch='normal', size='scalable')) = 10.05
2026-07-21 14:55:57 runnervm3jd5f matplotlib.font_manager[2874] DEBUG findfont: score(FontEntry(fname='/home/runner/micromamba/envs/trajan/fonts/SourceCodePro-SemiboldIt.ttf', index=0, name='Source Code Pro', style='italic', variant='normal', weight=600, stretch='normal', size='scalable')) = 11.24
2026-07-21 14:55:57 runnervm3jd5f matplotlib.font_manager[2874] DEBUG findfont: score(FontEntry(fname='/home/runner/micromamba/envs/trajan/fonts/SourceCodePro-SemiboldIt.ttf', index=0, name='Source Code Pro Semibold', style='italic', variant='normal', weight=400, stretch='normal', size='scalable')) = 11.05
2026-07-21 14:55:57 runnervm3jd5f matplotlib.font_manager[2874] DEBUG findfont: score(FontEntry(fname='/usr/share/fonts/truetype/dejavu/DejaVuSerif.ttf', index=0, name='DejaVu Serif', style='normal', variant='normal', weight=400, stretch='normal', size='scalable')) = 10.05
2026-07-21 14:55:57 runnervm3jd5f matplotlib.font_manager[2874] DEBUG findfont: score(FontEntry(fname='/usr/share/fonts/truetype/dejavu/DejaVuSerif-Bold.ttf', index=0, name='DejaVu Serif', style='normal', variant='normal', weight=700, stretch='normal', size='scalable')) = 10.335
2026-07-21 14:55:57 runnervm3jd5f matplotlib.font_manager[2874] DEBUG findfont: score(FontEntry(fname='/usr/share/fonts/truetype/liberation/LiberationSerif-Italic.ttf', index=0, name='Liberation Serif', style='italic', variant='normal', weight=400, stretch='normal', size='scalable')) = 11.05
2026-07-21 14:55:57 runnervm3jd5f matplotlib.font_manager[2874] DEBUG findfont: score(FontEntry(fname='/usr/share/fonts/truetype/dejavu/DejaVuSansMono-BoldOblique.ttf', index=0, name='DejaVu Sans Mono', style='oblique', variant='normal', weight=700, stretch='normal', size='scalable')) = 11.335
2026-07-21 14:55:57 runnervm3jd5f matplotlib.font_manager[2874] DEBUG findfont: score(FontEntry(fname='/home/runner/micromamba/envs/trajan/fonts/SourceCodePro-Light.ttf', index=0, name='Source Code Pro', style='normal', variant='normal', weight=300, stretch='normal', size='scalable')) = 10.145
2026-07-21 14:55:57 runnervm3jd5f matplotlib.font_manager[2874] DEBUG findfont: score(FontEntry(fname='/home/runner/micromamba/envs/trajan/fonts/SourceCodePro-Light.ttf', index=0, name='Source Code Pro Light', style='normal', variant='normal', weight=400, stretch='normal', size='scalable')) = 10.05
2026-07-21 14:55:57 runnervm3jd5f matplotlib.font_manager[2874] DEBUG findfont: score(FontEntry(fname='/usr/share/fonts/truetype/liberation/LiberationMono-Italic.ttf', index=0, name='Liberation Mono', style='italic', variant='normal', weight=400, stretch='normal', size='scalable')) = 11.05
2026-07-21 14:55:57 runnervm3jd5f matplotlib.font_manager[2874] DEBUG findfont: Matching STIXSizeFourSym:style=normal:variant=normal:weight=normal:stretch=normal:size=10.0 to STIXSizeFourSym ('/home/runner/micromamba/envs/trajan/lib/python3.14/site-packages/matplotlib/mpl-data/fonts/ttf/STIXSizFourSymReg.ttf') with score of 0.050000.
2026-07-21 14:55:57 runnervm3jd5f matplotlib.font_manager[2874] DEBUG findfont: Matching STIXSizeFiveSym:style=normal:variant=normal:weight=normal:stretch=normal:size=10.0.
2026-07-21 14:55:57 runnervm3jd5f matplotlib.font_manager[2874] DEBUG findfont: score(FontEntry(fname='/home/runner/micromamba/envs/trajan/lib/python3.14/site-packages/matplotlib/mpl-data/fonts/ttf/cmmi10.ttf', index=0, name='cmmi10', style='normal', variant='normal', weight=400, stretch='normal', size='scalable')) = 10.05
2026-07-21 14:55:57 runnervm3jd5f matplotlib.font_manager[2874] DEBUG findfont: score(FontEntry(fname='/home/runner/micromamba/envs/trajan/lib/python3.14/site-packages/matplotlib/mpl-data/fonts/ttf/DejaVuSerif-Bold.ttf', index=0, name='DejaVu Serif', style='normal', variant='normal', weight=700, stretch='normal', size='scalable')) = 10.335
2026-07-21 14:55:57 runnervm3jd5f matplotlib.font_manager[2874] DEBUG findfont: score(FontEntry(fname='/home/runner/micromamba/envs/trajan/lib/python3.14/site-packages/matplotlib/mpl-data/fonts/ttf/DejaVuSans-Oblique.ttf', index=0, name='DejaVu Sans', style='oblique', variant='normal', weight=400, stretch='normal', size='scalable')) = 11.05
2026-07-21 14:55:57 runnervm3jd5f matplotlib.font_manager[2874] DEBUG findfont: score(FontEntry(fname='/home/runner/micromamba/envs/trajan/lib/python3.14/site-packages/matplotlib/mpl-data/fonts/ttf/STIXSizThreeSymReg.ttf', index=0, name='STIXSizeThreeSym', style='normal', variant='normal', weight=400, stretch='normal', size='scalable')) = 10.05
2026-07-21 14:55:57 runnervm3jd5f matplotlib.font_manager[2874] DEBUG findfont: score(FontEntry(fname='/home/runner/micromamba/envs/trajan/lib/python3.14/site-packages/matplotlib/mpl-data/fonts/ttf/STIXNonUniBolIta.ttf', index=0, name='STIXNonUnicode', style='italic', variant='normal', weight=700, stretch='normal', size='scalable')) = 11.335
2026-07-21 14:55:57 runnervm3jd5f matplotlib.font_manager[2874] DEBUG findfont: score(FontEntry(fname='/home/runner/micromamba/envs/trajan/lib/python3.14/site-packages/matplotlib/mpl-data/fonts/ttf/DejaVuSerifDisplay.ttf', index=0, name='DejaVu Serif Display', style='normal', variant='normal', weight=400, stretch='normal', size='scalable')) = 10.05
2026-07-21 14:55:57 runnervm3jd5f matplotlib.font_manager[2874] DEBUG findfont: score(FontEntry(fname='/home/runner/micromamba/envs/trajan/lib/python3.14/site-packages/matplotlib/mpl-data/fonts/ttf/cmss10.ttf', index=0, name='cmss10', style='normal', variant='normal', weight=400, stretch='normal', size='scalable')) = 10.05
2026-07-21 14:55:57 runnervm3jd5f matplotlib.font_manager[2874] DEBUG findfont: score(FontEntry(fname='/home/runner/micromamba/envs/trajan/lib/python3.14/site-packages/matplotlib/mpl-data/fonts/ttf/STIXGeneralBolIta.ttf', index=0, name='STIXGeneral', style='italic', variant='normal', weight=700, stretch='normal', size='scalable')) = 11.335
2026-07-21 14:55:57 runnervm3jd5f matplotlib.font_manager[2874] DEBUG findfont: score(FontEntry(fname='/home/runner/micromamba/envs/trajan/lib/python3.14/site-packages/matplotlib/mpl-data/fonts/ttf/cmtt10.ttf', index=0, name='cmtt10', style='normal', variant='normal', weight=400, stretch='normal', size='scalable')) = 10.05
2026-07-21 14:55:57 runnervm3jd5f matplotlib.font_manager[2874] DEBUG findfont: score(FontEntry(fname='/home/runner/micromamba/envs/trajan/lib/python3.14/site-packages/matplotlib/mpl-data/fonts/ttf/cmsy10.ttf', index=0, name='cmsy10', style='normal', variant='normal', weight=400, stretch='normal', size='scalable')) = 10.05
2026-07-21 14:55:57 runnervm3jd5f matplotlib.font_manager[2874] DEBUG findfont: score(FontEntry(fname='/home/runner/micromamba/envs/trajan/lib/python3.14/site-packages/matplotlib/mpl-data/fonts/ttf/DejaVuSansMono-Oblique.ttf', index=0, name='DejaVu Sans Mono', style='oblique', variant='normal', weight=400, stretch='normal', size='scalable')) = 11.05
2026-07-21 14:55:57 runnervm3jd5f matplotlib.font_manager[2874] DEBUG findfont: score(FontEntry(fname='/home/runner/micromamba/envs/trajan/lib/python3.14/site-packages/matplotlib/mpl-data/fonts/ttf/STIXNonUniIta.ttf', index=0, name='STIXNonUnicode', style='italic', variant='normal', weight=400, stretch='normal', size='scalable')) = 11.05
2026-07-21 14:55:57 runnervm3jd5f matplotlib.font_manager[2874] DEBUG findfont: score(FontEntry(fname='/home/runner/micromamba/envs/trajan/lib/python3.14/site-packages/matplotlib/mpl-data/fonts/ttf/STIXGeneral.ttf', index=0, name='STIXGeneral', style='normal', variant='normal', weight=400, stretch='normal', size='scalable')) = 10.05
2026-07-21 14:55:57 runnervm3jd5f matplotlib.font_manager[2874] DEBUG findfont: score(FontEntry(fname='/home/runner/micromamba/envs/trajan/lib/python3.14/site-packages/matplotlib/mpl-data/fonts/ttf/cmti10.ttf', index=0, name='cmti10', style='normal', variant='normal', weight=400, stretch='normal', size='scalable')) = 10.05
2026-07-21 14:55:57 runnervm3jd5f matplotlib.font_manager[2874] DEBUG findfont: score(FontEntry(fname='/home/runner/micromamba/envs/trajan/lib/python3.14/site-packages/matplotlib/mpl-data/fonts/ttf/DejaVuSansMono-BoldOblique.ttf', index=0, name='DejaVu Sans Mono', style='oblique', variant='normal', weight=700, stretch='normal', size='scalable')) = 11.335
2026-07-21 14:55:57 runnervm3jd5f matplotlib.font_manager[2874] DEBUG findfont: score(FontEntry(fname='/home/runner/micromamba/envs/trajan/lib/python3.14/site-packages/matplotlib/mpl-data/fonts/ttf/DejaVuSerif.ttf', index=0, name='DejaVu Serif', style='normal', variant='normal', weight=400, stretch='normal', size='scalable')) = 10.05
2026-07-21 14:55:57 runnervm3jd5f matplotlib.font_manager[2874] DEBUG findfont: score(FontEntry(fname='/home/runner/micromamba/envs/trajan/lib/python3.14/site-packages/matplotlib/mpl-data/fonts/ttf/LastResortHE-Regular.ttf', index=0, name='Last Resort High-Efficiency', style='normal', variant='normal', weight=400, stretch='normal', size='scalable')) = 10.05
2026-07-21 14:55:57 runnervm3jd5f matplotlib.font_manager[2874] DEBUG findfont: score(FontEntry(fname='/home/runner/micromamba/envs/trajan/lib/python3.14/site-packages/matplotlib/mpl-data/fonts/ttf/cmex10.ttf', index=0, name='cmex10', style='normal', variant='normal', weight=400, stretch='normal', size='scalable')) = 10.05
2026-07-21 14:55:57 runnervm3jd5f matplotlib.font_manager[2874] DEBUG findfont: score(FontEntry(fname='/home/runner/micromamba/envs/trajan/lib/python3.14/site-packages/matplotlib/mpl-data/fonts/ttf/STIXSizFiveSymReg.ttf', index=0, name='STIXSizeFiveSym', style='normal', variant='normal', weight=400, stretch='normal', size='scalable')) = 0.05
2026-07-21 14:55:57 runnervm3jd5f matplotlib.font_manager[2874] DEBUG findfont: score(FontEntry(fname='/home/runner/micromamba/envs/trajan/lib/python3.14/site-packages/matplotlib/mpl-data/fonts/ttf/STIXNonUniBol.ttf', index=0, name='STIXNonUnicode', style='normal', variant='normal', weight=700, stretch='normal', size='scalable')) = 10.335
2026-07-21 14:55:57 runnervm3jd5f matplotlib.font_manager[2874] DEBUG findfont: score(FontEntry(fname='/home/runner/micromamba/envs/trajan/lib/python3.14/site-packages/matplotlib/mpl-data/fonts/ttf/DejaVuSansDisplay.ttf', index=0, name='DejaVu Sans Display', style='normal', variant='normal', weight=400, stretch='normal', size='scalable')) = 10.05
2026-07-21 14:55:57 runnervm3jd5f matplotlib.font_manager[2874] DEBUG findfont: score(FontEntry(fname='/home/runner/micromamba/envs/trajan/lib/python3.14/site-packages/matplotlib/mpl-data/fonts/ttf/DejaVuSansMono.ttf', index=0, name='DejaVu Sans Mono', style='normal', variant='normal', weight=400, stretch='normal', size='scalable')) = 10.05
2026-07-21 14:55:57 runnervm3jd5f matplotlib.font_manager[2874] DEBUG findfont: score(FontEntry(fname='/home/runner/micromamba/envs/trajan/lib/python3.14/site-packages/matplotlib/mpl-data/fonts/ttf/cmb10.ttf', index=0, name='cmb10', style='normal', variant='normal', weight=400, stretch='normal', size='scalable')) = 10.05
2026-07-21 14:55:57 runnervm3jd5f matplotlib.font_manager[2874] DEBUG findfont: score(FontEntry(fname='/home/runner/micromamba/envs/trajan/lib/python3.14/site-packages/matplotlib/mpl-data/fonts/ttf/STIXSizTwoSymReg.ttf', index=0, name='STIXSizeTwoSym', style='normal', variant='normal', weight=400, stretch='normal', size='scalable')) = 10.05
2026-07-21 14:55:57 runnervm3jd5f matplotlib.font_manager[2874] DEBUG findfont: score(FontEntry(fname='/home/runner/micromamba/envs/trajan/lib/python3.14/site-packages/matplotlib/mpl-data/fonts/ttf/DejaVuSans.ttf', index=0, name='DejaVu Sans', style='normal', variant='normal', weight=400, stretch='normal', size='scalable')) = 10.05
2026-07-21 14:55:57 runnervm3jd5f matplotlib.font_manager[2874] DEBUG findfont: score(FontEntry(fname='/home/runner/micromamba/envs/trajan/lib/python3.14/site-packages/matplotlib/mpl-data/fonts/ttf/STIXNonUni.ttf', index=0, name='STIXNonUnicode', style='normal', variant='normal', weight=400, stretch='normal', size='scalable')) = 10.05
2026-07-21 14:55:57 runnervm3jd5f matplotlib.font_manager[2874] DEBUG findfont: score(FontEntry(fname='/home/runner/micromamba/envs/trajan/lib/python3.14/site-packages/matplotlib/mpl-data/fonts/ttf/STIXGeneralItalic.ttf', index=0, name='STIXGeneral', style='italic', variant='normal', weight=400, stretch='normal', size='scalable')) = 11.05
2026-07-21 14:55:57 runnervm3jd5f matplotlib.font_manager[2874] DEBUG findfont: score(FontEntry(fname='/home/runner/micromamba/envs/trajan/lib/python3.14/site-packages/matplotlib/mpl-data/fonts/ttf/STIXSizOneSymBol.ttf', index=0, name='STIXSizeOneSym', style='normal', variant='normal', weight=700, stretch='normal', size='scalable')) = 10.335
2026-07-21 14:55:57 runnervm3jd5f matplotlib.font_manager[2874] DEBUG findfont: score(FontEntry(fname='/home/runner/micromamba/envs/trajan/lib/python3.14/site-packages/matplotlib/mpl-data/fonts/ttf/DejaVuSansMono-Bold.ttf', index=0, name='DejaVu Sans Mono', style='normal', variant='normal', weight=700, stretch='normal', size='scalable')) = 10.335
2026-07-21 14:55:57 runnervm3jd5f matplotlib.font_manager[2874] DEBUG findfont: score(FontEntry(fname='/home/runner/micromamba/envs/trajan/lib/python3.14/site-packages/matplotlib/mpl-data/fonts/ttf/STIXSizTwoSymBol.ttf', index=0, name='STIXSizeTwoSym', style='normal', variant='normal', weight=700, stretch='normal', size='scalable')) = 10.335
2026-07-21 14:55:57 runnervm3jd5f matplotlib.font_manager[2874] DEBUG findfont: score(FontEntry(fname='/home/runner/micromamba/envs/trajan/lib/python3.14/site-packages/matplotlib/mpl-data/fonts/ttf/STIXSizThreeSymBol.ttf', index=0, name='STIXSizeThreeSym', style='normal', variant='normal', weight=700, stretch='normal', size='scalable')) = 10.335
2026-07-21 14:55:57 runnervm3jd5f matplotlib.font_manager[2874] DEBUG findfont: score(FontEntry(fname='/home/runner/micromamba/envs/trajan/lib/python3.14/site-packages/matplotlib/mpl-data/fonts/ttf/DejaVuSerif-BoldItalic.ttf', index=0, name='DejaVu Serif', style='italic', variant='normal', weight=700, stretch='normal', size='scalable')) = 11.335
2026-07-21 14:55:57 runnervm3jd5f matplotlib.font_manager[2874] DEBUG findfont: score(FontEntry(fname='/home/runner/micromamba/envs/trajan/lib/python3.14/site-packages/matplotlib/mpl-data/fonts/ttf/DejaVuSerif-Italic.ttf', index=0, name='DejaVu Serif', style='italic', variant='normal', weight=400, stretch='normal', size='scalable')) = 11.05
2026-07-21 14:55:57 runnervm3jd5f matplotlib.font_manager[2874] DEBUG findfont: score(FontEntry(fname='/home/runner/micromamba/envs/trajan/lib/python3.14/site-packages/matplotlib/mpl-data/fonts/ttf/DejaVuSans-Bold.ttf', index=0, name='DejaVu Sans', style='normal', variant='normal', weight=700, stretch='normal', size='scalable')) = 10.335
2026-07-21 14:55:57 runnervm3jd5f matplotlib.font_manager[2874] DEBUG findfont: score(FontEntry(fname='/home/runner/micromamba/envs/trajan/lib/python3.14/site-packages/matplotlib/mpl-data/fonts/ttf/STIXSizFourSymBol.ttf', index=0, name='STIXSizeFourSym', style='normal', variant='normal', weight=700, stretch='normal', size='scalable')) = 10.335
2026-07-21 14:55:57 runnervm3jd5f matplotlib.font_manager[2874] DEBUG findfont: score(FontEntry(fname='/home/runner/micromamba/envs/trajan/lib/python3.14/site-packages/matplotlib/mpl-data/fonts/ttf/STIXSizOneSymReg.ttf', index=0, name='STIXSizeOneSym', style='normal', variant='normal', weight=400, stretch='normal', size='scalable')) = 10.05
2026-07-21 14:55:57 runnervm3jd5f matplotlib.font_manager[2874] DEBUG findfont: score(FontEntry(fname='/home/runner/micromamba/envs/trajan/lib/python3.14/site-packages/matplotlib/mpl-data/fonts/ttf/cmr10.ttf', index=0, name='cmr10', style='normal', variant='normal', weight=400, stretch='normal', size='scalable')) = 10.05
2026-07-21 14:55:57 runnervm3jd5f matplotlib.font_manager[2874] DEBUG findfont: score(FontEntry(fname='/home/runner/micromamba/envs/trajan/lib/python3.14/site-packages/matplotlib/mpl-data/fonts/ttf/STIXGeneralBol.ttf', index=0, name='STIXGeneral', style='normal', variant='normal', weight=700, stretch='normal', size='scalable')) = 10.335
2026-07-21 14:55:57 runnervm3jd5f matplotlib.font_manager[2874] DEBUG findfont: score(FontEntry(fname='/home/runner/micromamba/envs/trajan/lib/python3.14/site-packages/matplotlib/mpl-data/fonts/ttf/DejaVuSans-BoldOblique.ttf', index=0, name='DejaVu Sans', style='oblique', variant='normal', weight=700, stretch='normal', size='scalable')) = 11.335
2026-07-21 14:55:57 runnervm3jd5f matplotlib.font_manager[2874] DEBUG findfont: score(FontEntry(fname='/home/runner/micromamba/envs/trajan/lib/python3.14/site-packages/matplotlib/mpl-data/fonts/ttf/STIXSizFourSymReg.ttf', index=0, name='STIXSizeFourSym', style='normal', variant='normal', weight=400, stretch='normal', size='scalable')) = 10.05
2026-07-21 14:55:57 runnervm3jd5f matplotlib.font_manager[2874] DEBUG findfont: score(FontEntry(fname='/usr/share/fonts/truetype/lato/Lato-Black.ttf', index=0, name='Lato', style='normal', variant='normal', weight=900, stretch='normal', size='scalable')) = 10.525
2026-07-21 14:55:57 runnervm3jd5f matplotlib.font_manager[2874] DEBUG findfont: score(FontEntry(fname='/usr/share/fonts/truetype/lato/Lato-Black.ttf', index=0, name='Lato Black', style='normal', variant='normal', weight=400, stretch='normal', size='scalable')) = 10.05
2026-07-21 14:55:57 runnervm3jd5f matplotlib.font_manager[2874] DEBUG findfont: score(FontEntry(fname='/usr/share/fonts/truetype/liberation/LiberationSerif-Regular.ttf', index=0, name='Liberation Serif', style='normal', variant='normal', weight=400, stretch='normal', size='scalable')) = 10.05
2026-07-21 14:55:57 runnervm3jd5f matplotlib.font_manager[2874] DEBUG findfont: score(FontEntry(fname='/usr/share/fonts/truetype/dejavu/DejaVuSerifCondensed.ttf', index=0, name='DejaVu Serif', style='normal', variant='normal', weight=400, stretch='condensed', size='scalable')) = 10.25
2026-07-21 14:55:57 runnervm3jd5f matplotlib.font_manager[2874] DEBUG findfont: score(FontEntry(fname='/usr/share/fonts/truetype/dejavu/DejaVuSerifCondensed.ttf', index=0, name='DejaVu Serif Condensed', style='normal', variant='normal', weight=380, stretch='condensed', size='scalable')) = 10.269
2026-07-21 14:55:57 runnervm3jd5f matplotlib.font_manager[2874] DEBUG findfont: score(FontEntry(fname='/home/runner/micromamba/envs/trajan/fonts/UbuntuMono-BI.ttf', index=0, name='Ubuntu Mono', style='italic', variant='normal', weight=700, stretch='normal', size='scalable')) = 11.335
2026-07-21 14:55:57 runnervm3jd5f matplotlib.font_manager[2874] DEBUG findfont: score(FontEntry(fname='/usr/share/fonts/truetype/dejavu/DejaVuSans.ttf', index=0, name='DejaVu Sans', style='normal', variant='normal', weight=400, stretch='normal', size='scalable')) = 10.05
2026-07-21 14:55:57 runnervm3jd5f matplotlib.font_manager[2874] DEBUG findfont: score(FontEntry(fname='/usr/share/fonts/truetype/lato/Lato-Italic.ttf', index=0, name='Lato', style='italic', variant='normal', weight=400, stretch='normal', size='scalable')) = 11.05
2026-07-21 14:55:57 runnervm3jd5f matplotlib.font_manager[2874] DEBUG findfont: score(FontEntry(fname='/usr/share/fonts/truetype/liberation/LiberationSans-Italic.ttf', index=0, name='Liberation Sans', style='italic', variant='normal', weight=400, stretch='normal', size='scalable')) = 11.05
2026-07-21 14:55:57 runnervm3jd5f matplotlib.font_manager[2874] DEBUG findfont: score(FontEntry(fname='/home/runner/micromamba/envs/trajan/fonts/Ubuntu-B.ttf', index=0, name='Ubuntu', style='normal', variant='normal', weight=700, stretch='normal', size='scalable')) = 10.335
2026-07-21 14:55:57 runnervm3jd5f matplotlib.font_manager[2874] DEBUG findfont: score(FontEntry(fname='/home/runner/micromamba/envs/trajan/fonts/SourceCodePro-Semibold.ttf', index=0, name='Source Code Pro', style='normal', variant='normal', weight=600, stretch='normal', size='scalable')) = 10.24
2026-07-21 14:55:57 runnervm3jd5f matplotlib.font_manager[2874] DEBUG findfont: score(FontEntry(fname='/home/runner/micromamba/envs/trajan/fonts/SourceCodePro-Semibold.ttf', index=0, name='Source Code Pro Semibold', style='normal', variant='normal', weight=400, stretch='normal', size='scalable')) = 10.05
2026-07-21 14:55:57 runnervm3jd5f matplotlib.font_manager[2874] DEBUG findfont: score(FontEntry(fname='/home/runner/micromamba/envs/trajan/fonts/SourceCodePro-Bold.ttf', index=0, name='Source Code Pro', style='normal', variant='normal', weight=700, stretch='normal', size='scalable')) = 10.335
2026-07-21 14:55:57 runnervm3jd5f matplotlib.font_manager[2874] DEBUG findfont: score(FontEntry(fname='/home/runner/micromamba/envs/trajan/fonts/Ubuntu-MI.ttf', index=0, name='Ubuntu', style='italic', variant='normal', weight=500, stretch='normal', size='scalable')) = 11.145
2026-07-21 14:55:57 runnervm3jd5f matplotlib.font_manager[2874] DEBUG findfont: score(FontEntry(fname='/home/runner/micromamba/envs/trajan/fonts/Ubuntu-MI.ttf', index=0, name='Ubuntu Light', style='italic', variant='normal', weight=700, stretch='normal', size='scalable')) = 11.335
2026-07-21 14:55:57 runnervm3jd5f matplotlib.font_manager[2874] DEBUG findfont: score(FontEntry(fname='/usr/share/fonts/truetype/lato/Lato-Regular.ttf', index=0, name='Lato', style='normal', variant='normal', weight=400, stretch='normal', size='scalable')) = 10.05
2026-07-21 14:55:57 runnervm3jd5f matplotlib.font_manager[2874] DEBUG findfont: score(FontEntry(fname='/usr/share/fonts/truetype/lato/Lato-ThinItalic.ttf', index=0, name='Lato', style='italic', variant='normal', weight=275, stretch='normal', size='scalable')) = 11.16875
2026-07-21 14:55:57 runnervm3jd5f matplotlib.font_manager[2874] DEBUG findfont: score(FontEntry(fname='/usr/share/fonts/truetype/lato/Lato-ThinItalic.ttf', index=0, name='Lato Thin', style='italic', variant='normal', weight=400, stretch='normal', size='scalable')) = 11.05
2026-07-21 14:55:57 runnervm3jd5f matplotlib.font_manager[2874] DEBUG findfont: score(FontEntry(fname='/usr/share/fonts/truetype/lato/Lato-BlackItalic.ttf', index=0, name='Lato', style='italic', variant='normal', weight=900, stretch='normal', size='scalable')) = 11.525
2026-07-21 14:55:57 runnervm3jd5f matplotlib.font_manager[2874] DEBUG findfont: score(FontEntry(fname='/usr/share/fonts/truetype/lato/Lato-BlackItalic.ttf', index=0, name='Lato Black', style='italic', variant='normal', weight=400, stretch='normal', size='scalable')) = 11.05
2026-07-21 14:55:57 runnervm3jd5f matplotlib.font_manager[2874] DEBUG findfont: score(FontEntry(fname='/usr/share/fonts/truetype/dejavu/DejaVuSerifCondensed-Italic.ttf', index=0, name='DejaVu Serif', style='italic', variant='normal', weight=400, stretch='condensed', size='scalable')) = 11.25
2026-07-21 14:55:57 runnervm3jd5f matplotlib.font_manager[2874] DEBUG findfont: score(FontEntry(fname='/usr/share/fonts/truetype/dejavu/DejaVuSerifCondensed-Italic.ttf', index=0, name='DejaVu Serif Condensed', style='italic', variant='normal', weight=400, stretch='condensed', size='scalable')) = 11.25
2026-07-21 14:55:57 runnervm3jd5f matplotlib.font_manager[2874] DEBUG findfont: score(FontEntry(fname='/usr/share/fonts/truetype/dejavu/DejaVuSans-Bold.ttf', index=0, name='DejaVu Sans', style='normal', variant='normal', weight=700, stretch='normal', size='scalable')) = 10.335
2026-07-21 14:55:57 runnervm3jd5f matplotlib.font_manager[2874] DEBUG findfont: score(FontEntry(fname='/home/runner/micromamba/envs/trajan/fonts/UbuntuMono-R.ttf', index=0, name='Ubuntu Mono', style='normal', variant='normal', weight=400, stretch='normal', size='scalable')) = 10.05
2026-07-21 14:55:57 runnervm3jd5f matplotlib.font_manager[2874] DEBUG findfont: score(FontEntry(fname='/usr/share/fonts/truetype/dejavu/DejaVuSerif-BoldItalic.ttf', index=0, name='DejaVu Serif', style='italic', variant='normal', weight=700, stretch='normal', size='scalable')) = 11.335
2026-07-21 14:55:57 runnervm3jd5f matplotlib.font_manager[2874] DEBUG findfont: score(FontEntry(fname='/usr/share/fonts/truetype/lato/Lato-Hairline.ttf', index=0, name='Lato', style='normal', variant='normal', weight=250, stretch='normal', size='scalable')) = 10.1925
2026-07-21 14:55:57 runnervm3jd5f matplotlib.font_manager[2874] DEBUG findfont: score(FontEntry(fname='/usr/share/fonts/truetype/lato/Lato-Hairline.ttf', index=0, name='Lato Hairline', style='normal', variant='normal', weight=400, stretch='normal', size='scalable')) = 10.05
2026-07-21 14:55:57 runnervm3jd5f matplotlib.font_manager[2874] DEBUG findfont: score(FontEntry(fname='/usr/share/fonts/truetype/lato/Lato-LightItalic.ttf', index=0, name='Lato', style='italic', variant='normal', weight=300, stretch='normal', size='scalable')) = 11.145
2026-07-21 14:55:57 runnervm3jd5f matplotlib.font_manager[2874] DEBUG findfont: score(FontEntry(fname='/usr/share/fonts/truetype/lato/Lato-LightItalic.ttf', index=0, name='Lato Light', style='italic', variant='normal', weight=400, stretch='normal', size='scalable')) = 11.05
2026-07-21 14:55:57 runnervm3jd5f matplotlib.font_manager[2874] DEBUG findfont: score(FontEntry(fname='/usr/share/fonts/truetype/dejavu/DejaVuSansCondensed-BoldOblique.ttf', index=0, name='DejaVu Sans', style='oblique', variant='normal', weight=700, stretch='condensed', size='scalable')) = 11.535
2026-07-21 14:55:57 runnervm3jd5f matplotlib.font_manager[2874] DEBUG findfont: score(FontEntry(fname='/usr/share/fonts/truetype/dejavu/DejaVuSansCondensed-BoldOblique.ttf', index=0, name='DejaVu Sans Condensed', style='oblique', variant='normal', weight=700, stretch='condensed', size='scalable')) = 11.535
2026-07-21 14:55:57 runnervm3jd5f matplotlib.font_manager[2874] DEBUG findfont: score(FontEntry(fname='/home/runner/micromamba/envs/trajan/fonts/SourceCodePro-It.ttf', index=0, name='Source Code Pro', style='italic', variant='normal', weight=400, stretch='normal', size='scalable')) = 11.05
2026-07-21 14:55:57 runnervm3jd5f matplotlib.font_manager[2874] DEBUG findfont: score(FontEntry(fname='/home/runner/micromamba/envs/trajan/fonts/SourceCodePro-ExtraLightIt.ttf', index=0, name='Source Code Pro', style='italic', variant='normal', weight=200, stretch='normal', size='scalable')) = 11.24
2026-07-21 14:55:57 runnervm3jd5f matplotlib.font_manager[2874] DEBUG findfont: score(FontEntry(fname='/home/runner/micromamba/envs/trajan/fonts/SourceCodePro-ExtraLightIt.ttf', index=0, name='Source Code Pro ExtraLight', style='italic', variant='normal', weight=400, stretch='normal', size='scalable')) = 11.05
2026-07-21 14:55:57 runnervm3jd5f matplotlib.font_manager[2874] DEBUG findfont: score(FontEntry(fname='/usr/share/fonts/truetype/lato/Lato-Medium.ttf', index=0, name='Lato', style='normal', variant='normal', weight=500, stretch='normal', size='scalable')) = 10.145
2026-07-21 14:55:57 runnervm3jd5f matplotlib.font_manager[2874] DEBUG findfont: score(FontEntry(fname='/usr/share/fonts/truetype/lato/Lato-Medium.ttf', index=0, name='Lato Medium', style='normal', variant='normal', weight=400, stretch='normal', size='scalable')) = 10.05
2026-07-21 14:55:57 runnervm3jd5f matplotlib.font_manager[2874] DEBUG findfont: score(FontEntry(fname='/usr/share/fonts/truetype/lato/Lato-BoldItalic.ttf', index=0, name='Lato', style='italic', variant='normal', weight=700, stretch='normal', size='scalable')) = 11.335
2026-07-21 14:55:57 runnervm3jd5f matplotlib.font_manager[2874] DEBUG findfont: score(FontEntry(fname='/home/runner/micromamba/envs/trajan/fonts/DejaVuSans.ttf', index=0, name='DejaVu Sans', style='normal', variant='normal', weight=400, stretch='normal', size='scalable')) = 10.05
2026-07-21 14:55:57 runnervm3jd5f matplotlib.font_manager[2874] DEBUG findfont: score(FontEntry(fname='/home/runner/micromamba/envs/trajan/fonts/UbuntuMono-B.ttf', index=0, name='Ubuntu Mono', style='normal', variant='normal', weight=700, stretch='normal', size='scalable')) = 10.335
2026-07-21 14:55:57 runnervm3jd5f matplotlib.font_manager[2874] DEBUG findfont: score(FontEntry(fname='/home/runner/micromamba/envs/trajan/fonts/SourceCodePro-LightIt.ttf', index=0, name='Source Code Pro', style='italic', variant='normal', weight=300, stretch='normal', size='scalable')) = 11.145
2026-07-21 14:55:57 runnervm3jd5f matplotlib.font_manager[2874] DEBUG findfont: score(FontEntry(fname='/home/runner/micromamba/envs/trajan/fonts/SourceCodePro-LightIt.ttf', index=0, name='Source Code Pro Light', style='italic', variant='normal', weight=400, stretch='normal', size='scalable')) = 11.05
2026-07-21 14:55:57 runnervm3jd5f matplotlib.font_manager[2874] DEBUG findfont: score(FontEntry(fname='/usr/share/fonts/truetype/liberation/LiberationSans-BoldItalic.ttf', index=0, name='Liberation Sans', style='italic', variant='normal', weight=700, stretch='normal', size='scalable')) = 11.335
2026-07-21 14:55:57 runnervm3jd5f matplotlib.font_manager[2874] DEBUG findfont: score(FontEntry(fname='/usr/share/fonts/truetype/liberation/LiberationSans-Regular.ttf', index=0, name='Liberation Sans', style='normal', variant='normal', weight=400, stretch='normal', size='scalable')) = 10.05
2026-07-21 14:55:57 runnervm3jd5f matplotlib.font_manager[2874] DEBUG findfont: score(FontEntry(fname='/usr/share/fonts/truetype/dejavu/DejaVuSansMono-Bold.ttf', index=0, name='DejaVu Sans Mono', style='normal', variant='normal', weight=700, stretch='normal', size='scalable')) = 10.335
2026-07-21 14:55:57 runnervm3jd5f matplotlib.font_manager[2874] DEBUG findfont: score(FontEntry(fname='/home/runner/micromamba/envs/trajan/fonts/SourceCodePro-BoldIt.ttf', index=0, name='Source Code Pro', style='italic', variant='normal', weight=700, stretch='normal', size='scalable')) = 11.335
2026-07-21 14:55:57 runnervm3jd5f matplotlib.font_manager[2874] DEBUG findfont: score(FontEntry(fname='/usr/share/fonts/truetype/lato/Lato-Bold.ttf', index=0, name='Lato', style='normal', variant='normal', weight=700, stretch='normal', size='scalable')) = 10.335
2026-07-21 14:55:57 runnervm3jd5f matplotlib.font_manager[2874] DEBUG findfont: score(FontEntry(fname='/usr/share/fonts/truetype/dejavu/DejaVuSansCondensed.ttf', index=0, name='DejaVu Sans', style='normal', variant='normal', weight=400, stretch='condensed', size='scalable')) = 10.25
2026-07-21 14:55:57 runnervm3jd5f matplotlib.font_manager[2874] DEBUG findfont: score(FontEntry(fname='/usr/share/fonts/truetype/dejavu/DejaVuSansCondensed.ttf', index=0, name='DejaVu Sans Condensed', style='normal', variant='normal', weight=380, stretch='condensed', size='scalable')) = 10.269
2026-07-21 14:55:57 runnervm3jd5f matplotlib.font_manager[2874] DEBUG findfont: score(FontEntry(fname='/usr/share/fonts/truetype/lato/Lato-MediumItalic.ttf', index=0, name='Lato', style='italic', variant='normal', weight=500, stretch='normal', size='scalable')) = 11.145
2026-07-21 14:55:57 runnervm3jd5f matplotlib.font_manager[2874] DEBUG findfont: score(FontEntry(fname='/usr/share/fonts/truetype/lato/Lato-MediumItalic.ttf', index=0, name='Lato Medium', style='italic', variant='normal', weight=400, stretch='normal', size='scalable')) = 11.05
2026-07-21 14:55:57 runnervm3jd5f matplotlib.font_manager[2874] DEBUG findfont: score(FontEntry(fname='/usr/share/fonts/truetype/liberation/LiberationSans-Bold.ttf', index=0, name='Liberation Sans', style='normal', variant='normal', weight=700, stretch='normal', size='scalable')) = 10.335
2026-07-21 14:55:57 runnervm3jd5f matplotlib.font_manager[2874] DEBUG findfont: score(FontEntry(fname='/usr/share/fonts/truetype/dejavu/DejaVuSerifCondensed-BoldItalic.ttf', index=0, name='DejaVu Serif', style='italic', variant='normal', weight=700, stretch='condensed', size='scalable')) = 11.535
2026-07-21 14:55:57 runnervm3jd5f matplotlib.font_manager[2874] DEBUG findfont: score(FontEntry(fname='/usr/share/fonts/truetype/dejavu/DejaVuSerifCondensed-BoldItalic.ttf', index=0, name='DejaVu Serif Condensed', style='italic', variant='normal', weight=700, stretch='condensed', size='scalable')) = 11.535
2026-07-21 14:55:57 runnervm3jd5f matplotlib.font_manager[2874] DEBUG findfont: score(FontEntry(fname='/home/runner/micromamba/envs/trajan/fonts/Ubuntu-R.ttf', index=0, name='Ubuntu', style='normal', variant='normal', weight=400, stretch='normal', size='scalable')) = 10.05
2026-07-21 14:55:57 runnervm3jd5f matplotlib.font_manager[2874] DEBUG findfont: score(FontEntry(fname='/usr/share/fonts/truetype/lato/Lato-Light.ttf', index=0, name='Lato', style='normal', variant='normal', weight=300, stretch='normal', size='scalable')) = 10.145
2026-07-21 14:55:57 runnervm3jd5f matplotlib.font_manager[2874] DEBUG findfont: score(FontEntry(fname='/usr/share/fonts/truetype/lato/Lato-Light.ttf', index=0, name='Lato Light', style='normal', variant='normal', weight=400, stretch='normal', size='scalable')) = 10.05
2026-07-21 14:55:57 runnervm3jd5f matplotlib.font_manager[2874] DEBUG findfont: score(FontEntry(fname='/usr/share/fonts/truetype/liberation/LiberationSerif-BoldItalic.ttf', index=0, name='Liberation Serif', style='italic', variant='normal', weight=700, stretch='normal', size='scalable')) = 11.335
2026-07-21 14:55:57 runnervm3jd5f matplotlib.font_manager[2874] DEBUG findfont: score(FontEntry(fname='/home/runner/micromamba/envs/trajan/fonts/Ubuntu-Th.ttf', index=0, name='Ubuntu', style='normal', variant='normal', weight=250, stretch='normal', size='scalable')) = 10.1925
2026-07-21 14:55:57 runnervm3jd5f matplotlib.font_manager[2874] DEBUG findfont: score(FontEntry(fname='/home/runner/micromamba/envs/trajan/fonts/Ubuntu-Th.ttf', index=0, name='Ubuntu Thin', style='normal', variant='normal', weight=400, stretch='normal', size='scalable')) = 10.05
2026-07-21 14:55:57 runnervm3jd5f matplotlib.font_manager[2874] DEBUG findfont: score(FontEntry(fname='/home/runner/micromamba/envs/trajan/fonts/SourceCodePro-ExtraLight.ttf', index=0, name='Source Code Pro', style='normal', variant='normal', weight=200, stretch='normal', size='scalable')) = 10.24
2026-07-21 14:55:57 runnervm3jd5f matplotlib.font_manager[2874] DEBUG findfont: score(FontEntry(fname='/home/runner/micromamba/envs/trajan/fonts/SourceCodePro-ExtraLight.ttf', index=0, name='Source Code Pro ExtraLight', style='normal', variant='normal', weight=400, stretch='normal', size='scalable')) = 10.05
2026-07-21 14:55:57 runnervm3jd5f matplotlib.font_manager[2874] DEBUG findfont: score(FontEntry(fname='/usr/share/fonts/truetype/lato/Lato-Thin.ttf', index=0, name='Lato', style='normal', variant='normal', weight=275, stretch='normal', size='scalable')) = 10.16875
2026-07-21 14:55:57 runnervm3jd5f matplotlib.font_manager[2874] DEBUG findfont: score(FontEntry(fname='/usr/share/fonts/truetype/lato/Lato-Thin.ttf', index=0, name='Lato Thin', style='normal', variant='normal', weight=400, stretch='normal', size='scalable')) = 10.05
2026-07-21 14:55:57 runnervm3jd5f matplotlib.font_manager[2874] DEBUG findfont: score(FontEntry(fname='/usr/share/fonts/truetype/liberation/LiberationSerif-Bold.ttf', index=0, name='Liberation Serif', style='normal', variant='normal', weight=700, stretch='normal', size='scalable')) = 10.335
2026-07-21 14:55:57 runnervm3jd5f matplotlib.font_manager[2874] DEBUG findfont: score(FontEntry(fname='/home/runner/micromamba/envs/trajan/fonts/Inconsolata-Regular.ttf', index=0, name='Inconsolata', style='normal', variant='normal', weight=400, stretch='normal', size='scalable')) = 10.05
2026-07-21 14:55:57 runnervm3jd5f matplotlib.font_manager[2874] DEBUG findfont: score(FontEntry(fname='/home/runner/micromamba/envs/trajan/fonts/Ubuntu-C.ttf', index=0, name='Ubuntu Condensed', style='normal', variant='normal', weight=400, stretch='condensed', size='scalable')) = 10.25
2026-07-21 14:55:57 runnervm3jd5f matplotlib.font_manager[2874] DEBUG findfont: score(FontEntry(fname='/usr/share/fonts/truetype/dejavu/DejaVuSansCondensed-Bold.ttf', index=0, name='DejaVu Sans', style='normal', variant='normal', weight=700, stretch='condensed', size='scalable')) = 10.535
2026-07-21 14:55:57 runnervm3jd5f matplotlib.font_manager[2874] DEBUG findfont: score(FontEntry(fname='/usr/share/fonts/truetype/dejavu/DejaVuSansCondensed-Bold.ttf', index=0, name='DejaVu Sans Condensed', style='normal', variant='normal', weight=700, stretch='condensed', size='scalable')) = 10.535
2026-07-21 14:55:57 runnervm3jd5f matplotlib.font_manager[2874] DEBUG findfont: score(FontEntry(fname='/usr/share/fonts/truetype/liberation/LiberationMono-Bold.ttf', index=0, name='Liberation Mono', style='normal', variant='normal', weight=700, stretch='normal', size='scalable')) = 10.335
2026-07-21 14:55:57 runnervm3jd5f matplotlib.font_manager[2874] DEBUG findfont: score(FontEntry(fname='/home/runner/micromamba/envs/trajan/fonts/SourceCodePro-Black.ttf', index=0, name='Source Code Pro', style='normal', variant='normal', weight=900, stretch='normal', size='scalable')) = 10.525
2026-07-21 14:55:57 runnervm3jd5f matplotlib.font_manager[2874] DEBUG findfont: score(FontEntry(fname='/home/runner/micromamba/envs/trajan/fonts/SourceCodePro-Black.ttf', index=0, name='Source Code Pro Black', style='normal', variant='normal', weight=400, stretch='normal', size='scalable')) = 10.05
2026-07-21 14:55:57 runnervm3jd5f matplotlib.font_manager[2874] DEBUG findfont: score(FontEntry(fname='/home/runner/micromamba/envs/trajan/fonts/SourceCodePro-BlackIt.ttf', index=0, name='Source Code Pro', style='italic', variant='normal', weight=900, stretch='normal', size='scalable')) = 11.525
2026-07-21 14:55:57 runnervm3jd5f matplotlib.font_manager[2874] DEBUG findfont: score(FontEntry(fname='/home/runner/micromamba/envs/trajan/fonts/SourceCodePro-BlackIt.ttf', index=0, name='Source Code Pro Black', style='italic', variant='normal', weight=400, stretch='normal', size='scalable')) = 11.05
2026-07-21 14:55:57 runnervm3jd5f matplotlib.font_manager[2874] DEBUG findfont: score(FontEntry(fname='/home/runner/micromamba/envs/trajan/fonts/Ubuntu-LI.ttf', index=0, name='Ubuntu', style='italic', variant='normal', weight=300, stretch='normal', size='scalable')) = 11.145
2026-07-21 14:55:57 runnervm3jd5f matplotlib.font_manager[2874] DEBUG findfont: score(FontEntry(fname='/home/runner/micromamba/envs/trajan/fonts/Ubuntu-LI.ttf', index=0, name='Ubuntu Light', style='italic', variant='normal', weight=400, stretch='normal', size='scalable')) = 11.05
2026-07-21 14:55:57 runnervm3jd5f matplotlib.font_manager[2874] DEBUG findfont: score(FontEntry(fname='/usr/share/fonts/truetype/liberation/LiberationMono-Regular.ttf', index=0, name='Liberation Mono', style='normal', variant='normal', weight=400, stretch='normal', size='scalable')) = 10.05
2026-07-21 14:55:57 runnervm3jd5f matplotlib.font_manager[2874] DEBUG findfont: score(FontEntry(fname='/home/runner/micromamba/envs/trajan/fonts/UbuntuMono-RI.ttf', index=0, name='Ubuntu Mono', style='italic', variant='normal', weight=400, stretch='normal', size='scalable')) = 11.05
2026-07-21 14:55:57 runnervm3jd5f matplotlib.font_manager[2874] DEBUG findfont: score(FontEntry(fname='/usr/share/fonts/truetype/lato/Lato-Heavy.ttf', index=0, name='Lato', style='normal', variant='normal', weight=800, stretch='normal', size='scalable')) = 10.43
2026-07-21 14:55:57 runnervm3jd5f matplotlib.font_manager[2874] DEBUG findfont: score(FontEntry(fname='/usr/share/fonts/truetype/lato/Lato-Heavy.ttf', index=0, name='Lato Heavy', style='normal', variant='normal', weight=400, stretch='normal', size='scalable')) = 10.05
2026-07-21 14:55:57 runnervm3jd5f matplotlib.font_manager[2874] DEBUG findfont: score(FontEntry(fname='/usr/share/fonts/truetype/lato/Lato-HairlineItalic.ttf', index=0, name='Lato', style='italic', variant='normal', weight=250, stretch='normal', size='scalable')) = 11.1925
2026-07-21 14:55:57 runnervm3jd5f matplotlib.font_manager[2874] DEBUG findfont: score(FontEntry(fname='/usr/share/fonts/truetype/lato/Lato-HairlineItalic.ttf', index=0, name='Lato Hairline', style='italic', variant='normal', weight=400, stretch='normal', size='scalable')) = 11.05
2026-07-21 14:55:57 runnervm3jd5f matplotlib.font_manager[2874] DEBUG findfont: score(FontEntry(fname='/usr/share/fonts/truetype/dejavu/DejaVuSerifCondensed-Bold.ttf', index=0, name='DejaVu Serif', style='normal', variant='normal', weight=700, stretch='condensed', size='scalable')) = 10.535
2026-07-21 14:55:57 runnervm3jd5f matplotlib.font_manager[2874] DEBUG findfont: score(FontEntry(fname='/usr/share/fonts/truetype/dejavu/DejaVuSerifCondensed-Bold.ttf', index=0, name='DejaVu Serif Condensed', style='normal', variant='normal', weight=700, stretch='condensed', size='scalable')) = 10.535
2026-07-21 14:55:57 runnervm3jd5f matplotlib.font_manager[2874] DEBUG findfont: score(FontEntry(fname='/usr/share/fonts/truetype/dejavu/DejaVuSansCondensed-Oblique.ttf', index=0, name='DejaVu Sans', style='oblique', variant='normal', weight=400, stretch='condensed', size='scalable')) = 11.25
2026-07-21 14:55:57 runnervm3jd5f matplotlib.font_manager[2874] DEBUG findfont: score(FontEntry(fname='/usr/share/fonts/truetype/dejavu/DejaVuSansCondensed-Oblique.ttf', index=0, name='DejaVu Sans Condensed', style='oblique', variant='normal', weight=400, stretch='condensed', size='scalable')) = 11.25
2026-07-21 14:55:57 runnervm3jd5f matplotlib.font_manager[2874] DEBUG findfont: score(FontEntry(fname='/usr/share/fonts/truetype/lato/Lato-SemiboldItalic.ttf', index=0, name='Lato', style='italic', variant='normal', weight=600, stretch='normal', size='scalable')) = 11.24
2026-07-21 14:55:57 runnervm3jd5f matplotlib.font_manager[2874] DEBUG findfont: score(FontEntry(fname='/usr/share/fonts/truetype/lato/Lato-SemiboldItalic.ttf', index=0, name='Lato Semibold', style='italic', variant='normal', weight=400, stretch='normal', size='scalable')) = 11.05
2026-07-21 14:55:57 runnervm3jd5f matplotlib.font_manager[2874] DEBUG findfont: score(FontEntry(fname='/usr/share/fonts/truetype/lato/Lato-Semibold.ttf', index=0, name='Lato', style='normal', variant='normal', weight=600, stretch='normal', size='scalable')) = 10.24
2026-07-21 14:55:57 runnervm3jd5f matplotlib.font_manager[2874] DEBUG findfont: score(FontEntry(fname='/usr/share/fonts/truetype/lato/Lato-Semibold.ttf', index=0, name='Lato Semibold', style='normal', variant='normal', weight=400, stretch='normal', size='scalable')) = 10.05
2026-07-21 14:55:57 runnervm3jd5f matplotlib.font_manager[2874] DEBUG findfont: score(FontEntry(fname='/home/runner/micromamba/envs/trajan/fonts/Inconsolata-Bold.ttf', index=0, name='Inconsolata', style='normal', variant='normal', weight=700, stretch='normal', size='scalable')) = 10.335
2026-07-21 14:55:57 runnervm3jd5f matplotlib.font_manager[2874] DEBUG findfont: score(FontEntry(fname='/usr/share/fonts/truetype/dejavu/DejaVuSans-ExtraLight.ttf', index=0, name='DejaVu Sans', style='normal', variant='normal', weight=200, stretch='normal', size='scalable')) = 10.24
2026-07-21 14:55:57 runnervm3jd5f matplotlib.font_manager[2874] DEBUG findfont: score(FontEntry(fname='/usr/share/fonts/truetype/dejavu/DejaVuSans-ExtraLight.ttf', index=0, name='DejaVu Sans Light', style='normal', variant='normal', weight=200, stretch='normal', size='scalable')) = 10.24
2026-07-21 14:55:57 runnervm3jd5f matplotlib.font_manager[2874] DEBUG findfont: score(FontEntry(fname='/home/runner/micromamba/envs/trajan/fonts/Ubuntu-BI.ttf', index=0, name='Ubuntu', style='italic', variant='normal', weight=700, stretch='normal', size='scalable')) = 11.335
2026-07-21 14:55:57 runnervm3jd5f matplotlib.font_manager[2874] DEBUG findfont: score(FontEntry(fname='/usr/share/fonts/truetype/dejavu/DejaVuSans-BoldOblique.ttf', index=0, name='DejaVu Sans', style='oblique', variant='normal', weight=700, stretch='normal', size='scalable')) = 11.335
2026-07-21 14:55:57 runnervm3jd5f matplotlib.font_manager[2874] DEBUG findfont: score(FontEntry(fname='/home/runner/micromamba/envs/trajan/fonts/Ubuntu-RI.ttf', index=0, name='Ubuntu', style='italic', variant='normal', weight=400, stretch='normal', size='scalable')) = 11.05
2026-07-21 14:55:57 runnervm3jd5f matplotlib.font_manager[2874] DEBUG findfont: score(FontEntry(fname='/usr/share/fonts/truetype/dejavu/DejaVuSerif-Italic.ttf', index=0, name='DejaVu Serif', style='italic', variant='normal', weight=400, stretch='normal', size='scalable')) = 11.05
2026-07-21 14:55:57 runnervm3jd5f matplotlib.font_manager[2874] DEBUG findfont: score(FontEntry(fname='/home/runner/micromamba/envs/trajan/fonts/SourceCodePro-Medium.ttf', index=0, name='Source Code Pro', style='normal', variant='normal', weight=500, stretch='normal', size='scalable')) = 10.145
2026-07-21 14:55:57 runnervm3jd5f matplotlib.font_manager[2874] DEBUG findfont: score(FontEntry(fname='/home/runner/micromamba/envs/trajan/fonts/SourceCodePro-Medium.ttf', index=0, name='Source Code Pro Medium', style='normal', variant='normal', weight=400, stretch='normal', size='scalable')) = 10.05
2026-07-21 14:55:57 runnervm3jd5f matplotlib.font_manager[2874] DEBUG findfont: score(FontEntry(fname='/usr/share/fonts/truetype/lato/Lato-HeavyItalic.ttf', index=0, name='Lato', style='italic', variant='normal', weight=800, stretch='normal', size='scalable')) = 11.43
2026-07-21 14:55:57 runnervm3jd5f matplotlib.font_manager[2874] DEBUG findfont: score(FontEntry(fname='/usr/share/fonts/truetype/lato/Lato-HeavyItalic.ttf', index=0, name='Lato Heavy', style='italic', variant='normal', weight=400, stretch='normal', size='scalable')) = 11.05
2026-07-21 14:55:57 runnervm3jd5f matplotlib.font_manager[2874] DEBUG findfont: score(FontEntry(fname='/usr/share/fonts/truetype/dejavu/DejaVuSans-Oblique.ttf', index=0, name='DejaVu Sans', style='oblique', variant='normal', weight=400, stretch='normal', size='scalable')) = 11.05
2026-07-21 14:55:57 runnervm3jd5f matplotlib.font_manager[2874] DEBUG findfont: score(FontEntry(fname='/home/runner/micromamba/envs/trajan/fonts/Ubuntu-M.ttf', index=0, name='Ubuntu', style='normal', variant='normal', weight=500, stretch='normal', size='scalable')) = 10.145
2026-07-21 14:55:57 runnervm3jd5f matplotlib.font_manager[2874] DEBUG findfont: score(FontEntry(fname='/home/runner/micromamba/envs/trajan/fonts/Ubuntu-M.ttf', index=0, name='Ubuntu Light', style='normal', variant='normal', weight=700, stretch='normal', size='scalable')) = 10.335
2026-07-21 14:55:57 runnervm3jd5f matplotlib.font_manager[2874] DEBUG findfont: score(FontEntry(fname='/usr/share/fonts/truetype/liberation/LiberationMono-BoldItalic.ttf', index=0, name='Liberation Mono', style='italic', variant='normal', weight=700, stretch='normal', size='scalable')) = 11.335
2026-07-21 14:55:57 runnervm3jd5f matplotlib.font_manager[2874] DEBUG findfont: score(FontEntry(fname='/usr/share/fonts/truetype/dejavu/DejaVuSansMono.ttf', index=0, name='DejaVu Sans Mono', style='normal', variant='normal', weight=400, stretch='normal', size='scalable')) = 10.05
2026-07-21 14:55:57 runnervm3jd5f matplotlib.font_manager[2874] DEBUG findfont: score(FontEntry(fname='/usr/share/fonts/truetype/dejavu/DejaVuMathTeXGyre.ttf', index=0, name='DejaVu Math TeX Gyre', style='normal', variant='normal', weight=400, stretch='normal', size='scalable')) = 10.05
2026-07-21 14:55:57 runnervm3jd5f matplotlib.font_manager[2874] DEBUG findfont: score(FontEntry(fname='/usr/share/fonts/truetype/dejavu/DejaVuSansMono-Oblique.ttf', index=0, name='DejaVu Sans Mono', style='oblique', variant='normal', weight=400, stretch='normal', size='scalable')) = 11.05
2026-07-21 14:55:57 runnervm3jd5f matplotlib.font_manager[2874] DEBUG findfont: score(FontEntry(fname='/home/runner/micromamba/envs/trajan/fonts/Ubuntu-L.ttf', index=0, name='Ubuntu', style='normal', variant='normal', weight=300, stretch='normal', size='scalable')) = 10.145
2026-07-21 14:55:57 runnervm3jd5f matplotlib.font_manager[2874] DEBUG findfont: score(FontEntry(fname='/home/runner/micromamba/envs/trajan/fonts/Ubuntu-L.ttf', index=0, name='Ubuntu Light', style='normal', variant='normal', weight=400, stretch='normal', size='scalable')) = 10.05
2026-07-21 14:55:57 runnervm3jd5f matplotlib.font_manager[2874] DEBUG findfont: score(FontEntry(fname='/home/runner/micromamba/envs/trajan/fonts/SourceCodePro-MediumIt.ttf', index=0, name='Source Code Pro', style='italic', variant='normal', weight=500, stretch='normal', size='scalable')) = 11.145
2026-07-21 14:55:57 runnervm3jd5f matplotlib.font_manager[2874] DEBUG findfont: score(FontEntry(fname='/home/runner/micromamba/envs/trajan/fonts/SourceCodePro-MediumIt.ttf', index=0, name='Source Code Pro Medium', style='italic', variant='normal', weight=400, stretch='normal', size='scalable')) = 11.05
2026-07-21 14:55:57 runnervm3jd5f matplotlib.font_manager[2874] DEBUG findfont: score(FontEntry(fname='/home/runner/micromamba/envs/trajan/fonts/SourceCodePro-Regular.ttf', index=0, name='Source Code Pro', style='normal', variant='normal', weight=400, stretch='normal', size='scalable')) = 10.05
2026-07-21 14:55:57 runnervm3jd5f matplotlib.font_manager[2874] DEBUG findfont: score(FontEntry(fname='/home/runner/micromamba/envs/trajan/fonts/SourceCodePro-SemiboldIt.ttf', index=0, name='Source Code Pro', style='italic', variant='normal', weight=600, stretch='normal', size='scalable')) = 11.24
2026-07-21 14:55:57 runnervm3jd5f matplotlib.font_manager[2874] DEBUG findfont: score(FontEntry(fname='/home/runner/micromamba/envs/trajan/fonts/SourceCodePro-SemiboldIt.ttf', index=0, name='Source Code Pro Semibold', style='italic', variant='normal', weight=400, stretch='normal', size='scalable')) = 11.05
2026-07-21 14:55:57 runnervm3jd5f matplotlib.font_manager[2874] DEBUG findfont: score(FontEntry(fname='/usr/share/fonts/truetype/dejavu/DejaVuSerif.ttf', index=0, name='DejaVu Serif', style='normal', variant='normal', weight=400, stretch='normal', size='scalable')) = 10.05
2026-07-21 14:55:57 runnervm3jd5f matplotlib.font_manager[2874] DEBUG findfont: score(FontEntry(fname='/usr/share/fonts/truetype/dejavu/DejaVuSerif-Bold.ttf', index=0, name='DejaVu Serif', style='normal', variant='normal', weight=700, stretch='normal', size='scalable')) = 10.335
2026-07-21 14:55:57 runnervm3jd5f matplotlib.font_manager[2874] DEBUG findfont: score(FontEntry(fname='/usr/share/fonts/truetype/liberation/LiberationSerif-Italic.ttf', index=0, name='Liberation Serif', style='italic', variant='normal', weight=400, stretch='normal', size='scalable')) = 11.05
2026-07-21 14:55:57 runnervm3jd5f matplotlib.font_manager[2874] DEBUG findfont: score(FontEntry(fname='/usr/share/fonts/truetype/dejavu/DejaVuSansMono-BoldOblique.ttf', index=0, name='DejaVu Sans Mono', style='oblique', variant='normal', weight=700, stretch='normal', size='scalable')) = 11.335
2026-07-21 14:55:57 runnervm3jd5f matplotlib.font_manager[2874] DEBUG findfont: score(FontEntry(fname='/home/runner/micromamba/envs/trajan/fonts/SourceCodePro-Light.ttf', index=0, name='Source Code Pro', style='normal', variant='normal', weight=300, stretch='normal', size='scalable')) = 10.145
2026-07-21 14:55:57 runnervm3jd5f matplotlib.font_manager[2874] DEBUG findfont: score(FontEntry(fname='/home/runner/micromamba/envs/trajan/fonts/SourceCodePro-Light.ttf', index=0, name='Source Code Pro Light', style='normal', variant='normal', weight=400, stretch='normal', size='scalable')) = 10.05
2026-07-21 14:55:57 runnervm3jd5f matplotlib.font_manager[2874] DEBUG findfont: score(FontEntry(fname='/usr/share/fonts/truetype/liberation/LiberationMono-Italic.ttf', index=0, name='Liberation Mono', style='italic', variant='normal', weight=400, stretch='normal', size='scalable')) = 11.05
2026-07-21 14:55:57 runnervm3jd5f matplotlib.font_manager[2874] DEBUG findfont: Matching STIXSizeFiveSym:style=normal:variant=normal:weight=normal:stretch=normal:size=10.0 to STIXSizeFiveSym ('/home/runner/micromamba/envs/trajan/lib/python3.14/site-packages/matplotlib/mpl-data/fonts/ttf/STIXSizFiveSymReg.ttf') with score of 0.050000.
2026-07-21 14:55:57 runnervm3jd5f matplotlib.font_manager[2874] DEBUG findfont: Matching cmmi10:style=normal:variant=normal:weight=normal:stretch=normal:size=10.0.
2026-07-21 14:55:57 runnervm3jd5f matplotlib.font_manager[2874] DEBUG findfont: score(FontEntry(fname='/home/runner/micromamba/envs/trajan/lib/python3.14/site-packages/matplotlib/mpl-data/fonts/ttf/cmmi10.ttf', index=0, name='cmmi10', style='normal', variant='normal', weight=400, stretch='normal', size='scalable')) = 0.05
2026-07-21 14:55:57 runnervm3jd5f matplotlib.font_manager[2874] DEBUG findfont: score(FontEntry(fname='/home/runner/micromamba/envs/trajan/lib/python3.14/site-packages/matplotlib/mpl-data/fonts/ttf/DejaVuSerif-Bold.ttf', index=0, name='DejaVu Serif', style='normal', variant='normal', weight=700, stretch='normal', size='scalable')) = 10.335
2026-07-21 14:55:57 runnervm3jd5f matplotlib.font_manager[2874] DEBUG findfont: score(FontEntry(fname='/home/runner/micromamba/envs/trajan/lib/python3.14/site-packages/matplotlib/mpl-data/fonts/ttf/DejaVuSans-Oblique.ttf', index=0, name='DejaVu Sans', style='oblique', variant='normal', weight=400, stretch='normal', size='scalable')) = 11.05
2026-07-21 14:55:57 runnervm3jd5f matplotlib.font_manager[2874] DEBUG findfont: score(FontEntry(fname='/home/runner/micromamba/envs/trajan/lib/python3.14/site-packages/matplotlib/mpl-data/fonts/ttf/STIXSizThreeSymReg.ttf', index=0, name='STIXSizeThreeSym', style='normal', variant='normal', weight=400, stretch='normal', size='scalable')) = 10.05
2026-07-21 14:55:57 runnervm3jd5f matplotlib.font_manager[2874] DEBUG findfont: score(FontEntry(fname='/home/runner/micromamba/envs/trajan/lib/python3.14/site-packages/matplotlib/mpl-data/fonts/ttf/STIXNonUniBolIta.ttf', index=0, name='STIXNonUnicode', style='italic', variant='normal', weight=700, stretch='normal', size='scalable')) = 11.335
2026-07-21 14:55:57 runnervm3jd5f matplotlib.font_manager[2874] DEBUG findfont: score(FontEntry(fname='/home/runner/micromamba/envs/trajan/lib/python3.14/site-packages/matplotlib/mpl-data/fonts/ttf/DejaVuSerifDisplay.ttf', index=0, name='DejaVu Serif Display', style='normal', variant='normal', weight=400, stretch='normal', size='scalable')) = 10.05
2026-07-21 14:55:57 runnervm3jd5f matplotlib.font_manager[2874] DEBUG findfont: score(FontEntry(fname='/home/runner/micromamba/envs/trajan/lib/python3.14/site-packages/matplotlib/mpl-data/fonts/ttf/cmss10.ttf', index=0, name='cmss10', style='normal', variant='normal', weight=400, stretch='normal', size='scalable')) = 10.05
2026-07-21 14:55:57 runnervm3jd5f matplotlib.font_manager[2874] DEBUG findfont: score(FontEntry(fname='/home/runner/micromamba/envs/trajan/lib/python3.14/site-packages/matplotlib/mpl-data/fonts/ttf/STIXGeneralBolIta.ttf', index=0, name='STIXGeneral', style='italic', variant='normal', weight=700, stretch='normal', size='scalable')) = 11.335
2026-07-21 14:55:57 runnervm3jd5f matplotlib.font_manager[2874] DEBUG findfont: score(FontEntry(fname='/home/runner/micromamba/envs/trajan/lib/python3.14/site-packages/matplotlib/mpl-data/fonts/ttf/cmtt10.ttf', index=0, name='cmtt10', style='normal', variant='normal', weight=400, stretch='normal', size='scalable')) = 10.05
2026-07-21 14:55:57 runnervm3jd5f matplotlib.font_manager[2874] DEBUG findfont: score(FontEntry(fname='/home/runner/micromamba/envs/trajan/lib/python3.14/site-packages/matplotlib/mpl-data/fonts/ttf/cmsy10.ttf', index=0, name='cmsy10', style='normal', variant='normal', weight=400, stretch='normal', size='scalable')) = 10.05
2026-07-21 14:55:57 runnervm3jd5f matplotlib.font_manager[2874] DEBUG findfont: score(FontEntry(fname='/home/runner/micromamba/envs/trajan/lib/python3.14/site-packages/matplotlib/mpl-data/fonts/ttf/DejaVuSansMono-Oblique.ttf', index=0, name='DejaVu Sans Mono', style='oblique', variant='normal', weight=400, stretch='normal', size='scalable')) = 11.05
2026-07-21 14:55:57 runnervm3jd5f matplotlib.font_manager[2874] DEBUG findfont: score(FontEntry(fname='/home/runner/micromamba/envs/trajan/lib/python3.14/site-packages/matplotlib/mpl-data/fonts/ttf/STIXNonUniIta.ttf', index=0, name='STIXNonUnicode', style='italic', variant='normal', weight=400, stretch='normal', size='scalable')) = 11.05
2026-07-21 14:55:57 runnervm3jd5f matplotlib.font_manager[2874] DEBUG findfont: score(FontEntry(fname='/home/runner/micromamba/envs/trajan/lib/python3.14/site-packages/matplotlib/mpl-data/fonts/ttf/STIXGeneral.ttf', index=0, name='STIXGeneral', style='normal', variant='normal', weight=400, stretch='normal', size='scalable')) = 10.05
2026-07-21 14:55:57 runnervm3jd5f matplotlib.font_manager[2874] DEBUG findfont: score(FontEntry(fname='/home/runner/micromamba/envs/trajan/lib/python3.14/site-packages/matplotlib/mpl-data/fonts/ttf/cmti10.ttf', index=0, name='cmti10', style='normal', variant='normal', weight=400, stretch='normal', size='scalable')) = 10.05
2026-07-21 14:55:57 runnervm3jd5f matplotlib.font_manager[2874] DEBUG findfont: score(FontEntry(fname='/home/runner/micromamba/envs/trajan/lib/python3.14/site-packages/matplotlib/mpl-data/fonts/ttf/DejaVuSansMono-BoldOblique.ttf', index=0, name='DejaVu Sans Mono', style='oblique', variant='normal', weight=700, stretch='normal', size='scalable')) = 11.335
2026-07-21 14:55:57 runnervm3jd5f matplotlib.font_manager[2874] DEBUG findfont: score(FontEntry(fname='/home/runner/micromamba/envs/trajan/lib/python3.14/site-packages/matplotlib/mpl-data/fonts/ttf/DejaVuSerif.ttf', index=0, name='DejaVu Serif', style='normal', variant='normal', weight=400, stretch='normal', size='scalable')) = 10.05
2026-07-21 14:55:57 runnervm3jd5f matplotlib.font_manager[2874] DEBUG findfont: score(FontEntry(fname='/home/runner/micromamba/envs/trajan/lib/python3.14/site-packages/matplotlib/mpl-data/fonts/ttf/LastResortHE-Regular.ttf', index=0, name='Last Resort High-Efficiency', style='normal', variant='normal', weight=400, stretch='normal', size='scalable')) = 10.05
2026-07-21 14:55:57 runnervm3jd5f matplotlib.font_manager[2874] DEBUG findfont: score(FontEntry(fname='/home/runner/micromamba/envs/trajan/lib/python3.14/site-packages/matplotlib/mpl-data/fonts/ttf/cmex10.ttf', index=0, name='cmex10', style='normal', variant='normal', weight=400, stretch='normal', size='scalable')) = 10.05
2026-07-21 14:55:57 runnervm3jd5f matplotlib.font_manager[2874] DEBUG findfont: score(FontEntry(fname='/home/runner/micromamba/envs/trajan/lib/python3.14/site-packages/matplotlib/mpl-data/fonts/ttf/STIXSizFiveSymReg.ttf', index=0, name='STIXSizeFiveSym', style='normal', variant='normal', weight=400, stretch='normal', size='scalable')) = 10.05
2026-07-21 14:55:57 runnervm3jd5f matplotlib.font_manager[2874] DEBUG findfont: score(FontEntry(fname='/home/runner/micromamba/envs/trajan/lib/python3.14/site-packages/matplotlib/mpl-data/fonts/ttf/STIXNonUniBol.ttf', index=0, name='STIXNonUnicode', style='normal', variant='normal', weight=700, stretch='normal', size='scalable')) = 10.335
2026-07-21 14:55:57 runnervm3jd5f matplotlib.font_manager[2874] DEBUG findfont: score(FontEntry(fname='/home/runner/micromamba/envs/trajan/lib/python3.14/site-packages/matplotlib/mpl-data/fonts/ttf/DejaVuSansDisplay.ttf', index=0, name='DejaVu Sans Display', style='normal', variant='normal', weight=400, stretch='normal', size='scalable')) = 10.05
2026-07-21 14:55:57 runnervm3jd5f matplotlib.font_manager[2874] DEBUG findfont: score(FontEntry(fname='/home/runner/micromamba/envs/trajan/lib/python3.14/site-packages/matplotlib/mpl-data/fonts/ttf/DejaVuSansMono.ttf', index=0, name='DejaVu Sans Mono', style='normal', variant='normal', weight=400, stretch='normal', size='scalable')) = 10.05
2026-07-21 14:55:57 runnervm3jd5f matplotlib.font_manager[2874] DEBUG findfont: score(FontEntry(fname='/home/runner/micromamba/envs/trajan/lib/python3.14/site-packages/matplotlib/mpl-data/fonts/ttf/cmb10.ttf', index=0, name='cmb10', style='normal', variant='normal', weight=400, stretch='normal', size='scalable')) = 10.05
2026-07-21 14:55:57 runnervm3jd5f matplotlib.font_manager[2874] DEBUG findfont: score(FontEntry(fname='/home/runner/micromamba/envs/trajan/lib/python3.14/site-packages/matplotlib/mpl-data/fonts/ttf/STIXSizTwoSymReg.ttf', index=0, name='STIXSizeTwoSym', style='normal', variant='normal', weight=400, stretch='normal', size='scalable')) = 10.05
2026-07-21 14:55:57 runnervm3jd5f matplotlib.font_manager[2874] DEBUG findfont: score(FontEntry(fname='/home/runner/micromamba/envs/trajan/lib/python3.14/site-packages/matplotlib/mpl-data/fonts/ttf/DejaVuSans.ttf', index=0, name='DejaVu Sans', style='normal', variant='normal', weight=400, stretch='normal', size='scalable')) = 10.05
2026-07-21 14:55:57 runnervm3jd5f matplotlib.font_manager[2874] DEBUG findfont: score(FontEntry(fname='/home/runner/micromamba/envs/trajan/lib/python3.14/site-packages/matplotlib/mpl-data/fonts/ttf/STIXNonUni.ttf', index=0, name='STIXNonUnicode', style='normal', variant='normal', weight=400, stretch='normal', size='scalable')) = 10.05
2026-07-21 14:55:57 runnervm3jd5f matplotlib.font_manager[2874] DEBUG findfont: score(FontEntry(fname='/home/runner/micromamba/envs/trajan/lib/python3.14/site-packages/matplotlib/mpl-data/fonts/ttf/STIXGeneralItalic.ttf', index=0, name='STIXGeneral', style='italic', variant='normal', weight=400, stretch='normal', size='scalable')) = 11.05
2026-07-21 14:55:57 runnervm3jd5f matplotlib.font_manager[2874] DEBUG findfont: score(FontEntry(fname='/home/runner/micromamba/envs/trajan/lib/python3.14/site-packages/matplotlib/mpl-data/fonts/ttf/STIXSizOneSymBol.ttf', index=0, name='STIXSizeOneSym', style='normal', variant='normal', weight=700, stretch='normal', size='scalable')) = 10.335
2026-07-21 14:55:57 runnervm3jd5f matplotlib.font_manager[2874] DEBUG findfont: score(FontEntry(fname='/home/runner/micromamba/envs/trajan/lib/python3.14/site-packages/matplotlib/mpl-data/fonts/ttf/DejaVuSansMono-Bold.ttf', index=0, name='DejaVu Sans Mono', style='normal', variant='normal', weight=700, stretch='normal', size='scalable')) = 10.335
2026-07-21 14:55:57 runnervm3jd5f matplotlib.font_manager[2874] DEBUG findfont: score(FontEntry(fname='/home/runner/micromamba/envs/trajan/lib/python3.14/site-packages/matplotlib/mpl-data/fonts/ttf/STIXSizTwoSymBol.ttf', index=0, name='STIXSizeTwoSym', style='normal', variant='normal', weight=700, stretch='normal', size='scalable')) = 10.335
2026-07-21 14:55:57 runnervm3jd5f matplotlib.font_manager[2874] DEBUG findfont: score(FontEntry(fname='/home/runner/micromamba/envs/trajan/lib/python3.14/site-packages/matplotlib/mpl-data/fonts/ttf/STIXSizThreeSymBol.ttf', index=0, name='STIXSizeThreeSym', style='normal', variant='normal', weight=700, stretch='normal', size='scalable')) = 10.335
2026-07-21 14:55:57 runnervm3jd5f matplotlib.font_manager[2874] DEBUG findfont: score(FontEntry(fname='/home/runner/micromamba/envs/trajan/lib/python3.14/site-packages/matplotlib/mpl-data/fonts/ttf/DejaVuSerif-BoldItalic.ttf', index=0, name='DejaVu Serif', style='italic', variant='normal', weight=700, stretch='normal', size='scalable')) = 11.335
2026-07-21 14:55:57 runnervm3jd5f matplotlib.font_manager[2874] DEBUG findfont: score(FontEntry(fname='/home/runner/micromamba/envs/trajan/lib/python3.14/site-packages/matplotlib/mpl-data/fonts/ttf/DejaVuSerif-Italic.ttf', index=0, name='DejaVu Serif', style='italic', variant='normal', weight=400, stretch='normal', size='scalable')) = 11.05
2026-07-21 14:55:57 runnervm3jd5f matplotlib.font_manager[2874] DEBUG findfont: score(FontEntry(fname='/home/runner/micromamba/envs/trajan/lib/python3.14/site-packages/matplotlib/mpl-data/fonts/ttf/DejaVuSans-Bold.ttf', index=0, name='DejaVu Sans', style='normal', variant='normal', weight=700, stretch='normal', size='scalable')) = 10.335
2026-07-21 14:55:57 runnervm3jd5f matplotlib.font_manager[2874] DEBUG findfont: score(FontEntry(fname='/home/runner/micromamba/envs/trajan/lib/python3.14/site-packages/matplotlib/mpl-data/fonts/ttf/STIXSizFourSymBol.ttf', index=0, name='STIXSizeFourSym', style='normal', variant='normal', weight=700, stretch='normal', size='scalable')) = 10.335
2026-07-21 14:55:57 runnervm3jd5f matplotlib.font_manager[2874] DEBUG findfont: score(FontEntry(fname='/home/runner/micromamba/envs/trajan/lib/python3.14/site-packages/matplotlib/mpl-data/fonts/ttf/STIXSizOneSymReg.ttf', index=0, name='STIXSizeOneSym', style='normal', variant='normal', weight=400, stretch='normal', size='scalable')) = 10.05
2026-07-21 14:55:57 runnervm3jd5f matplotlib.font_manager[2874] DEBUG findfont: score(FontEntry(fname='/home/runner/micromamba/envs/trajan/lib/python3.14/site-packages/matplotlib/mpl-data/fonts/ttf/cmr10.ttf', index=0, name='cmr10', style='normal', variant='normal', weight=400, stretch='normal', size='scalable')) = 10.05
2026-07-21 14:55:57 runnervm3jd5f matplotlib.font_manager[2874] DEBUG findfont: score(FontEntry(fname='/home/runner/micromamba/envs/trajan/lib/python3.14/site-packages/matplotlib/mpl-data/fonts/ttf/STIXGeneralBol.ttf', index=0, name='STIXGeneral', style='normal', variant='normal', weight=700, stretch='normal', size='scalable')) = 10.335
2026-07-21 14:55:57 runnervm3jd5f matplotlib.font_manager[2874] DEBUG findfont: score(FontEntry(fname='/home/runner/micromamba/envs/trajan/lib/python3.14/site-packages/matplotlib/mpl-data/fonts/ttf/DejaVuSans-BoldOblique.ttf', index=0, name='DejaVu Sans', style='oblique', variant='normal', weight=700, stretch='normal', size='scalable')) = 11.335
2026-07-21 14:55:57 runnervm3jd5f matplotlib.font_manager[2874] DEBUG findfont: score(FontEntry(fname='/home/runner/micromamba/envs/trajan/lib/python3.14/site-packages/matplotlib/mpl-data/fonts/ttf/STIXSizFourSymReg.ttf', index=0, name='STIXSizeFourSym', style='normal', variant='normal', weight=400, stretch='normal', size='scalable')) = 10.05
2026-07-21 14:55:57 runnervm3jd5f matplotlib.font_manager[2874] DEBUG findfont: score(FontEntry(fname='/usr/share/fonts/truetype/lato/Lato-Black.ttf', index=0, name='Lato', style='normal', variant='normal', weight=900, stretch='normal', size='scalable')) = 10.525
2026-07-21 14:55:57 runnervm3jd5f matplotlib.font_manager[2874] DEBUG findfont: score(FontEntry(fname='/usr/share/fonts/truetype/lato/Lato-Black.ttf', index=0, name='Lato Black', style='normal', variant='normal', weight=400, stretch='normal', size='scalable')) = 10.05
2026-07-21 14:55:57 runnervm3jd5f matplotlib.font_manager[2874] DEBUG findfont: score(FontEntry(fname='/usr/share/fonts/truetype/liberation/LiberationSerif-Regular.ttf', index=0, name='Liberation Serif', style='normal', variant='normal', weight=400, stretch='normal', size='scalable')) = 10.05
2026-07-21 14:55:57 runnervm3jd5f matplotlib.font_manager[2874] DEBUG findfont: score(FontEntry(fname='/usr/share/fonts/truetype/dejavu/DejaVuSerifCondensed.ttf', index=0, name='DejaVu Serif', style='normal', variant='normal', weight=400, stretch='condensed', size='scalable')) = 10.25
2026-07-21 14:55:57 runnervm3jd5f matplotlib.font_manager[2874] DEBUG findfont: score(FontEntry(fname='/usr/share/fonts/truetype/dejavu/DejaVuSerifCondensed.ttf', index=0, name='DejaVu Serif Condensed', style='normal', variant='normal', weight=380, stretch='condensed', size='scalable')) = 10.269
2026-07-21 14:55:57 runnervm3jd5f matplotlib.font_manager[2874] DEBUG findfont: score(FontEntry(fname='/home/runner/micromamba/envs/trajan/fonts/UbuntuMono-BI.ttf', index=0, name='Ubuntu Mono', style='italic', variant='normal', weight=700, stretch='normal', size='scalable')) = 11.335
2026-07-21 14:55:57 runnervm3jd5f matplotlib.font_manager[2874] DEBUG findfont: score(FontEntry(fname='/usr/share/fonts/truetype/dejavu/DejaVuSans.ttf', index=0, name='DejaVu Sans', style='normal', variant='normal', weight=400, stretch='normal', size='scalable')) = 10.05
2026-07-21 14:55:57 runnervm3jd5f matplotlib.font_manager[2874] DEBUG findfont: score(FontEntry(fname='/usr/share/fonts/truetype/lato/Lato-Italic.ttf', index=0, name='Lato', style='italic', variant='normal', weight=400, stretch='normal', size='scalable')) = 11.05
2026-07-21 14:55:57 runnervm3jd5f matplotlib.font_manager[2874] DEBUG findfont: score(FontEntry(fname='/usr/share/fonts/truetype/liberation/LiberationSans-Italic.ttf', index=0, name='Liberation Sans', style='italic', variant='normal', weight=400, stretch='normal', size='scalable')) = 11.05
2026-07-21 14:55:57 runnervm3jd5f matplotlib.font_manager[2874] DEBUG findfont: score(FontEntry(fname='/home/runner/micromamba/envs/trajan/fonts/Ubuntu-B.ttf', index=0, name='Ubuntu', style='normal', variant='normal', weight=700, stretch='normal', size='scalable')) = 10.335
2026-07-21 14:55:57 runnervm3jd5f matplotlib.font_manager[2874] DEBUG findfont: score(FontEntry(fname='/home/runner/micromamba/envs/trajan/fonts/SourceCodePro-Semibold.ttf', index=0, name='Source Code Pro', style='normal', variant='normal', weight=600, stretch='normal', size='scalable')) = 10.24
2026-07-21 14:55:57 runnervm3jd5f matplotlib.font_manager[2874] DEBUG findfont: score(FontEntry(fname='/home/runner/micromamba/envs/trajan/fonts/SourceCodePro-Semibold.ttf', index=0, name='Source Code Pro Semibold', style='normal', variant='normal', weight=400, stretch='normal', size='scalable')) = 10.05
2026-07-21 14:55:57 runnervm3jd5f matplotlib.font_manager[2874] DEBUG findfont: score(FontEntry(fname='/home/runner/micromamba/envs/trajan/fonts/SourceCodePro-Bold.ttf', index=0, name='Source Code Pro', style='normal', variant='normal', weight=700, stretch='normal', size='scalable')) = 10.335
2026-07-21 14:55:57 runnervm3jd5f matplotlib.font_manager[2874] DEBUG findfont: score(FontEntry(fname='/home/runner/micromamba/envs/trajan/fonts/Ubuntu-MI.ttf', index=0, name='Ubuntu', style='italic', variant='normal', weight=500, stretch='normal', size='scalable')) = 11.145
2026-07-21 14:55:57 runnervm3jd5f matplotlib.font_manager[2874] DEBUG findfont: score(FontEntry(fname='/home/runner/micromamba/envs/trajan/fonts/Ubuntu-MI.ttf', index=0, name='Ubuntu Light', style='italic', variant='normal', weight=700, stretch='normal', size='scalable')) = 11.335
2026-07-21 14:55:57 runnervm3jd5f matplotlib.font_manager[2874] DEBUG findfont: score(FontEntry(fname='/usr/share/fonts/truetype/lato/Lato-Regular.ttf', index=0, name='Lato', style='normal', variant='normal', weight=400, stretch='normal', size='scalable')) = 10.05
2026-07-21 14:55:57 runnervm3jd5f matplotlib.font_manager[2874] DEBUG findfont: score(FontEntry(fname='/usr/share/fonts/truetype/lato/Lato-ThinItalic.ttf', index=0, name='Lato', style='italic', variant='normal', weight=275, stretch='normal', size='scalable')) = 11.16875
2026-07-21 14:55:57 runnervm3jd5f matplotlib.font_manager[2874] DEBUG findfont: score(FontEntry(fname='/usr/share/fonts/truetype/lato/Lato-ThinItalic.ttf', index=0, name='Lato Thin', style='italic', variant='normal', weight=400, stretch='normal', size='scalable')) = 11.05
2026-07-21 14:55:57 runnervm3jd5f matplotlib.font_manager[2874] DEBUG findfont: score(FontEntry(fname='/usr/share/fonts/truetype/lato/Lato-BlackItalic.ttf', index=0, name='Lato', style='italic', variant='normal', weight=900, stretch='normal', size='scalable')) = 11.525
2026-07-21 14:55:57 runnervm3jd5f matplotlib.font_manager[2874] DEBUG findfont: score(FontEntry(fname='/usr/share/fonts/truetype/lato/Lato-BlackItalic.ttf', index=0, name='Lato Black', style='italic', variant='normal', weight=400, stretch='normal', size='scalable')) = 11.05
2026-07-21 14:55:57 runnervm3jd5f matplotlib.font_manager[2874] DEBUG findfont: score(FontEntry(fname='/usr/share/fonts/truetype/dejavu/DejaVuSerifCondensed-Italic.ttf', index=0, name='DejaVu Serif', style='italic', variant='normal', weight=400, stretch='condensed', size='scalable')) = 11.25
2026-07-21 14:55:57 runnervm3jd5f matplotlib.font_manager[2874] DEBUG findfont: score(FontEntry(fname='/usr/share/fonts/truetype/dejavu/DejaVuSerifCondensed-Italic.ttf', index=0, name='DejaVu Serif Condensed', style='italic', variant='normal', weight=400, stretch='condensed', size='scalable')) = 11.25
2026-07-21 14:55:57 runnervm3jd5f matplotlib.font_manager[2874] DEBUG findfont: score(FontEntry(fname='/usr/share/fonts/truetype/dejavu/DejaVuSans-Bold.ttf', index=0, name='DejaVu Sans', style='normal', variant='normal', weight=700, stretch='normal', size='scalable')) = 10.335
2026-07-21 14:55:57 runnervm3jd5f matplotlib.font_manager[2874] DEBUG findfont: score(FontEntry(fname='/home/runner/micromamba/envs/trajan/fonts/UbuntuMono-R.ttf', index=0, name='Ubuntu Mono', style='normal', variant='normal', weight=400, stretch='normal', size='scalable')) = 10.05
2026-07-21 14:55:57 runnervm3jd5f matplotlib.font_manager[2874] DEBUG findfont: score(FontEntry(fname='/usr/share/fonts/truetype/dejavu/DejaVuSerif-BoldItalic.ttf', index=0, name='DejaVu Serif', style='italic', variant='normal', weight=700, stretch='normal', size='scalable')) = 11.335
2026-07-21 14:55:57 runnervm3jd5f matplotlib.font_manager[2874] DEBUG findfont: score(FontEntry(fname='/usr/share/fonts/truetype/lato/Lato-Hairline.ttf', index=0, name='Lato', style='normal', variant='normal', weight=250, stretch='normal', size='scalable')) = 10.1925
2026-07-21 14:55:57 runnervm3jd5f matplotlib.font_manager[2874] DEBUG findfont: score(FontEntry(fname='/usr/share/fonts/truetype/lato/Lato-Hairline.ttf', index=0, name='Lato Hairline', style='normal', variant='normal', weight=400, stretch='normal', size='scalable')) = 10.05
2026-07-21 14:55:57 runnervm3jd5f matplotlib.font_manager[2874] DEBUG findfont: score(FontEntry(fname='/usr/share/fonts/truetype/lato/Lato-LightItalic.ttf', index=0, name='Lato', style='italic', variant='normal', weight=300, stretch='normal', size='scalable')) = 11.145
2026-07-21 14:55:57 runnervm3jd5f matplotlib.font_manager[2874] DEBUG findfont: score(FontEntry(fname='/usr/share/fonts/truetype/lato/Lato-LightItalic.ttf', index=0, name='Lato Light', style='italic', variant='normal', weight=400, stretch='normal', size='scalable')) = 11.05
2026-07-21 14:55:57 runnervm3jd5f matplotlib.font_manager[2874] DEBUG findfont: score(FontEntry(fname='/usr/share/fonts/truetype/dejavu/DejaVuSansCondensed-BoldOblique.ttf', index=0, name='DejaVu Sans', style='oblique', variant='normal', weight=700, stretch='condensed', size='scalable')) = 11.535
2026-07-21 14:55:57 runnervm3jd5f matplotlib.font_manager[2874] DEBUG findfont: score(FontEntry(fname='/usr/share/fonts/truetype/dejavu/DejaVuSansCondensed-BoldOblique.ttf', index=0, name='DejaVu Sans Condensed', style='oblique', variant='normal', weight=700, stretch='condensed', size='scalable')) = 11.535
2026-07-21 14:55:57 runnervm3jd5f matplotlib.font_manager[2874] DEBUG findfont: score(FontEntry(fname='/home/runner/micromamba/envs/trajan/fonts/SourceCodePro-It.ttf', index=0, name='Source Code Pro', style='italic', variant='normal', weight=400, stretch='normal', size='scalable')) = 11.05
2026-07-21 14:55:57 runnervm3jd5f matplotlib.font_manager[2874] DEBUG findfont: score(FontEntry(fname='/home/runner/micromamba/envs/trajan/fonts/SourceCodePro-ExtraLightIt.ttf', index=0, name='Source Code Pro', style='italic', variant='normal', weight=200, stretch='normal', size='scalable')) = 11.24
2026-07-21 14:55:57 runnervm3jd5f matplotlib.font_manager[2874] DEBUG findfont: score(FontEntry(fname='/home/runner/micromamba/envs/trajan/fonts/SourceCodePro-ExtraLightIt.ttf', index=0, name='Source Code Pro ExtraLight', style='italic', variant='normal', weight=400, stretch='normal', size='scalable')) = 11.05
2026-07-21 14:55:57 runnervm3jd5f matplotlib.font_manager[2874] DEBUG findfont: score(FontEntry(fname='/usr/share/fonts/truetype/lato/Lato-Medium.ttf', index=0, name='Lato', style='normal', variant='normal', weight=500, stretch='normal', size='scalable')) = 10.145
2026-07-21 14:55:57 runnervm3jd5f matplotlib.font_manager[2874] DEBUG findfont: score(FontEntry(fname='/usr/share/fonts/truetype/lato/Lato-Medium.ttf', index=0, name='Lato Medium', style='normal', variant='normal', weight=400, stretch='normal', size='scalable')) = 10.05
2026-07-21 14:55:57 runnervm3jd5f matplotlib.font_manager[2874] DEBUG findfont: score(FontEntry(fname='/usr/share/fonts/truetype/lato/Lato-BoldItalic.ttf', index=0, name='Lato', style='italic', variant='normal', weight=700, stretch='normal', size='scalable')) = 11.335
2026-07-21 14:55:57 runnervm3jd5f matplotlib.font_manager[2874] DEBUG findfont: score(FontEntry(fname='/home/runner/micromamba/envs/trajan/fonts/DejaVuSans.ttf', index=0, name='DejaVu Sans', style='normal', variant='normal', weight=400, stretch='normal', size='scalable')) = 10.05
2026-07-21 14:55:57 runnervm3jd5f matplotlib.font_manager[2874] DEBUG findfont: score(FontEntry(fname='/home/runner/micromamba/envs/trajan/fonts/UbuntuMono-B.ttf', index=0, name='Ubuntu Mono', style='normal', variant='normal', weight=700, stretch='normal', size='scalable')) = 10.335
2026-07-21 14:55:57 runnervm3jd5f matplotlib.font_manager[2874] DEBUG findfont: score(FontEntry(fname='/home/runner/micromamba/envs/trajan/fonts/SourceCodePro-LightIt.ttf', index=0, name='Source Code Pro', style='italic', variant='normal', weight=300, stretch='normal', size='scalable')) = 11.145
2026-07-21 14:55:57 runnervm3jd5f matplotlib.font_manager[2874] DEBUG findfont: score(FontEntry(fname='/home/runner/micromamba/envs/trajan/fonts/SourceCodePro-LightIt.ttf', index=0, name='Source Code Pro Light', style='italic', variant='normal', weight=400, stretch='normal', size='scalable')) = 11.05
2026-07-21 14:55:57 runnervm3jd5f matplotlib.font_manager[2874] DEBUG findfont: score(FontEntry(fname='/usr/share/fonts/truetype/liberation/LiberationSans-BoldItalic.ttf', index=0, name='Liberation Sans', style='italic', variant='normal', weight=700, stretch='normal', size='scalable')) = 11.335
2026-07-21 14:55:57 runnervm3jd5f matplotlib.font_manager[2874] DEBUG findfont: score(FontEntry(fname='/usr/share/fonts/truetype/liberation/LiberationSans-Regular.ttf', index=0, name='Liberation Sans', style='normal', variant='normal', weight=400, stretch='normal', size='scalable')) = 10.05
2026-07-21 14:55:57 runnervm3jd5f matplotlib.font_manager[2874] DEBUG findfont: score(FontEntry(fname='/usr/share/fonts/truetype/dejavu/DejaVuSansMono-Bold.ttf', index=0, name='DejaVu Sans Mono', style='normal', variant='normal', weight=700, stretch='normal', size='scalable')) = 10.335
2026-07-21 14:55:57 runnervm3jd5f matplotlib.font_manager[2874] DEBUG findfont: score(FontEntry(fname='/home/runner/micromamba/envs/trajan/fonts/SourceCodePro-BoldIt.ttf', index=0, name='Source Code Pro', style='italic', variant='normal', weight=700, stretch='normal', size='scalable')) = 11.335
2026-07-21 14:55:57 runnervm3jd5f matplotlib.font_manager[2874] DEBUG findfont: score(FontEntry(fname='/usr/share/fonts/truetype/lato/Lato-Bold.ttf', index=0, name='Lato', style='normal', variant='normal', weight=700, stretch='normal', size='scalable')) = 10.335
2026-07-21 14:55:57 runnervm3jd5f matplotlib.font_manager[2874] DEBUG findfont: score(FontEntry(fname='/usr/share/fonts/truetype/dejavu/DejaVuSansCondensed.ttf', index=0, name='DejaVu Sans', style='normal', variant='normal', weight=400, stretch='condensed', size='scalable')) = 10.25
2026-07-21 14:55:57 runnervm3jd5f matplotlib.font_manager[2874] DEBUG findfont: score(FontEntry(fname='/usr/share/fonts/truetype/dejavu/DejaVuSansCondensed.ttf', index=0, name='DejaVu Sans Condensed', style='normal', variant='normal', weight=380, stretch='condensed', size='scalable')) = 10.269
2026-07-21 14:55:57 runnervm3jd5f matplotlib.font_manager[2874] DEBUG findfont: score(FontEntry(fname='/usr/share/fonts/truetype/lato/Lato-MediumItalic.ttf', index=0, name='Lato', style='italic', variant='normal', weight=500, stretch='normal', size='scalable')) = 11.145
2026-07-21 14:55:57 runnervm3jd5f matplotlib.font_manager[2874] DEBUG findfont: score(FontEntry(fname='/usr/share/fonts/truetype/lato/Lato-MediumItalic.ttf', index=0, name='Lato Medium', style='italic', variant='normal', weight=400, stretch='normal', size='scalable')) = 11.05
2026-07-21 14:55:57 runnervm3jd5f matplotlib.font_manager[2874] DEBUG findfont: score(FontEntry(fname='/usr/share/fonts/truetype/liberation/LiberationSans-Bold.ttf', index=0, name='Liberation Sans', style='normal', variant='normal', weight=700, stretch='normal', size='scalable')) = 10.335
2026-07-21 14:55:57 runnervm3jd5f matplotlib.font_manager[2874] DEBUG findfont: score(FontEntry(fname='/usr/share/fonts/truetype/dejavu/DejaVuSerifCondensed-BoldItalic.ttf', index=0, name='DejaVu Serif', style='italic', variant='normal', weight=700, stretch='condensed', size='scalable')) = 11.535
2026-07-21 14:55:57 runnervm3jd5f matplotlib.font_manager[2874] DEBUG findfont: score(FontEntry(fname='/usr/share/fonts/truetype/dejavu/DejaVuSerifCondensed-BoldItalic.ttf', index=0, name='DejaVu Serif Condensed', style='italic', variant='normal', weight=700, stretch='condensed', size='scalable')) = 11.535
2026-07-21 14:55:57 runnervm3jd5f matplotlib.font_manager[2874] DEBUG findfont: score(FontEntry(fname='/home/runner/micromamba/envs/trajan/fonts/Ubuntu-R.ttf', index=0, name='Ubuntu', style='normal', variant='normal', weight=400, stretch='normal', size='scalable')) = 10.05
2026-07-21 14:55:57 runnervm3jd5f matplotlib.font_manager[2874] DEBUG findfont: score(FontEntry(fname='/usr/share/fonts/truetype/lato/Lato-Light.ttf', index=0, name='Lato', style='normal', variant='normal', weight=300, stretch='normal', size='scalable')) = 10.145
2026-07-21 14:55:57 runnervm3jd5f matplotlib.font_manager[2874] DEBUG findfont: score(FontEntry(fname='/usr/share/fonts/truetype/lato/Lato-Light.ttf', index=0, name='Lato Light', style='normal', variant='normal', weight=400, stretch='normal', size='scalable')) = 10.05
2026-07-21 14:55:57 runnervm3jd5f matplotlib.font_manager[2874] DEBUG findfont: score(FontEntry(fname='/usr/share/fonts/truetype/liberation/LiberationSerif-BoldItalic.ttf', index=0, name='Liberation Serif', style='italic', variant='normal', weight=700, stretch='normal', size='scalable')) = 11.335
2026-07-21 14:55:57 runnervm3jd5f matplotlib.font_manager[2874] DEBUG findfont: score(FontEntry(fname='/home/runner/micromamba/envs/trajan/fonts/Ubuntu-Th.ttf', index=0, name='Ubuntu', style='normal', variant='normal', weight=250, stretch='normal', size='scalable')) = 10.1925
2026-07-21 14:55:57 runnervm3jd5f matplotlib.font_manager[2874] DEBUG findfont: score(FontEntry(fname='/home/runner/micromamba/envs/trajan/fonts/Ubuntu-Th.ttf', index=0, name='Ubuntu Thin', style='normal', variant='normal', weight=400, stretch='normal', size='scalable')) = 10.05
2026-07-21 14:55:57 runnervm3jd5f matplotlib.font_manager[2874] DEBUG findfont: score(FontEntry(fname='/home/runner/micromamba/envs/trajan/fonts/SourceCodePro-ExtraLight.ttf', index=0, name='Source Code Pro', style='normal', variant='normal', weight=200, stretch='normal', size='scalable')) = 10.24
2026-07-21 14:55:57 runnervm3jd5f matplotlib.font_manager[2874] DEBUG findfont: score(FontEntry(fname='/home/runner/micromamba/envs/trajan/fonts/SourceCodePro-ExtraLight.ttf', index=0, name='Source Code Pro ExtraLight', style='normal', variant='normal', weight=400, stretch='normal', size='scalable')) = 10.05
2026-07-21 14:55:57 runnervm3jd5f matplotlib.font_manager[2874] DEBUG findfont: score(FontEntry(fname='/usr/share/fonts/truetype/lato/Lato-Thin.ttf', index=0, name='Lato', style='normal', variant='normal', weight=275, stretch='normal', size='scalable')) = 10.16875
2026-07-21 14:55:57 runnervm3jd5f matplotlib.font_manager[2874] DEBUG findfont: score(FontEntry(fname='/usr/share/fonts/truetype/lato/Lato-Thin.ttf', index=0, name='Lato Thin', style='normal', variant='normal', weight=400, stretch='normal', size='scalable')) = 10.05
2026-07-21 14:55:57 runnervm3jd5f matplotlib.font_manager[2874] DEBUG findfont: score(FontEntry(fname='/usr/share/fonts/truetype/liberation/LiberationSerif-Bold.ttf', index=0, name='Liberation Serif', style='normal', variant='normal', weight=700, stretch='normal', size='scalable')) = 10.335
2026-07-21 14:55:57 runnervm3jd5f matplotlib.font_manager[2874] DEBUG findfont: score(FontEntry(fname='/home/runner/micromamba/envs/trajan/fonts/Inconsolata-Regular.ttf', index=0, name='Inconsolata', style='normal', variant='normal', weight=400, stretch='normal', size='scalable')) = 10.05
2026-07-21 14:55:57 runnervm3jd5f matplotlib.font_manager[2874] DEBUG findfont: score(FontEntry(fname='/home/runner/micromamba/envs/trajan/fonts/Ubuntu-C.ttf', index=0, name='Ubuntu Condensed', style='normal', variant='normal', weight=400, stretch='condensed', size='scalable')) = 10.25
2026-07-21 14:55:57 runnervm3jd5f matplotlib.font_manager[2874] DEBUG findfont: score(FontEntry(fname='/usr/share/fonts/truetype/dejavu/DejaVuSansCondensed-Bold.ttf', index=0, name='DejaVu Sans', style='normal', variant='normal', weight=700, stretch='condensed', size='scalable')) = 10.535
2026-07-21 14:55:57 runnervm3jd5f matplotlib.font_manager[2874] DEBUG findfont: score(FontEntry(fname='/usr/share/fonts/truetype/dejavu/DejaVuSansCondensed-Bold.ttf', index=0, name='DejaVu Sans Condensed', style='normal', variant='normal', weight=700, stretch='condensed', size='scalable')) = 10.535
2026-07-21 14:55:57 runnervm3jd5f matplotlib.font_manager[2874] DEBUG findfont: score(FontEntry(fname='/usr/share/fonts/truetype/liberation/LiberationMono-Bold.ttf', index=0, name='Liberation Mono', style='normal', variant='normal', weight=700, stretch='normal', size='scalable')) = 10.335
2026-07-21 14:55:57 runnervm3jd5f matplotlib.font_manager[2874] DEBUG findfont: score(FontEntry(fname='/home/runner/micromamba/envs/trajan/fonts/SourceCodePro-Black.ttf', index=0, name='Source Code Pro', style='normal', variant='normal', weight=900, stretch='normal', size='scalable')) = 10.525
2026-07-21 14:55:57 runnervm3jd5f matplotlib.font_manager[2874] DEBUG findfont: score(FontEntry(fname='/home/runner/micromamba/envs/trajan/fonts/SourceCodePro-Black.ttf', index=0, name='Source Code Pro Black', style='normal', variant='normal', weight=400, stretch='normal', size='scalable')) = 10.05
2026-07-21 14:55:57 runnervm3jd5f matplotlib.font_manager[2874] DEBUG findfont: score(FontEntry(fname='/home/runner/micromamba/envs/trajan/fonts/SourceCodePro-BlackIt.ttf', index=0, name='Source Code Pro', style='italic', variant='normal', weight=900, stretch='normal', size='scalable')) = 11.525
2026-07-21 14:55:57 runnervm3jd5f matplotlib.font_manager[2874] DEBUG findfont: score(FontEntry(fname='/home/runner/micromamba/envs/trajan/fonts/SourceCodePro-BlackIt.ttf', index=0, name='Source Code Pro Black', style='italic', variant='normal', weight=400, stretch='normal', size='scalable')) = 11.05
2026-07-21 14:55:57 runnervm3jd5f matplotlib.font_manager[2874] DEBUG findfont: score(FontEntry(fname='/home/runner/micromamba/envs/trajan/fonts/Ubuntu-LI.ttf', index=0, name='Ubuntu', style='italic', variant='normal', weight=300, stretch='normal', size='scalable')) = 11.145
2026-07-21 14:55:57 runnervm3jd5f matplotlib.font_manager[2874] DEBUG findfont: score(FontEntry(fname='/home/runner/micromamba/envs/trajan/fonts/Ubuntu-LI.ttf', index=0, name='Ubuntu Light', style='italic', variant='normal', weight=400, stretch='normal', size='scalable')) = 11.05
2026-07-21 14:55:57 runnervm3jd5f matplotlib.font_manager[2874] DEBUG findfont: score(FontEntry(fname='/usr/share/fonts/truetype/liberation/LiberationMono-Regular.ttf', index=0, name='Liberation Mono', style='normal', variant='normal', weight=400, stretch='normal', size='scalable')) = 10.05
2026-07-21 14:55:57 runnervm3jd5f matplotlib.font_manager[2874] DEBUG findfont: score(FontEntry(fname='/home/runner/micromamba/envs/trajan/fonts/UbuntuMono-RI.ttf', index=0, name='Ubuntu Mono', style='italic', variant='normal', weight=400, stretch='normal', size='scalable')) = 11.05
2026-07-21 14:55:57 runnervm3jd5f matplotlib.font_manager[2874] DEBUG findfont: score(FontEntry(fname='/usr/share/fonts/truetype/lato/Lato-Heavy.ttf', index=0, name='Lato', style='normal', variant='normal', weight=800, stretch='normal', size='scalable')) = 10.43
2026-07-21 14:55:57 runnervm3jd5f matplotlib.font_manager[2874] DEBUG findfont: score(FontEntry(fname='/usr/share/fonts/truetype/lato/Lato-Heavy.ttf', index=0, name='Lato Heavy', style='normal', variant='normal', weight=400, stretch='normal', size='scalable')) = 10.05
2026-07-21 14:55:57 runnervm3jd5f matplotlib.font_manager[2874] DEBUG findfont: score(FontEntry(fname='/usr/share/fonts/truetype/lato/Lato-HairlineItalic.ttf', index=0, name='Lato', style='italic', variant='normal', weight=250, stretch='normal', size='scalable')) = 11.1925
2026-07-21 14:55:57 runnervm3jd5f matplotlib.font_manager[2874] DEBUG findfont: score(FontEntry(fname='/usr/share/fonts/truetype/lato/Lato-HairlineItalic.ttf', index=0, name='Lato Hairline', style='italic', variant='normal', weight=400, stretch='normal', size='scalable')) = 11.05
2026-07-21 14:55:57 runnervm3jd5f matplotlib.font_manager[2874] DEBUG findfont: score(FontEntry(fname='/usr/share/fonts/truetype/dejavu/DejaVuSerifCondensed-Bold.ttf', index=0, name='DejaVu Serif', style='normal', variant='normal', weight=700, stretch='condensed', size='scalable')) = 10.535
2026-07-21 14:55:57 runnervm3jd5f matplotlib.font_manager[2874] DEBUG findfont: score(FontEntry(fname='/usr/share/fonts/truetype/dejavu/DejaVuSerifCondensed-Bold.ttf', index=0, name='DejaVu Serif Condensed', style='normal', variant='normal', weight=700, stretch='condensed', size='scalable')) = 10.535
2026-07-21 14:55:57 runnervm3jd5f matplotlib.font_manager[2874] DEBUG findfont: score(FontEntry(fname='/usr/share/fonts/truetype/dejavu/DejaVuSansCondensed-Oblique.ttf', index=0, name='DejaVu Sans', style='oblique', variant='normal', weight=400, stretch='condensed', size='scalable')) = 11.25
2026-07-21 14:55:57 runnervm3jd5f matplotlib.font_manager[2874] DEBUG findfont: score(FontEntry(fname='/usr/share/fonts/truetype/dejavu/DejaVuSansCondensed-Oblique.ttf', index=0, name='DejaVu Sans Condensed', style='oblique', variant='normal', weight=400, stretch='condensed', size='scalable')) = 11.25
2026-07-21 14:55:57 runnervm3jd5f matplotlib.font_manager[2874] DEBUG findfont: score(FontEntry(fname='/usr/share/fonts/truetype/lato/Lato-SemiboldItalic.ttf', index=0, name='Lato', style='italic', variant='normal', weight=600, stretch='normal', size='scalable')) = 11.24
2026-07-21 14:55:57 runnervm3jd5f matplotlib.font_manager[2874] DEBUG findfont: score(FontEntry(fname='/usr/share/fonts/truetype/lato/Lato-SemiboldItalic.ttf', index=0, name='Lato Semibold', style='italic', variant='normal', weight=400, stretch='normal', size='scalable')) = 11.05
2026-07-21 14:55:57 runnervm3jd5f matplotlib.font_manager[2874] DEBUG findfont: score(FontEntry(fname='/usr/share/fonts/truetype/lato/Lato-Semibold.ttf', index=0, name='Lato', style='normal', variant='normal', weight=600, stretch='normal', size='scalable')) = 10.24
2026-07-21 14:55:57 runnervm3jd5f matplotlib.font_manager[2874] DEBUG findfont: score(FontEntry(fname='/usr/share/fonts/truetype/lato/Lato-Semibold.ttf', index=0, name='Lato Semibold', style='normal', variant='normal', weight=400, stretch='normal', size='scalable')) = 10.05
2026-07-21 14:55:57 runnervm3jd5f matplotlib.font_manager[2874] DEBUG findfont: score(FontEntry(fname='/home/runner/micromamba/envs/trajan/fonts/Inconsolata-Bold.ttf', index=0, name='Inconsolata', style='normal', variant='normal', weight=700, stretch='normal', size='scalable')) = 10.335
2026-07-21 14:55:57 runnervm3jd5f matplotlib.font_manager[2874] DEBUG findfont: score(FontEntry(fname='/usr/share/fonts/truetype/dejavu/DejaVuSans-ExtraLight.ttf', index=0, name='DejaVu Sans', style='normal', variant='normal', weight=200, stretch='normal', size='scalable')) = 10.24
2026-07-21 14:55:57 runnervm3jd5f matplotlib.font_manager[2874] DEBUG findfont: score(FontEntry(fname='/usr/share/fonts/truetype/dejavu/DejaVuSans-ExtraLight.ttf', index=0, name='DejaVu Sans Light', style='normal', variant='normal', weight=200, stretch='normal', size='scalable')) = 10.24
2026-07-21 14:55:57 runnervm3jd5f matplotlib.font_manager[2874] DEBUG findfont: score(FontEntry(fname='/home/runner/micromamba/envs/trajan/fonts/Ubuntu-BI.ttf', index=0, name='Ubuntu', style='italic', variant='normal', weight=700, stretch='normal', size='scalable')) = 11.335
2026-07-21 14:55:57 runnervm3jd5f matplotlib.font_manager[2874] DEBUG findfont: score(FontEntry(fname='/usr/share/fonts/truetype/dejavu/DejaVuSans-BoldOblique.ttf', index=0, name='DejaVu Sans', style='oblique', variant='normal', weight=700, stretch='normal', size='scalable')) = 11.335
2026-07-21 14:55:57 runnervm3jd5f matplotlib.font_manager[2874] DEBUG findfont: score(FontEntry(fname='/home/runner/micromamba/envs/trajan/fonts/Ubuntu-RI.ttf', index=0, name='Ubuntu', style='italic', variant='normal', weight=400, stretch='normal', size='scalable')) = 11.05
2026-07-21 14:55:57 runnervm3jd5f matplotlib.font_manager[2874] DEBUG findfont: score(FontEntry(fname='/usr/share/fonts/truetype/dejavu/DejaVuSerif-Italic.ttf', index=0, name='DejaVu Serif', style='italic', variant='normal', weight=400, stretch='normal', size='scalable')) = 11.05
2026-07-21 14:55:57 runnervm3jd5f matplotlib.font_manager[2874] DEBUG findfont: score(FontEntry(fname='/home/runner/micromamba/envs/trajan/fonts/SourceCodePro-Medium.ttf', index=0, name='Source Code Pro', style='normal', variant='normal', weight=500, stretch='normal', size='scalable')) = 10.145
2026-07-21 14:55:57 runnervm3jd5f matplotlib.font_manager[2874] DEBUG findfont: score(FontEntry(fname='/home/runner/micromamba/envs/trajan/fonts/SourceCodePro-Medium.ttf', index=0, name='Source Code Pro Medium', style='normal', variant='normal', weight=400, stretch='normal', size='scalable')) = 10.05
2026-07-21 14:55:57 runnervm3jd5f matplotlib.font_manager[2874] DEBUG findfont: score(FontEntry(fname='/usr/share/fonts/truetype/lato/Lato-HeavyItalic.ttf', index=0, name='Lato', style='italic', variant='normal', weight=800, stretch='normal', size='scalable')) = 11.43
2026-07-21 14:55:57 runnervm3jd5f matplotlib.font_manager[2874] DEBUG findfont: score(FontEntry(fname='/usr/share/fonts/truetype/lato/Lato-HeavyItalic.ttf', index=0, name='Lato Heavy', style='italic', variant='normal', weight=400, stretch='normal', size='scalable')) = 11.05
2026-07-21 14:55:57 runnervm3jd5f matplotlib.font_manager[2874] DEBUG findfont: score(FontEntry(fname='/usr/share/fonts/truetype/dejavu/DejaVuSans-Oblique.ttf', index=0, name='DejaVu Sans', style='oblique', variant='normal', weight=400, stretch='normal', size='scalable')) = 11.05
2026-07-21 14:55:57 runnervm3jd5f matplotlib.font_manager[2874] DEBUG findfont: score(FontEntry(fname='/home/runner/micromamba/envs/trajan/fonts/Ubuntu-M.ttf', index=0, name='Ubuntu', style='normal', variant='normal', weight=500, stretch='normal', size='scalable')) = 10.145
2026-07-21 14:55:57 runnervm3jd5f matplotlib.font_manager[2874] DEBUG findfont: score(FontEntry(fname='/home/runner/micromamba/envs/trajan/fonts/Ubuntu-M.ttf', index=0, name='Ubuntu Light', style='normal', variant='normal', weight=700, stretch='normal', size='scalable')) = 10.335
2026-07-21 14:55:57 runnervm3jd5f matplotlib.font_manager[2874] DEBUG findfont: score(FontEntry(fname='/usr/share/fonts/truetype/liberation/LiberationMono-BoldItalic.ttf', index=0, name='Liberation Mono', style='italic', variant='normal', weight=700, stretch='normal', size='scalable')) = 11.335
2026-07-21 14:55:57 runnervm3jd5f matplotlib.font_manager[2874] DEBUG findfont: score(FontEntry(fname='/usr/share/fonts/truetype/dejavu/DejaVuSansMono.ttf', index=0, name='DejaVu Sans Mono', style='normal', variant='normal', weight=400, stretch='normal', size='scalable')) = 10.05
2026-07-21 14:55:57 runnervm3jd5f matplotlib.font_manager[2874] DEBUG findfont: score(FontEntry(fname='/usr/share/fonts/truetype/dejavu/DejaVuMathTeXGyre.ttf', index=0, name='DejaVu Math TeX Gyre', style='normal', variant='normal', weight=400, stretch='normal', size='scalable')) = 10.05
2026-07-21 14:55:57 runnervm3jd5f matplotlib.font_manager[2874] DEBUG findfont: score(FontEntry(fname='/usr/share/fonts/truetype/dejavu/DejaVuSansMono-Oblique.ttf', index=0, name='DejaVu Sans Mono', style='oblique', variant='normal', weight=400, stretch='normal', size='scalable')) = 11.05
2026-07-21 14:55:57 runnervm3jd5f matplotlib.font_manager[2874] DEBUG findfont: score(FontEntry(fname='/home/runner/micromamba/envs/trajan/fonts/Ubuntu-L.ttf', index=0, name='Ubuntu', style='normal', variant='normal', weight=300, stretch='normal', size='scalable')) = 10.145
2026-07-21 14:55:57 runnervm3jd5f matplotlib.font_manager[2874] DEBUG findfont: score(FontEntry(fname='/home/runner/micromamba/envs/trajan/fonts/Ubuntu-L.ttf', index=0, name='Ubuntu Light', style='normal', variant='normal', weight=400, stretch='normal', size='scalable')) = 10.05
2026-07-21 14:55:57 runnervm3jd5f matplotlib.font_manager[2874] DEBUG findfont: score(FontEntry(fname='/home/runner/micromamba/envs/trajan/fonts/SourceCodePro-MediumIt.ttf', index=0, name='Source Code Pro', style='italic', variant='normal', weight=500, stretch='normal', size='scalable')) = 11.145
2026-07-21 14:55:57 runnervm3jd5f matplotlib.font_manager[2874] DEBUG findfont: score(FontEntry(fname='/home/runner/micromamba/envs/trajan/fonts/SourceCodePro-MediumIt.ttf', index=0, name='Source Code Pro Medium', style='italic', variant='normal', weight=400, stretch='normal', size='scalable')) = 11.05
2026-07-21 14:55:57 runnervm3jd5f matplotlib.font_manager[2874] DEBUG findfont: score(FontEntry(fname='/home/runner/micromamba/envs/trajan/fonts/SourceCodePro-Regular.ttf', index=0, name='Source Code Pro', style='normal', variant='normal', weight=400, stretch='normal', size='scalable')) = 10.05
2026-07-21 14:55:57 runnervm3jd5f matplotlib.font_manager[2874] DEBUG findfont: score(FontEntry(fname='/home/runner/micromamba/envs/trajan/fonts/SourceCodePro-SemiboldIt.ttf', index=0, name='Source Code Pro', style='italic', variant='normal', weight=600, stretch='normal', size='scalable')) = 11.24
2026-07-21 14:55:57 runnervm3jd5f matplotlib.font_manager[2874] DEBUG findfont: score(FontEntry(fname='/home/runner/micromamba/envs/trajan/fonts/SourceCodePro-SemiboldIt.ttf', index=0, name='Source Code Pro Semibold', style='italic', variant='normal', weight=400, stretch='normal', size='scalable')) = 11.05
2026-07-21 14:55:57 runnervm3jd5f matplotlib.font_manager[2874] DEBUG findfont: score(FontEntry(fname='/usr/share/fonts/truetype/dejavu/DejaVuSerif.ttf', index=0, name='DejaVu Serif', style='normal', variant='normal', weight=400, stretch='normal', size='scalable')) = 10.05
2026-07-21 14:55:57 runnervm3jd5f matplotlib.font_manager[2874] DEBUG findfont: score(FontEntry(fname='/usr/share/fonts/truetype/dejavu/DejaVuSerif-Bold.ttf', index=0, name='DejaVu Serif', style='normal', variant='normal', weight=700, stretch='normal', size='scalable')) = 10.335
2026-07-21 14:55:57 runnervm3jd5f matplotlib.font_manager[2874] DEBUG findfont: score(FontEntry(fname='/usr/share/fonts/truetype/liberation/LiberationSerif-Italic.ttf', index=0, name='Liberation Serif', style='italic', variant='normal', weight=400, stretch='normal', size='scalable')) = 11.05
2026-07-21 14:55:57 runnervm3jd5f matplotlib.font_manager[2874] DEBUG findfont: score(FontEntry(fname='/usr/share/fonts/truetype/dejavu/DejaVuSansMono-BoldOblique.ttf', index=0, name='DejaVu Sans Mono', style='oblique', variant='normal', weight=700, stretch='normal', size='scalable')) = 11.335
2026-07-21 14:55:57 runnervm3jd5f matplotlib.font_manager[2874] DEBUG findfont: score(FontEntry(fname='/home/runner/micromamba/envs/trajan/fonts/SourceCodePro-Light.ttf', index=0, name='Source Code Pro', style='normal', variant='normal', weight=300, stretch='normal', size='scalable')) = 10.145
2026-07-21 14:55:57 runnervm3jd5f matplotlib.font_manager[2874] DEBUG findfont: score(FontEntry(fname='/home/runner/micromamba/envs/trajan/fonts/SourceCodePro-Light.ttf', index=0, name='Source Code Pro Light', style='normal', variant='normal', weight=400, stretch='normal', size='scalable')) = 10.05
2026-07-21 14:55:57 runnervm3jd5f matplotlib.font_manager[2874] DEBUG findfont: score(FontEntry(fname='/usr/share/fonts/truetype/liberation/LiberationMono-Italic.ttf', index=0, name='Liberation Mono', style='italic', variant='normal', weight=400, stretch='normal', size='scalable')) = 11.05
2026-07-21 14:55:57 runnervm3jd5f matplotlib.font_manager[2874] DEBUG findfont: Matching cmmi10:style=normal:variant=normal:weight=normal:stretch=normal:size=10.0 to cmmi10 ('/home/runner/micromamba/envs/trajan/lib/python3.14/site-packages/matplotlib/mpl-data/fonts/ttf/cmmi10.ttf') with score of 0.050000.
2026-07-21 14:55:57 runnervm3jd5f matplotlib.font_manager[2874] DEBUG findfont: Matching cmsy10:style=normal:variant=normal:weight=normal:stretch=normal:size=10.0.
2026-07-21 14:55:57 runnervm3jd5f matplotlib.font_manager[2874] DEBUG findfont: score(FontEntry(fname='/home/runner/micromamba/envs/trajan/lib/python3.14/site-packages/matplotlib/mpl-data/fonts/ttf/cmmi10.ttf', index=0, name='cmmi10', style='normal', variant='normal', weight=400, stretch='normal', size='scalable')) = 10.05
2026-07-21 14:55:57 runnervm3jd5f matplotlib.font_manager[2874] DEBUG findfont: score(FontEntry(fname='/home/runner/micromamba/envs/trajan/lib/python3.14/site-packages/matplotlib/mpl-data/fonts/ttf/DejaVuSerif-Bold.ttf', index=0, name='DejaVu Serif', style='normal', variant='normal', weight=700, stretch='normal', size='scalable')) = 10.335
2026-07-21 14:55:57 runnervm3jd5f matplotlib.font_manager[2874] DEBUG findfont: score(FontEntry(fname='/home/runner/micromamba/envs/trajan/lib/python3.14/site-packages/matplotlib/mpl-data/fonts/ttf/DejaVuSans-Oblique.ttf', index=0, name='DejaVu Sans', style='oblique', variant='normal', weight=400, stretch='normal', size='scalable')) = 11.05
2026-07-21 14:55:57 runnervm3jd5f matplotlib.font_manager[2874] DEBUG findfont: score(FontEntry(fname='/home/runner/micromamba/envs/trajan/lib/python3.14/site-packages/matplotlib/mpl-data/fonts/ttf/STIXSizThreeSymReg.ttf', index=0, name='STIXSizeThreeSym', style='normal', variant='normal', weight=400, stretch='normal', size='scalable')) = 10.05
2026-07-21 14:55:57 runnervm3jd5f matplotlib.font_manager[2874] DEBUG findfont: score(FontEntry(fname='/home/runner/micromamba/envs/trajan/lib/python3.14/site-packages/matplotlib/mpl-data/fonts/ttf/STIXNonUniBolIta.ttf', index=0, name='STIXNonUnicode', style='italic', variant='normal', weight=700, stretch='normal', size='scalable')) = 11.335
2026-07-21 14:55:57 runnervm3jd5f matplotlib.font_manager[2874] DEBUG findfont: score(FontEntry(fname='/home/runner/micromamba/envs/trajan/lib/python3.14/site-packages/matplotlib/mpl-data/fonts/ttf/DejaVuSerifDisplay.ttf', index=0, name='DejaVu Serif Display', style='normal', variant='normal', weight=400, stretch='normal', size='scalable')) = 10.05
2026-07-21 14:55:57 runnervm3jd5f matplotlib.font_manager[2874] DEBUG findfont: score(FontEntry(fname='/home/runner/micromamba/envs/trajan/lib/python3.14/site-packages/matplotlib/mpl-data/fonts/ttf/cmss10.ttf', index=0, name='cmss10', style='normal', variant='normal', weight=400, stretch='normal', size='scalable')) = 10.05
2026-07-21 14:55:57 runnervm3jd5f matplotlib.font_manager[2874] DEBUG findfont: score(FontEntry(fname='/home/runner/micromamba/envs/trajan/lib/python3.14/site-packages/matplotlib/mpl-data/fonts/ttf/STIXGeneralBolIta.ttf', index=0, name='STIXGeneral', style='italic', variant='normal', weight=700, stretch='normal', size='scalable')) = 11.335
2026-07-21 14:55:57 runnervm3jd5f matplotlib.font_manager[2874] DEBUG findfont: score(FontEntry(fname='/home/runner/micromamba/envs/trajan/lib/python3.14/site-packages/matplotlib/mpl-data/fonts/ttf/cmtt10.ttf', index=0, name='cmtt10', style='normal', variant='normal', weight=400, stretch='normal', size='scalable')) = 10.05
2026-07-21 14:55:57 runnervm3jd5f matplotlib.font_manager[2874] DEBUG findfont: score(FontEntry(fname='/home/runner/micromamba/envs/trajan/lib/python3.14/site-packages/matplotlib/mpl-data/fonts/ttf/cmsy10.ttf', index=0, name='cmsy10', style='normal', variant='normal', weight=400, stretch='normal', size='scalable')) = 0.05
2026-07-21 14:55:57 runnervm3jd5f matplotlib.font_manager[2874] DEBUG findfont: score(FontEntry(fname='/home/runner/micromamba/envs/trajan/lib/python3.14/site-packages/matplotlib/mpl-data/fonts/ttf/DejaVuSansMono-Oblique.ttf', index=0, name='DejaVu Sans Mono', style='oblique', variant='normal', weight=400, stretch='normal', size='scalable')) = 11.05
2026-07-21 14:55:57 runnervm3jd5f matplotlib.font_manager[2874] DEBUG findfont: score(FontEntry(fname='/home/runner/micromamba/envs/trajan/lib/python3.14/site-packages/matplotlib/mpl-data/fonts/ttf/STIXNonUniIta.ttf', index=0, name='STIXNonUnicode', style='italic', variant='normal', weight=400, stretch='normal', size='scalable')) = 11.05
2026-07-21 14:55:57 runnervm3jd5f matplotlib.font_manager[2874] DEBUG findfont: score(FontEntry(fname='/home/runner/micromamba/envs/trajan/lib/python3.14/site-packages/matplotlib/mpl-data/fonts/ttf/STIXGeneral.ttf', index=0, name='STIXGeneral', style='normal', variant='normal', weight=400, stretch='normal', size='scalable')) = 10.05
2026-07-21 14:55:57 runnervm3jd5f matplotlib.font_manager[2874] DEBUG findfont: score(FontEntry(fname='/home/runner/micromamba/envs/trajan/lib/python3.14/site-packages/matplotlib/mpl-data/fonts/ttf/cmti10.ttf', index=0, name='cmti10', style='normal', variant='normal', weight=400, stretch='normal', size='scalable')) = 10.05
2026-07-21 14:55:57 runnervm3jd5f matplotlib.font_manager[2874] DEBUG findfont: score(FontEntry(fname='/home/runner/micromamba/envs/trajan/lib/python3.14/site-packages/matplotlib/mpl-data/fonts/ttf/DejaVuSansMono-BoldOblique.ttf', index=0, name='DejaVu Sans Mono', style='oblique', variant='normal', weight=700, stretch='normal', size='scalable')) = 11.335
2026-07-21 14:55:57 runnervm3jd5f matplotlib.font_manager[2874] DEBUG findfont: score(FontEntry(fname='/home/runner/micromamba/envs/trajan/lib/python3.14/site-packages/matplotlib/mpl-data/fonts/ttf/DejaVuSerif.ttf', index=0, name='DejaVu Serif', style='normal', variant='normal', weight=400, stretch='normal', size='scalable')) = 10.05
2026-07-21 14:55:57 runnervm3jd5f matplotlib.font_manager[2874] DEBUG findfont: score(FontEntry(fname='/home/runner/micromamba/envs/trajan/lib/python3.14/site-packages/matplotlib/mpl-data/fonts/ttf/LastResortHE-Regular.ttf', index=0, name='Last Resort High-Efficiency', style='normal', variant='normal', weight=400, stretch='normal', size='scalable')) = 10.05
2026-07-21 14:55:57 runnervm3jd5f matplotlib.font_manager[2874] DEBUG findfont: score(FontEntry(fname='/home/runner/micromamba/envs/trajan/lib/python3.14/site-packages/matplotlib/mpl-data/fonts/ttf/cmex10.ttf', index=0, name='cmex10', style='normal', variant='normal', weight=400, stretch='normal', size='scalable')) = 10.05
2026-07-21 14:55:57 runnervm3jd5f matplotlib.font_manager[2874] DEBUG findfont: score(FontEntry(fname='/home/runner/micromamba/envs/trajan/lib/python3.14/site-packages/matplotlib/mpl-data/fonts/ttf/STIXSizFiveSymReg.ttf', index=0, name='STIXSizeFiveSym', style='normal', variant='normal', weight=400, stretch='normal', size='scalable')) = 10.05
2026-07-21 14:55:57 runnervm3jd5f matplotlib.font_manager[2874] DEBUG findfont: score(FontEntry(fname='/home/runner/micromamba/envs/trajan/lib/python3.14/site-packages/matplotlib/mpl-data/fonts/ttf/STIXNonUniBol.ttf', index=0, name='STIXNonUnicode', style='normal', variant='normal', weight=700, stretch='normal', size='scalable')) = 10.335
2026-07-21 14:55:57 runnervm3jd5f matplotlib.font_manager[2874] DEBUG findfont: score(FontEntry(fname='/home/runner/micromamba/envs/trajan/lib/python3.14/site-packages/matplotlib/mpl-data/fonts/ttf/DejaVuSansDisplay.ttf', index=0, name='DejaVu Sans Display', style='normal', variant='normal', weight=400, stretch='normal', size='scalable')) = 10.05
2026-07-21 14:55:57 runnervm3jd5f matplotlib.font_manager[2874] DEBUG findfont: score(FontEntry(fname='/home/runner/micromamba/envs/trajan/lib/python3.14/site-packages/matplotlib/mpl-data/fonts/ttf/DejaVuSansMono.ttf', index=0, name='DejaVu Sans Mono', style='normal', variant='normal', weight=400, stretch='normal', size='scalable')) = 10.05
2026-07-21 14:55:57 runnervm3jd5f matplotlib.font_manager[2874] DEBUG findfont: score(FontEntry(fname='/home/runner/micromamba/envs/trajan/lib/python3.14/site-packages/matplotlib/mpl-data/fonts/ttf/cmb10.ttf', index=0, name='cmb10', style='normal', variant='normal', weight=400, stretch='normal', size='scalable')) = 10.05
2026-07-21 14:55:57 runnervm3jd5f matplotlib.font_manager[2874] DEBUG findfont: score(FontEntry(fname='/home/runner/micromamba/envs/trajan/lib/python3.14/site-packages/matplotlib/mpl-data/fonts/ttf/STIXSizTwoSymReg.ttf', index=0, name='STIXSizeTwoSym', style='normal', variant='normal', weight=400, stretch='normal', size='scalable')) = 10.05
2026-07-21 14:55:57 runnervm3jd5f matplotlib.font_manager[2874] DEBUG findfont: score(FontEntry(fname='/home/runner/micromamba/envs/trajan/lib/python3.14/site-packages/matplotlib/mpl-data/fonts/ttf/DejaVuSans.ttf', index=0, name='DejaVu Sans', style='normal', variant='normal', weight=400, stretch='normal', size='scalable')) = 10.05
2026-07-21 14:55:57 runnervm3jd5f matplotlib.font_manager[2874] DEBUG findfont: score(FontEntry(fname='/home/runner/micromamba/envs/trajan/lib/python3.14/site-packages/matplotlib/mpl-data/fonts/ttf/STIXNonUni.ttf', index=0, name='STIXNonUnicode', style='normal', variant='normal', weight=400, stretch='normal', size='scalable')) = 10.05
2026-07-21 14:55:57 runnervm3jd5f matplotlib.font_manager[2874] DEBUG findfont: score(FontEntry(fname='/home/runner/micromamba/envs/trajan/lib/python3.14/site-packages/matplotlib/mpl-data/fonts/ttf/STIXGeneralItalic.ttf', index=0, name='STIXGeneral', style='italic', variant='normal', weight=400, stretch='normal', size='scalable')) = 11.05
2026-07-21 14:55:57 runnervm3jd5f matplotlib.font_manager[2874] DEBUG findfont: score(FontEntry(fname='/home/runner/micromamba/envs/trajan/lib/python3.14/site-packages/matplotlib/mpl-data/fonts/ttf/STIXSizOneSymBol.ttf', index=0, name='STIXSizeOneSym', style='normal', variant='normal', weight=700, stretch='normal', size='scalable')) = 10.335
2026-07-21 14:55:57 runnervm3jd5f matplotlib.font_manager[2874] DEBUG findfont: score(FontEntry(fname='/home/runner/micromamba/envs/trajan/lib/python3.14/site-packages/matplotlib/mpl-data/fonts/ttf/DejaVuSansMono-Bold.ttf', index=0, name='DejaVu Sans Mono', style='normal', variant='normal', weight=700, stretch='normal', size='scalable')) = 10.335
2026-07-21 14:55:57 runnervm3jd5f matplotlib.font_manager[2874] DEBUG findfont: score(FontEntry(fname='/home/runner/micromamba/envs/trajan/lib/python3.14/site-packages/matplotlib/mpl-data/fonts/ttf/STIXSizTwoSymBol.ttf', index=0, name='STIXSizeTwoSym', style='normal', variant='normal', weight=700, stretch='normal', size='scalable')) = 10.335
2026-07-21 14:55:57 runnervm3jd5f matplotlib.font_manager[2874] DEBUG findfont: score(FontEntry(fname='/home/runner/micromamba/envs/trajan/lib/python3.14/site-packages/matplotlib/mpl-data/fonts/ttf/STIXSizThreeSymBol.ttf', index=0, name='STIXSizeThreeSym', style='normal', variant='normal', weight=700, stretch='normal', size='scalable')) = 10.335
2026-07-21 14:55:57 runnervm3jd5f matplotlib.font_manager[2874] DEBUG findfont: score(FontEntry(fname='/home/runner/micromamba/envs/trajan/lib/python3.14/site-packages/matplotlib/mpl-data/fonts/ttf/DejaVuSerif-BoldItalic.ttf', index=0, name='DejaVu Serif', style='italic', variant='normal', weight=700, stretch='normal', size='scalable')) = 11.335
2026-07-21 14:55:57 runnervm3jd5f matplotlib.font_manager[2874] DEBUG findfont: score(FontEntry(fname='/home/runner/micromamba/envs/trajan/lib/python3.14/site-packages/matplotlib/mpl-data/fonts/ttf/DejaVuSerif-Italic.ttf', index=0, name='DejaVu Serif', style='italic', variant='normal', weight=400, stretch='normal', size='scalable')) = 11.05
2026-07-21 14:55:57 runnervm3jd5f matplotlib.font_manager[2874] DEBUG findfont: score(FontEntry(fname='/home/runner/micromamba/envs/trajan/lib/python3.14/site-packages/matplotlib/mpl-data/fonts/ttf/DejaVuSans-Bold.ttf', index=0, name='DejaVu Sans', style='normal', variant='normal', weight=700, stretch='normal', size='scalable')) = 10.335
2026-07-21 14:55:57 runnervm3jd5f matplotlib.font_manager[2874] DEBUG findfont: score(FontEntry(fname='/home/runner/micromamba/envs/trajan/lib/python3.14/site-packages/matplotlib/mpl-data/fonts/ttf/STIXSizFourSymBol.ttf', index=0, name='STIXSizeFourSym', style='normal', variant='normal', weight=700, stretch='normal', size='scalable')) = 10.335
2026-07-21 14:55:57 runnervm3jd5f matplotlib.font_manager[2874] DEBUG findfont: score(FontEntry(fname='/home/runner/micromamba/envs/trajan/lib/python3.14/site-packages/matplotlib/mpl-data/fonts/ttf/STIXSizOneSymReg.ttf', index=0, name='STIXSizeOneSym', style='normal', variant='normal', weight=400, stretch='normal', size='scalable')) = 10.05
2026-07-21 14:55:57 runnervm3jd5f matplotlib.font_manager[2874] DEBUG findfont: score(FontEntry(fname='/home/runner/micromamba/envs/trajan/lib/python3.14/site-packages/matplotlib/mpl-data/fonts/ttf/cmr10.ttf', index=0, name='cmr10', style='normal', variant='normal', weight=400, stretch='normal', size='scalable')) = 10.05
2026-07-21 14:55:57 runnervm3jd5f matplotlib.font_manager[2874] DEBUG findfont: score(FontEntry(fname='/home/runner/micromamba/envs/trajan/lib/python3.14/site-packages/matplotlib/mpl-data/fonts/ttf/STIXGeneralBol.ttf', index=0, name='STIXGeneral', style='normal', variant='normal', weight=700, stretch='normal', size='scalable')) = 10.335
2026-07-21 14:55:57 runnervm3jd5f matplotlib.font_manager[2874] DEBUG findfont: score(FontEntry(fname='/home/runner/micromamba/envs/trajan/lib/python3.14/site-packages/matplotlib/mpl-data/fonts/ttf/DejaVuSans-BoldOblique.ttf', index=0, name='DejaVu Sans', style='oblique', variant='normal', weight=700, stretch='normal', size='scalable')) = 11.335
2026-07-21 14:55:57 runnervm3jd5f matplotlib.font_manager[2874] DEBUG findfont: score(FontEntry(fname='/home/runner/micromamba/envs/trajan/lib/python3.14/site-packages/matplotlib/mpl-data/fonts/ttf/STIXSizFourSymReg.ttf', index=0, name='STIXSizeFourSym', style='normal', variant='normal', weight=400, stretch='normal', size='scalable')) = 10.05
2026-07-21 14:55:57 runnervm3jd5f matplotlib.font_manager[2874] DEBUG findfont: score(FontEntry(fname='/usr/share/fonts/truetype/lato/Lato-Black.ttf', index=0, name='Lato', style='normal', variant='normal', weight=900, stretch='normal', size='scalable')) = 10.525
2026-07-21 14:55:57 runnervm3jd5f matplotlib.font_manager[2874] DEBUG findfont: score(FontEntry(fname='/usr/share/fonts/truetype/lato/Lato-Black.ttf', index=0, name='Lato Black', style='normal', variant='normal', weight=400, stretch='normal', size='scalable')) = 10.05
2026-07-21 14:55:57 runnervm3jd5f matplotlib.font_manager[2874] DEBUG findfont: score(FontEntry(fname='/usr/share/fonts/truetype/liberation/LiberationSerif-Regular.ttf', index=0, name='Liberation Serif', style='normal', variant='normal', weight=400, stretch='normal', size='scalable')) = 10.05
2026-07-21 14:55:57 runnervm3jd5f matplotlib.font_manager[2874] DEBUG findfont: score(FontEntry(fname='/usr/share/fonts/truetype/dejavu/DejaVuSerifCondensed.ttf', index=0, name='DejaVu Serif', style='normal', variant='normal', weight=400, stretch='condensed', size='scalable')) = 10.25
2026-07-21 14:55:57 runnervm3jd5f matplotlib.font_manager[2874] DEBUG findfont: score(FontEntry(fname='/usr/share/fonts/truetype/dejavu/DejaVuSerifCondensed.ttf', index=0, name='DejaVu Serif Condensed', style='normal', variant='normal', weight=380, stretch='condensed', size='scalable')) = 10.269
2026-07-21 14:55:57 runnervm3jd5f matplotlib.font_manager[2874] DEBUG findfont: score(FontEntry(fname='/home/runner/micromamba/envs/trajan/fonts/UbuntuMono-BI.ttf', index=0, name='Ubuntu Mono', style='italic', variant='normal', weight=700, stretch='normal', size='scalable')) = 11.335
2026-07-21 14:55:57 runnervm3jd5f matplotlib.font_manager[2874] DEBUG findfont: score(FontEntry(fname='/usr/share/fonts/truetype/dejavu/DejaVuSans.ttf', index=0, name='DejaVu Sans', style='normal', variant='normal', weight=400, stretch='normal', size='scalable')) = 10.05
2026-07-21 14:55:57 runnervm3jd5f matplotlib.font_manager[2874] DEBUG findfont: score(FontEntry(fname='/usr/share/fonts/truetype/lato/Lato-Italic.ttf', index=0, name='Lato', style='italic', variant='normal', weight=400, stretch='normal', size='scalable')) = 11.05
2026-07-21 14:55:57 runnervm3jd5f matplotlib.font_manager[2874] DEBUG findfont: score(FontEntry(fname='/usr/share/fonts/truetype/liberation/LiberationSans-Italic.ttf', index=0, name='Liberation Sans', style='italic', variant='normal', weight=400, stretch='normal', size='scalable')) = 11.05
2026-07-21 14:55:57 runnervm3jd5f matplotlib.font_manager[2874] DEBUG findfont: score(FontEntry(fname='/home/runner/micromamba/envs/trajan/fonts/Ubuntu-B.ttf', index=0, name='Ubuntu', style='normal', variant='normal', weight=700, stretch='normal', size='scalable')) = 10.335
2026-07-21 14:55:57 runnervm3jd5f matplotlib.font_manager[2874] DEBUG findfont: score(FontEntry(fname='/home/runner/micromamba/envs/trajan/fonts/SourceCodePro-Semibold.ttf', index=0, name='Source Code Pro', style='normal', variant='normal', weight=600, stretch='normal', size='scalable')) = 10.24
2026-07-21 14:55:57 runnervm3jd5f matplotlib.font_manager[2874] DEBUG findfont: score(FontEntry(fname='/home/runner/micromamba/envs/trajan/fonts/SourceCodePro-Semibold.ttf', index=0, name='Source Code Pro Semibold', style='normal', variant='normal', weight=400, stretch='normal', size='scalable')) = 10.05
2026-07-21 14:55:57 runnervm3jd5f matplotlib.font_manager[2874] DEBUG findfont: score(FontEntry(fname='/home/runner/micromamba/envs/trajan/fonts/SourceCodePro-Bold.ttf', index=0, name='Source Code Pro', style='normal', variant='normal', weight=700, stretch='normal', size='scalable')) = 10.335
2026-07-21 14:55:57 runnervm3jd5f matplotlib.font_manager[2874] DEBUG findfont: score(FontEntry(fname='/home/runner/micromamba/envs/trajan/fonts/Ubuntu-MI.ttf', index=0, name='Ubuntu', style='italic', variant='normal', weight=500, stretch='normal', size='scalable')) = 11.145
2026-07-21 14:55:57 runnervm3jd5f matplotlib.font_manager[2874] DEBUG findfont: score(FontEntry(fname='/home/runner/micromamba/envs/trajan/fonts/Ubuntu-MI.ttf', index=0, name='Ubuntu Light', style='italic', variant='normal', weight=700, stretch='normal', size='scalable')) = 11.335
2026-07-21 14:55:57 runnervm3jd5f matplotlib.font_manager[2874] DEBUG findfont: score(FontEntry(fname='/usr/share/fonts/truetype/lato/Lato-Regular.ttf', index=0, name='Lato', style='normal', variant='normal', weight=400, stretch='normal', size='scalable')) = 10.05
2026-07-21 14:55:57 runnervm3jd5f matplotlib.font_manager[2874] DEBUG findfont: score(FontEntry(fname='/usr/share/fonts/truetype/lato/Lato-ThinItalic.ttf', index=0, name='Lato', style='italic', variant='normal', weight=275, stretch='normal', size='scalable')) = 11.16875
2026-07-21 14:55:57 runnervm3jd5f matplotlib.font_manager[2874] DEBUG findfont: score(FontEntry(fname='/usr/share/fonts/truetype/lato/Lato-ThinItalic.ttf', index=0, name='Lato Thin', style='italic', variant='normal', weight=400, stretch='normal', size='scalable')) = 11.05
2026-07-21 14:55:57 runnervm3jd5f matplotlib.font_manager[2874] DEBUG findfont: score(FontEntry(fname='/usr/share/fonts/truetype/lato/Lato-BlackItalic.ttf', index=0, name='Lato', style='italic', variant='normal', weight=900, stretch='normal', size='scalable')) = 11.525
2026-07-21 14:55:57 runnervm3jd5f matplotlib.font_manager[2874] DEBUG findfont: score(FontEntry(fname='/usr/share/fonts/truetype/lato/Lato-BlackItalic.ttf', index=0, name='Lato Black', style='italic', variant='normal', weight=400, stretch='normal', size='scalable')) = 11.05
2026-07-21 14:55:57 runnervm3jd5f matplotlib.font_manager[2874] DEBUG findfont: score(FontEntry(fname='/usr/share/fonts/truetype/dejavu/DejaVuSerifCondensed-Italic.ttf', index=0, name='DejaVu Serif', style='italic', variant='normal', weight=400, stretch='condensed', size='scalable')) = 11.25
2026-07-21 14:55:57 runnervm3jd5f matplotlib.font_manager[2874] DEBUG findfont: score(FontEntry(fname='/usr/share/fonts/truetype/dejavu/DejaVuSerifCondensed-Italic.ttf', index=0, name='DejaVu Serif Condensed', style='italic', variant='normal', weight=400, stretch='condensed', size='scalable')) = 11.25
2026-07-21 14:55:57 runnervm3jd5f matplotlib.font_manager[2874] DEBUG findfont: score(FontEntry(fname='/usr/share/fonts/truetype/dejavu/DejaVuSans-Bold.ttf', index=0, name='DejaVu Sans', style='normal', variant='normal', weight=700, stretch='normal', size='scalable')) = 10.335
2026-07-21 14:55:57 runnervm3jd5f matplotlib.font_manager[2874] DEBUG findfont: score(FontEntry(fname='/home/runner/micromamba/envs/trajan/fonts/UbuntuMono-R.ttf', index=0, name='Ubuntu Mono', style='normal', variant='normal', weight=400, stretch='normal', size='scalable')) = 10.05
2026-07-21 14:55:57 runnervm3jd5f matplotlib.font_manager[2874] DEBUG findfont: score(FontEntry(fname='/usr/share/fonts/truetype/dejavu/DejaVuSerif-BoldItalic.ttf', index=0, name='DejaVu Serif', style='italic', variant='normal', weight=700, stretch='normal', size='scalable')) = 11.335
2026-07-21 14:55:57 runnervm3jd5f matplotlib.font_manager[2874] DEBUG findfont: score(FontEntry(fname='/usr/share/fonts/truetype/lato/Lato-Hairline.ttf', index=0, name='Lato', style='normal', variant='normal', weight=250, stretch='normal', size='scalable')) = 10.1925
2026-07-21 14:55:57 runnervm3jd5f matplotlib.font_manager[2874] DEBUG findfont: score(FontEntry(fname='/usr/share/fonts/truetype/lato/Lato-Hairline.ttf', index=0, name='Lato Hairline', style='normal', variant='normal', weight=400, stretch='normal', size='scalable')) = 10.05
2026-07-21 14:55:57 runnervm3jd5f matplotlib.font_manager[2874] DEBUG findfont: score(FontEntry(fname='/usr/share/fonts/truetype/lato/Lato-LightItalic.ttf', index=0, name='Lato', style='italic', variant='normal', weight=300, stretch='normal', size='scalable')) = 11.145
2026-07-21 14:55:57 runnervm3jd5f matplotlib.font_manager[2874] DEBUG findfont: score(FontEntry(fname='/usr/share/fonts/truetype/lato/Lato-LightItalic.ttf', index=0, name='Lato Light', style='italic', variant='normal', weight=400, stretch='normal', size='scalable')) = 11.05
2026-07-21 14:55:57 runnervm3jd5f matplotlib.font_manager[2874] DEBUG findfont: score(FontEntry(fname='/usr/share/fonts/truetype/dejavu/DejaVuSansCondensed-BoldOblique.ttf', index=0, name='DejaVu Sans', style='oblique', variant='normal', weight=700, stretch='condensed', size='scalable')) = 11.535
2026-07-21 14:55:57 runnervm3jd5f matplotlib.font_manager[2874] DEBUG findfont: score(FontEntry(fname='/usr/share/fonts/truetype/dejavu/DejaVuSansCondensed-BoldOblique.ttf', index=0, name='DejaVu Sans Condensed', style='oblique', variant='normal', weight=700, stretch='condensed', size='scalable')) = 11.535
2026-07-21 14:55:57 runnervm3jd5f matplotlib.font_manager[2874] DEBUG findfont: score(FontEntry(fname='/home/runner/micromamba/envs/trajan/fonts/SourceCodePro-It.ttf', index=0, name='Source Code Pro', style='italic', variant='normal', weight=400, stretch='normal', size='scalable')) = 11.05
2026-07-21 14:55:57 runnervm3jd5f matplotlib.font_manager[2874] DEBUG findfont: score(FontEntry(fname='/home/runner/micromamba/envs/trajan/fonts/SourceCodePro-ExtraLightIt.ttf', index=0, name='Source Code Pro', style='italic', variant='normal', weight=200, stretch='normal', size='scalable')) = 11.24
2026-07-21 14:55:57 runnervm3jd5f matplotlib.font_manager[2874] DEBUG findfont: score(FontEntry(fname='/home/runner/micromamba/envs/trajan/fonts/SourceCodePro-ExtraLightIt.ttf', index=0, name='Source Code Pro ExtraLight', style='italic', variant='normal', weight=400, stretch='normal', size='scalable')) = 11.05
2026-07-21 14:55:57 runnervm3jd5f matplotlib.font_manager[2874] DEBUG findfont: score(FontEntry(fname='/usr/share/fonts/truetype/lato/Lato-Medium.ttf', index=0, name='Lato', style='normal', variant='normal', weight=500, stretch='normal', size='scalable')) = 10.145
2026-07-21 14:55:57 runnervm3jd5f matplotlib.font_manager[2874] DEBUG findfont: score(FontEntry(fname='/usr/share/fonts/truetype/lato/Lato-Medium.ttf', index=0, name='Lato Medium', style='normal', variant='normal', weight=400, stretch='normal', size='scalable')) = 10.05
2026-07-21 14:55:57 runnervm3jd5f matplotlib.font_manager[2874] DEBUG findfont: score(FontEntry(fname='/usr/share/fonts/truetype/lato/Lato-BoldItalic.ttf', index=0, name='Lato', style='italic', variant='normal', weight=700, stretch='normal', size='scalable')) = 11.335
2026-07-21 14:55:57 runnervm3jd5f matplotlib.font_manager[2874] DEBUG findfont: score(FontEntry(fname='/home/runner/micromamba/envs/trajan/fonts/DejaVuSans.ttf', index=0, name='DejaVu Sans', style='normal', variant='normal', weight=400, stretch='normal', size='scalable')) = 10.05
2026-07-21 14:55:57 runnervm3jd5f matplotlib.font_manager[2874] DEBUG findfont: score(FontEntry(fname='/home/runner/micromamba/envs/trajan/fonts/UbuntuMono-B.ttf', index=0, name='Ubuntu Mono', style='normal', variant='normal', weight=700, stretch='normal', size='scalable')) = 10.335
2026-07-21 14:55:57 runnervm3jd5f matplotlib.font_manager[2874] DEBUG findfont: score(FontEntry(fname='/home/runner/micromamba/envs/trajan/fonts/SourceCodePro-LightIt.ttf', index=0, name='Source Code Pro', style='italic', variant='normal', weight=300, stretch='normal', size='scalable')) = 11.145
2026-07-21 14:55:57 runnervm3jd5f matplotlib.font_manager[2874] DEBUG findfont: score(FontEntry(fname='/home/runner/micromamba/envs/trajan/fonts/SourceCodePro-LightIt.ttf', index=0, name='Source Code Pro Light', style='italic', variant='normal', weight=400, stretch='normal', size='scalable')) = 11.05
2026-07-21 14:55:57 runnervm3jd5f matplotlib.font_manager[2874] DEBUG findfont: score(FontEntry(fname='/usr/share/fonts/truetype/liberation/LiberationSans-BoldItalic.ttf', index=0, name='Liberation Sans', style='italic', variant='normal', weight=700, stretch='normal', size='scalable')) = 11.335
2026-07-21 14:55:57 runnervm3jd5f matplotlib.font_manager[2874] DEBUG findfont: score(FontEntry(fname='/usr/share/fonts/truetype/liberation/LiberationSans-Regular.ttf', index=0, name='Liberation Sans', style='normal', variant='normal', weight=400, stretch='normal', size='scalable')) = 10.05
2026-07-21 14:55:57 runnervm3jd5f matplotlib.font_manager[2874] DEBUG findfont: score(FontEntry(fname='/usr/share/fonts/truetype/dejavu/DejaVuSansMono-Bold.ttf', index=0, name='DejaVu Sans Mono', style='normal', variant='normal', weight=700, stretch='normal', size='scalable')) = 10.335
2026-07-21 14:55:57 runnervm3jd5f matplotlib.font_manager[2874] DEBUG findfont: score(FontEntry(fname='/home/runner/micromamba/envs/trajan/fonts/SourceCodePro-BoldIt.ttf', index=0, name='Source Code Pro', style='italic', variant='normal', weight=700, stretch='normal', size='scalable')) = 11.335
2026-07-21 14:55:57 runnervm3jd5f matplotlib.font_manager[2874] DEBUG findfont: score(FontEntry(fname='/usr/share/fonts/truetype/lato/Lato-Bold.ttf', index=0, name='Lato', style='normal', variant='normal', weight=700, stretch='normal', size='scalable')) = 10.335
2026-07-21 14:55:57 runnervm3jd5f matplotlib.font_manager[2874] DEBUG findfont: score(FontEntry(fname='/usr/share/fonts/truetype/dejavu/DejaVuSansCondensed.ttf', index=0, name='DejaVu Sans', style='normal', variant='normal', weight=400, stretch='condensed', size='scalable')) = 10.25
2026-07-21 14:55:57 runnervm3jd5f matplotlib.font_manager[2874] DEBUG findfont: score(FontEntry(fname='/usr/share/fonts/truetype/dejavu/DejaVuSansCondensed.ttf', index=0, name='DejaVu Sans Condensed', style='normal', variant='normal', weight=380, stretch='condensed', size='scalable')) = 10.269
2026-07-21 14:55:57 runnervm3jd5f matplotlib.font_manager[2874] DEBUG findfont: score(FontEntry(fname='/usr/share/fonts/truetype/lato/Lato-MediumItalic.ttf', index=0, name='Lato', style='italic', variant='normal', weight=500, stretch='normal', size='scalable')) = 11.145
2026-07-21 14:55:57 runnervm3jd5f matplotlib.font_manager[2874] DEBUG findfont: score(FontEntry(fname='/usr/share/fonts/truetype/lato/Lato-MediumItalic.ttf', index=0, name='Lato Medium', style='italic', variant='normal', weight=400, stretch='normal', size='scalable')) = 11.05
2026-07-21 14:55:57 runnervm3jd5f matplotlib.font_manager[2874] DEBUG findfont: score(FontEntry(fname='/usr/share/fonts/truetype/liberation/LiberationSans-Bold.ttf', index=0, name='Liberation Sans', style='normal', variant='normal', weight=700, stretch='normal', size='scalable')) = 10.335
2026-07-21 14:55:57 runnervm3jd5f matplotlib.font_manager[2874] DEBUG findfont: score(FontEntry(fname='/usr/share/fonts/truetype/dejavu/DejaVuSerifCondensed-BoldItalic.ttf', index=0, name='DejaVu Serif', style='italic', variant='normal', weight=700, stretch='condensed', size='scalable')) = 11.535
2026-07-21 14:55:57 runnervm3jd5f matplotlib.font_manager[2874] DEBUG findfont: score(FontEntry(fname='/usr/share/fonts/truetype/dejavu/DejaVuSerifCondensed-BoldItalic.ttf', index=0, name='DejaVu Serif Condensed', style='italic', variant='normal', weight=700, stretch='condensed', size='scalable')) = 11.535
2026-07-21 14:55:57 runnervm3jd5f matplotlib.font_manager[2874] DEBUG findfont: score(FontEntry(fname='/home/runner/micromamba/envs/trajan/fonts/Ubuntu-R.ttf', index=0, name='Ubuntu', style='normal', variant='normal', weight=400, stretch='normal', size='scalable')) = 10.05
2026-07-21 14:55:57 runnervm3jd5f matplotlib.font_manager[2874] DEBUG findfont: score(FontEntry(fname='/usr/share/fonts/truetype/lato/Lato-Light.ttf', index=0, name='Lato', style='normal', variant='normal', weight=300, stretch='normal', size='scalable')) = 10.145
2026-07-21 14:55:57 runnervm3jd5f matplotlib.font_manager[2874] DEBUG findfont: score(FontEntry(fname='/usr/share/fonts/truetype/lato/Lato-Light.ttf', index=0, name='Lato Light', style='normal', variant='normal', weight=400, stretch='normal', size='scalable')) = 10.05
2026-07-21 14:55:57 runnervm3jd5f matplotlib.font_manager[2874] DEBUG findfont: score(FontEntry(fname='/usr/share/fonts/truetype/liberation/LiberationSerif-BoldItalic.ttf', index=0, name='Liberation Serif', style='italic', variant='normal', weight=700, stretch='normal', size='scalable')) = 11.335
2026-07-21 14:55:57 runnervm3jd5f matplotlib.font_manager[2874] DEBUG findfont: score(FontEntry(fname='/home/runner/micromamba/envs/trajan/fonts/Ubuntu-Th.ttf', index=0, name='Ubuntu', style='normal', variant='normal', weight=250, stretch='normal', size='scalable')) = 10.1925
2026-07-21 14:55:57 runnervm3jd5f matplotlib.font_manager[2874] DEBUG findfont: score(FontEntry(fname='/home/runner/micromamba/envs/trajan/fonts/Ubuntu-Th.ttf', index=0, name='Ubuntu Thin', style='normal', variant='normal', weight=400, stretch='normal', size='scalable')) = 10.05
2026-07-21 14:55:57 runnervm3jd5f matplotlib.font_manager[2874] DEBUG findfont: score(FontEntry(fname='/home/runner/micromamba/envs/trajan/fonts/SourceCodePro-ExtraLight.ttf', index=0, name='Source Code Pro', style='normal', variant='normal', weight=200, stretch='normal', size='scalable')) = 10.24
2026-07-21 14:55:57 runnervm3jd5f matplotlib.font_manager[2874] DEBUG findfont: score(FontEntry(fname='/home/runner/micromamba/envs/trajan/fonts/SourceCodePro-ExtraLight.ttf', index=0, name='Source Code Pro ExtraLight', style='normal', variant='normal', weight=400, stretch='normal', size='scalable')) = 10.05
2026-07-21 14:55:57 runnervm3jd5f matplotlib.font_manager[2874] DEBUG findfont: score(FontEntry(fname='/usr/share/fonts/truetype/lato/Lato-Thin.ttf', index=0, name='Lato', style='normal', variant='normal', weight=275, stretch='normal', size='scalable')) = 10.16875
2026-07-21 14:55:57 runnervm3jd5f matplotlib.font_manager[2874] DEBUG findfont: score(FontEntry(fname='/usr/share/fonts/truetype/lato/Lato-Thin.ttf', index=0, name='Lato Thin', style='normal', variant='normal', weight=400, stretch='normal', size='scalable')) = 10.05
2026-07-21 14:55:57 runnervm3jd5f matplotlib.font_manager[2874] DEBUG findfont: score(FontEntry(fname='/usr/share/fonts/truetype/liberation/LiberationSerif-Bold.ttf', index=0, name='Liberation Serif', style='normal', variant='normal', weight=700, stretch='normal', size='scalable')) = 10.335
2026-07-21 14:55:57 runnervm3jd5f matplotlib.font_manager[2874] DEBUG findfont: score(FontEntry(fname='/home/runner/micromamba/envs/trajan/fonts/Inconsolata-Regular.ttf', index=0, name='Inconsolata', style='normal', variant='normal', weight=400, stretch='normal', size='scalable')) = 10.05
2026-07-21 14:55:57 runnervm3jd5f matplotlib.font_manager[2874] DEBUG findfont: score(FontEntry(fname='/home/runner/micromamba/envs/trajan/fonts/Ubuntu-C.ttf', index=0, name='Ubuntu Condensed', style='normal', variant='normal', weight=400, stretch='condensed', size='scalable')) = 10.25
2026-07-21 14:55:57 runnervm3jd5f matplotlib.font_manager[2874] DEBUG findfont: score(FontEntry(fname='/usr/share/fonts/truetype/dejavu/DejaVuSansCondensed-Bold.ttf', index=0, name='DejaVu Sans', style='normal', variant='normal', weight=700, stretch='condensed', size='scalable')) = 10.535
2026-07-21 14:55:57 runnervm3jd5f matplotlib.font_manager[2874] DEBUG findfont: score(FontEntry(fname='/usr/share/fonts/truetype/dejavu/DejaVuSansCondensed-Bold.ttf', index=0, name='DejaVu Sans Condensed', style='normal', variant='normal', weight=700, stretch='condensed', size='scalable')) = 10.535
2026-07-21 14:55:57 runnervm3jd5f matplotlib.font_manager[2874] DEBUG findfont: score(FontEntry(fname='/usr/share/fonts/truetype/liberation/LiberationMono-Bold.ttf', index=0, name='Liberation Mono', style='normal', variant='normal', weight=700, stretch='normal', size='scalable')) = 10.335
2026-07-21 14:55:57 runnervm3jd5f matplotlib.font_manager[2874] DEBUG findfont: score(FontEntry(fname='/home/runner/micromamba/envs/trajan/fonts/SourceCodePro-Black.ttf', index=0, name='Source Code Pro', style='normal', variant='normal', weight=900, stretch='normal', size='scalable')) = 10.525
2026-07-21 14:55:57 runnervm3jd5f matplotlib.font_manager[2874] DEBUG findfont: score(FontEntry(fname='/home/runner/micromamba/envs/trajan/fonts/SourceCodePro-Black.ttf', index=0, name='Source Code Pro Black', style='normal', variant='normal', weight=400, stretch='normal', size='scalable')) = 10.05
2026-07-21 14:55:57 runnervm3jd5f matplotlib.font_manager[2874] DEBUG findfont: score(FontEntry(fname='/home/runner/micromamba/envs/trajan/fonts/SourceCodePro-BlackIt.ttf', index=0, name='Source Code Pro', style='italic', variant='normal', weight=900, stretch='normal', size='scalable')) = 11.525
2026-07-21 14:55:57 runnervm3jd5f matplotlib.font_manager[2874] DEBUG findfont: score(FontEntry(fname='/home/runner/micromamba/envs/trajan/fonts/SourceCodePro-BlackIt.ttf', index=0, name='Source Code Pro Black', style='italic', variant='normal', weight=400, stretch='normal', size='scalable')) = 11.05
2026-07-21 14:55:57 runnervm3jd5f matplotlib.font_manager[2874] DEBUG findfont: score(FontEntry(fname='/home/runner/micromamba/envs/trajan/fonts/Ubuntu-LI.ttf', index=0, name='Ubuntu', style='italic', variant='normal', weight=300, stretch='normal', size='scalable')) = 11.145
2026-07-21 14:55:57 runnervm3jd5f matplotlib.font_manager[2874] DEBUG findfont: score(FontEntry(fname='/home/runner/micromamba/envs/trajan/fonts/Ubuntu-LI.ttf', index=0, name='Ubuntu Light', style='italic', variant='normal', weight=400, stretch='normal', size='scalable')) = 11.05
2026-07-21 14:55:57 runnervm3jd5f matplotlib.font_manager[2874] DEBUG findfont: score(FontEntry(fname='/usr/share/fonts/truetype/liberation/LiberationMono-Regular.ttf', index=0, name='Liberation Mono', style='normal', variant='normal', weight=400, stretch='normal', size='scalable')) = 10.05
2026-07-21 14:55:57 runnervm3jd5f matplotlib.font_manager[2874] DEBUG findfont: score(FontEntry(fname='/home/runner/micromamba/envs/trajan/fonts/UbuntuMono-RI.ttf', index=0, name='Ubuntu Mono', style='italic', variant='normal', weight=400, stretch='normal', size='scalable')) = 11.05
2026-07-21 14:55:57 runnervm3jd5f matplotlib.font_manager[2874] DEBUG findfont: score(FontEntry(fname='/usr/share/fonts/truetype/lato/Lato-Heavy.ttf', index=0, name='Lato', style='normal', variant='normal', weight=800, stretch='normal', size='scalable')) = 10.43
2026-07-21 14:55:57 runnervm3jd5f matplotlib.font_manager[2874] DEBUG findfont: score(FontEntry(fname='/usr/share/fonts/truetype/lato/Lato-Heavy.ttf', index=0, name='Lato Heavy', style='normal', variant='normal', weight=400, stretch='normal', size='scalable')) = 10.05
2026-07-21 14:55:57 runnervm3jd5f matplotlib.font_manager[2874] DEBUG findfont: score(FontEntry(fname='/usr/share/fonts/truetype/lato/Lato-HairlineItalic.ttf', index=0, name='Lato', style='italic', variant='normal', weight=250, stretch='normal', size='scalable')) = 11.1925
2026-07-21 14:55:57 runnervm3jd5f matplotlib.font_manager[2874] DEBUG findfont: score(FontEntry(fname='/usr/share/fonts/truetype/lato/Lato-HairlineItalic.ttf', index=0, name='Lato Hairline', style='italic', variant='normal', weight=400, stretch='normal', size='scalable')) = 11.05
2026-07-21 14:55:57 runnervm3jd5f matplotlib.font_manager[2874] DEBUG findfont: score(FontEntry(fname='/usr/share/fonts/truetype/dejavu/DejaVuSerifCondensed-Bold.ttf', index=0, name='DejaVu Serif', style='normal', variant='normal', weight=700, stretch='condensed', size='scalable')) = 10.535
2026-07-21 14:55:57 runnervm3jd5f matplotlib.font_manager[2874] DEBUG findfont: score(FontEntry(fname='/usr/share/fonts/truetype/dejavu/DejaVuSerifCondensed-Bold.ttf', index=0, name='DejaVu Serif Condensed', style='normal', variant='normal', weight=700, stretch='condensed', size='scalable')) = 10.535
2026-07-21 14:55:57 runnervm3jd5f matplotlib.font_manager[2874] DEBUG findfont: score(FontEntry(fname='/usr/share/fonts/truetype/dejavu/DejaVuSansCondensed-Oblique.ttf', index=0, name='DejaVu Sans', style='oblique', variant='normal', weight=400, stretch='condensed', size='scalable')) = 11.25
2026-07-21 14:55:57 runnervm3jd5f matplotlib.font_manager[2874] DEBUG findfont: score(FontEntry(fname='/usr/share/fonts/truetype/dejavu/DejaVuSansCondensed-Oblique.ttf', index=0, name='DejaVu Sans Condensed', style='oblique', variant='normal', weight=400, stretch='condensed', size='scalable')) = 11.25
2026-07-21 14:55:57 runnervm3jd5f matplotlib.font_manager[2874] DEBUG findfont: score(FontEntry(fname='/usr/share/fonts/truetype/lato/Lato-SemiboldItalic.ttf', index=0, name='Lato', style='italic', variant='normal', weight=600, stretch='normal', size='scalable')) = 11.24
2026-07-21 14:55:57 runnervm3jd5f matplotlib.font_manager[2874] DEBUG findfont: score(FontEntry(fname='/usr/share/fonts/truetype/lato/Lato-SemiboldItalic.ttf', index=0, name='Lato Semibold', style='italic', variant='normal', weight=400, stretch='normal', size='scalable')) = 11.05
2026-07-21 14:55:57 runnervm3jd5f matplotlib.font_manager[2874] DEBUG findfont: score(FontEntry(fname='/usr/share/fonts/truetype/lato/Lato-Semibold.ttf', index=0, name='Lato', style='normal', variant='normal', weight=600, stretch='normal', size='scalable')) = 10.24
2026-07-21 14:55:57 runnervm3jd5f matplotlib.font_manager[2874] DEBUG findfont: score(FontEntry(fname='/usr/share/fonts/truetype/lato/Lato-Semibold.ttf', index=0, name='Lato Semibold', style='normal', variant='normal', weight=400, stretch='normal', size='scalable')) = 10.05
2026-07-21 14:55:57 runnervm3jd5f matplotlib.font_manager[2874] DEBUG findfont: score(FontEntry(fname='/home/runner/micromamba/envs/trajan/fonts/Inconsolata-Bold.ttf', index=0, name='Inconsolata', style='normal', variant='normal', weight=700, stretch='normal', size='scalable')) = 10.335
2026-07-21 14:55:57 runnervm3jd5f matplotlib.font_manager[2874] DEBUG findfont: score(FontEntry(fname='/usr/share/fonts/truetype/dejavu/DejaVuSans-ExtraLight.ttf', index=0, name='DejaVu Sans', style='normal', variant='normal', weight=200, stretch='normal', size='scalable')) = 10.24
2026-07-21 14:55:57 runnervm3jd5f matplotlib.font_manager[2874] DEBUG findfont: score(FontEntry(fname='/usr/share/fonts/truetype/dejavu/DejaVuSans-ExtraLight.ttf', index=0, name='DejaVu Sans Light', style='normal', variant='normal', weight=200, stretch='normal', size='scalable')) = 10.24
2026-07-21 14:55:57 runnervm3jd5f matplotlib.font_manager[2874] DEBUG findfont: score(FontEntry(fname='/home/runner/micromamba/envs/trajan/fonts/Ubuntu-BI.ttf', index=0, name='Ubuntu', style='italic', variant='normal', weight=700, stretch='normal', size='scalable')) = 11.335
2026-07-21 14:55:57 runnervm3jd5f matplotlib.font_manager[2874] DEBUG findfont: score(FontEntry(fname='/usr/share/fonts/truetype/dejavu/DejaVuSans-BoldOblique.ttf', index=0, name='DejaVu Sans', style='oblique', variant='normal', weight=700, stretch='normal', size='scalable')) = 11.335
2026-07-21 14:55:57 runnervm3jd5f matplotlib.font_manager[2874] DEBUG findfont: score(FontEntry(fname='/home/runner/micromamba/envs/trajan/fonts/Ubuntu-RI.ttf', index=0, name='Ubuntu', style='italic', variant='normal', weight=400, stretch='normal', size='scalable')) = 11.05
2026-07-21 14:55:57 runnervm3jd5f matplotlib.font_manager[2874] DEBUG findfont: score(FontEntry(fname='/usr/share/fonts/truetype/dejavu/DejaVuSerif-Italic.ttf', index=0, name='DejaVu Serif', style='italic', variant='normal', weight=400, stretch='normal', size='scalable')) = 11.05
2026-07-21 14:55:57 runnervm3jd5f matplotlib.font_manager[2874] DEBUG findfont: score(FontEntry(fname='/home/runner/micromamba/envs/trajan/fonts/SourceCodePro-Medium.ttf', index=0, name='Source Code Pro', style='normal', variant='normal', weight=500, stretch='normal', size='scalable')) = 10.145
2026-07-21 14:55:57 runnervm3jd5f matplotlib.font_manager[2874] DEBUG findfont: score(FontEntry(fname='/home/runner/micromamba/envs/trajan/fonts/SourceCodePro-Medium.ttf', index=0, name='Source Code Pro Medium', style='normal', variant='normal', weight=400, stretch='normal', size='scalable')) = 10.05
2026-07-21 14:55:57 runnervm3jd5f matplotlib.font_manager[2874] DEBUG findfont: score(FontEntry(fname='/usr/share/fonts/truetype/lato/Lato-HeavyItalic.ttf', index=0, name='Lato', style='italic', variant='normal', weight=800, stretch='normal', size='scalable')) = 11.43
2026-07-21 14:55:57 runnervm3jd5f matplotlib.font_manager[2874] DEBUG findfont: score(FontEntry(fname='/usr/share/fonts/truetype/lato/Lato-HeavyItalic.ttf', index=0, name='Lato Heavy', style='italic', variant='normal', weight=400, stretch='normal', size='scalable')) = 11.05
2026-07-21 14:55:57 runnervm3jd5f matplotlib.font_manager[2874] DEBUG findfont: score(FontEntry(fname='/usr/share/fonts/truetype/dejavu/DejaVuSans-Oblique.ttf', index=0, name='DejaVu Sans', style='oblique', variant='normal', weight=400, stretch='normal', size='scalable')) = 11.05
2026-07-21 14:55:57 runnervm3jd5f matplotlib.font_manager[2874] DEBUG findfont: score(FontEntry(fname='/home/runner/micromamba/envs/trajan/fonts/Ubuntu-M.ttf', index=0, name='Ubuntu', style='normal', variant='normal', weight=500, stretch='normal', size='scalable')) = 10.145
2026-07-21 14:55:57 runnervm3jd5f matplotlib.font_manager[2874] DEBUG findfont: score(FontEntry(fname='/home/runner/micromamba/envs/trajan/fonts/Ubuntu-M.ttf', index=0, name='Ubuntu Light', style='normal', variant='normal', weight=700, stretch='normal', size='scalable')) = 10.335
2026-07-21 14:55:57 runnervm3jd5f matplotlib.font_manager[2874] DEBUG findfont: score(FontEntry(fname='/usr/share/fonts/truetype/liberation/LiberationMono-BoldItalic.ttf', index=0, name='Liberation Mono', style='italic', variant='normal', weight=700, stretch='normal', size='scalable')) = 11.335
2026-07-21 14:55:57 runnervm3jd5f matplotlib.font_manager[2874] DEBUG findfont: score(FontEntry(fname='/usr/share/fonts/truetype/dejavu/DejaVuSansMono.ttf', index=0, name='DejaVu Sans Mono', style='normal', variant='normal', weight=400, stretch='normal', size='scalable')) = 10.05
2026-07-21 14:55:57 runnervm3jd5f matplotlib.font_manager[2874] DEBUG findfont: score(FontEntry(fname='/usr/share/fonts/truetype/dejavu/DejaVuMathTeXGyre.ttf', index=0, name='DejaVu Math TeX Gyre', style='normal', variant='normal', weight=400, stretch='normal', size='scalable')) = 10.05
2026-07-21 14:55:57 runnervm3jd5f matplotlib.font_manager[2874] DEBUG findfont: score(FontEntry(fname='/usr/share/fonts/truetype/dejavu/DejaVuSansMono-Oblique.ttf', index=0, name='DejaVu Sans Mono', style='oblique', variant='normal', weight=400, stretch='normal', size='scalable')) = 11.05
2026-07-21 14:55:57 runnervm3jd5f matplotlib.font_manager[2874] DEBUG findfont: score(FontEntry(fname='/home/runner/micromamba/envs/trajan/fonts/Ubuntu-L.ttf', index=0, name='Ubuntu', style='normal', variant='normal', weight=300, stretch='normal', size='scalable')) = 10.145
2026-07-21 14:55:57 runnervm3jd5f matplotlib.font_manager[2874] DEBUG findfont: score(FontEntry(fname='/home/runner/micromamba/envs/trajan/fonts/Ubuntu-L.ttf', index=0, name='Ubuntu Light', style='normal', variant='normal', weight=400, stretch='normal', size='scalable')) = 10.05
2026-07-21 14:55:57 runnervm3jd5f matplotlib.font_manager[2874] DEBUG findfont: score(FontEntry(fname='/home/runner/micromamba/envs/trajan/fonts/SourceCodePro-MediumIt.ttf', index=0, name='Source Code Pro', style='italic', variant='normal', weight=500, stretch='normal', size='scalable')) = 11.145
2026-07-21 14:55:57 runnervm3jd5f matplotlib.font_manager[2874] DEBUG findfont: score(FontEntry(fname='/home/runner/micromamba/envs/trajan/fonts/SourceCodePro-MediumIt.ttf', index=0, name='Source Code Pro Medium', style='italic', variant='normal', weight=400, stretch='normal', size='scalable')) = 11.05
2026-07-21 14:55:57 runnervm3jd5f matplotlib.font_manager[2874] DEBUG findfont: score(FontEntry(fname='/home/runner/micromamba/envs/trajan/fonts/SourceCodePro-Regular.ttf', index=0, name='Source Code Pro', style='normal', variant='normal', weight=400, stretch='normal', size='scalable')) = 10.05
2026-07-21 14:55:57 runnervm3jd5f matplotlib.font_manager[2874] DEBUG findfont: score(FontEntry(fname='/home/runner/micromamba/envs/trajan/fonts/SourceCodePro-SemiboldIt.ttf', index=0, name='Source Code Pro', style='italic', variant='normal', weight=600, stretch='normal', size='scalable')) = 11.24
2026-07-21 14:55:57 runnervm3jd5f matplotlib.font_manager[2874] DEBUG findfont: score(FontEntry(fname='/home/runner/micromamba/envs/trajan/fonts/SourceCodePro-SemiboldIt.ttf', index=0, name='Source Code Pro Semibold', style='italic', variant='normal', weight=400, stretch='normal', size='scalable')) = 11.05
2026-07-21 14:55:57 runnervm3jd5f matplotlib.font_manager[2874] DEBUG findfont: score(FontEntry(fname='/usr/share/fonts/truetype/dejavu/DejaVuSerif.ttf', index=0, name='DejaVu Serif', style='normal', variant='normal', weight=400, stretch='normal', size='scalable')) = 10.05
2026-07-21 14:55:57 runnervm3jd5f matplotlib.font_manager[2874] DEBUG findfont: score(FontEntry(fname='/usr/share/fonts/truetype/dejavu/DejaVuSerif-Bold.ttf', index=0, name='DejaVu Serif', style='normal', variant='normal', weight=700, stretch='normal', size='scalable')) = 10.335
2026-07-21 14:55:57 runnervm3jd5f matplotlib.font_manager[2874] DEBUG findfont: score(FontEntry(fname='/usr/share/fonts/truetype/liberation/LiberationSerif-Italic.ttf', index=0, name='Liberation Serif', style='italic', variant='normal', weight=400, stretch='normal', size='scalable')) = 11.05
2026-07-21 14:55:57 runnervm3jd5f matplotlib.font_manager[2874] DEBUG findfont: score(FontEntry(fname='/usr/share/fonts/truetype/dejavu/DejaVuSansMono-BoldOblique.ttf', index=0, name='DejaVu Sans Mono', style='oblique', variant='normal', weight=700, stretch='normal', size='scalable')) = 11.335
2026-07-21 14:55:57 runnervm3jd5f matplotlib.font_manager[2874] DEBUG findfont: score(FontEntry(fname='/home/runner/micromamba/envs/trajan/fonts/SourceCodePro-Light.ttf', index=0, name='Source Code Pro', style='normal', variant='normal', weight=300, stretch='normal', size='scalable')) = 10.145
2026-07-21 14:55:57 runnervm3jd5f matplotlib.font_manager[2874] DEBUG findfont: score(FontEntry(fname='/home/runner/micromamba/envs/trajan/fonts/SourceCodePro-Light.ttf', index=0, name='Source Code Pro Light', style='normal', variant='normal', weight=400, stretch='normal', size='scalable')) = 10.05
2026-07-21 14:55:57 runnervm3jd5f matplotlib.font_manager[2874] DEBUG findfont: score(FontEntry(fname='/usr/share/fonts/truetype/liberation/LiberationMono-Italic.ttf', index=0, name='Liberation Mono', style='italic', variant='normal', weight=400, stretch='normal', size='scalable')) = 11.05
2026-07-21 14:55:57 runnervm3jd5f matplotlib.font_manager[2874] DEBUG findfont: Matching cmsy10:style=normal:variant=normal:weight=normal:stretch=normal:size=10.0 to cmsy10 ('/home/runner/micromamba/envs/trajan/lib/python3.14/site-packages/matplotlib/mpl-data/fonts/ttf/cmsy10.ttf') with score of 0.050000.
2026-07-21 14:55:57 runnervm3jd5f matplotlib.font_manager[2874] DEBUG findfont: Matching cmr10:style=normal:variant=normal:weight=normal:stretch=normal:size=10.0.
2026-07-21 14:55:57 runnervm3jd5f matplotlib.font_manager[2874] DEBUG findfont: score(FontEntry(fname='/home/runner/micromamba/envs/trajan/lib/python3.14/site-packages/matplotlib/mpl-data/fonts/ttf/cmmi10.ttf', index=0, name='cmmi10', style='normal', variant='normal', weight=400, stretch='normal', size='scalable')) = 10.05
2026-07-21 14:55:57 runnervm3jd5f matplotlib.font_manager[2874] DEBUG findfont: score(FontEntry(fname='/home/runner/micromamba/envs/trajan/lib/python3.14/site-packages/matplotlib/mpl-data/fonts/ttf/DejaVuSerif-Bold.ttf', index=0, name='DejaVu Serif', style='normal', variant='normal', weight=700, stretch='normal', size='scalable')) = 10.335
2026-07-21 14:55:57 runnervm3jd5f matplotlib.font_manager[2874] DEBUG findfont: score(FontEntry(fname='/home/runner/micromamba/envs/trajan/lib/python3.14/site-packages/matplotlib/mpl-data/fonts/ttf/DejaVuSans-Oblique.ttf', index=0, name='DejaVu Sans', style='oblique', variant='normal', weight=400, stretch='normal', size='scalable')) = 11.05
2026-07-21 14:55:57 runnervm3jd5f matplotlib.font_manager[2874] DEBUG findfont: score(FontEntry(fname='/home/runner/micromamba/envs/trajan/lib/python3.14/site-packages/matplotlib/mpl-data/fonts/ttf/STIXSizThreeSymReg.ttf', index=0, name='STIXSizeThreeSym', style='normal', variant='normal', weight=400, stretch='normal', size='scalable')) = 10.05
2026-07-21 14:55:57 runnervm3jd5f matplotlib.font_manager[2874] DEBUG findfont: score(FontEntry(fname='/home/runner/micromamba/envs/trajan/lib/python3.14/site-packages/matplotlib/mpl-data/fonts/ttf/STIXNonUniBolIta.ttf', index=0, name='STIXNonUnicode', style='italic', variant='normal', weight=700, stretch='normal', size='scalable')) = 11.335
2026-07-21 14:55:57 runnervm3jd5f matplotlib.font_manager[2874] DEBUG findfont: score(FontEntry(fname='/home/runner/micromamba/envs/trajan/lib/python3.14/site-packages/matplotlib/mpl-data/fonts/ttf/DejaVuSerifDisplay.ttf', index=0, name='DejaVu Serif Display', style='normal', variant='normal', weight=400, stretch='normal', size='scalable')) = 10.05
2026-07-21 14:55:57 runnervm3jd5f matplotlib.font_manager[2874] DEBUG findfont: score(FontEntry(fname='/home/runner/micromamba/envs/trajan/lib/python3.14/site-packages/matplotlib/mpl-data/fonts/ttf/cmss10.ttf', index=0, name='cmss10', style='normal', variant='normal', weight=400, stretch='normal', size='scalable')) = 10.05
2026-07-21 14:55:57 runnervm3jd5f matplotlib.font_manager[2874] DEBUG findfont: score(FontEntry(fname='/home/runner/micromamba/envs/trajan/lib/python3.14/site-packages/matplotlib/mpl-data/fonts/ttf/STIXGeneralBolIta.ttf', index=0, name='STIXGeneral', style='italic', variant='normal', weight=700, stretch='normal', size='scalable')) = 11.335
2026-07-21 14:55:57 runnervm3jd5f matplotlib.font_manager[2874] DEBUG findfont: score(FontEntry(fname='/home/runner/micromamba/envs/trajan/lib/python3.14/site-packages/matplotlib/mpl-data/fonts/ttf/cmtt10.ttf', index=0, name='cmtt10', style='normal', variant='normal', weight=400, stretch='normal', size='scalable')) = 10.05
2026-07-21 14:55:57 runnervm3jd5f matplotlib.font_manager[2874] DEBUG findfont: score(FontEntry(fname='/home/runner/micromamba/envs/trajan/lib/python3.14/site-packages/matplotlib/mpl-data/fonts/ttf/cmsy10.ttf', index=0, name='cmsy10', style='normal', variant='normal', weight=400, stretch='normal', size='scalable')) = 10.05
2026-07-21 14:55:57 runnervm3jd5f matplotlib.font_manager[2874] DEBUG findfont: score(FontEntry(fname='/home/runner/micromamba/envs/trajan/lib/python3.14/site-packages/matplotlib/mpl-data/fonts/ttf/DejaVuSansMono-Oblique.ttf', index=0, name='DejaVu Sans Mono', style='oblique', variant='normal', weight=400, stretch='normal', size='scalable')) = 11.05
2026-07-21 14:55:57 runnervm3jd5f matplotlib.font_manager[2874] DEBUG findfont: score(FontEntry(fname='/home/runner/micromamba/envs/trajan/lib/python3.14/site-packages/matplotlib/mpl-data/fonts/ttf/STIXNonUniIta.ttf', index=0, name='STIXNonUnicode', style='italic', variant='normal', weight=400, stretch='normal', size='scalable')) = 11.05
2026-07-21 14:55:57 runnervm3jd5f matplotlib.font_manager[2874] DEBUG findfont: score(FontEntry(fname='/home/runner/micromamba/envs/trajan/lib/python3.14/site-packages/matplotlib/mpl-data/fonts/ttf/STIXGeneral.ttf', index=0, name='STIXGeneral', style='normal', variant='normal', weight=400, stretch='normal', size='scalable')) = 10.05
2026-07-21 14:55:57 runnervm3jd5f matplotlib.font_manager[2874] DEBUG findfont: score(FontEntry(fname='/home/runner/micromamba/envs/trajan/lib/python3.14/site-packages/matplotlib/mpl-data/fonts/ttf/cmti10.ttf', index=0, name='cmti10', style='normal', variant='normal', weight=400, stretch='normal', size='scalable')) = 10.05
2026-07-21 14:55:57 runnervm3jd5f matplotlib.font_manager[2874] DEBUG findfont: score(FontEntry(fname='/home/runner/micromamba/envs/trajan/lib/python3.14/site-packages/matplotlib/mpl-data/fonts/ttf/DejaVuSansMono-BoldOblique.ttf', index=0, name='DejaVu Sans Mono', style='oblique', variant='normal', weight=700, stretch='normal', size='scalable')) = 11.335
2026-07-21 14:55:57 runnervm3jd5f matplotlib.font_manager[2874] DEBUG findfont: score(FontEntry(fname='/home/runner/micromamba/envs/trajan/lib/python3.14/site-packages/matplotlib/mpl-data/fonts/ttf/DejaVuSerif.ttf', index=0, name='DejaVu Serif', style='normal', variant='normal', weight=400, stretch='normal', size='scalable')) = 10.05
2026-07-21 14:55:57 runnervm3jd5f matplotlib.font_manager[2874] DEBUG findfont: score(FontEntry(fname='/home/runner/micromamba/envs/trajan/lib/python3.14/site-packages/matplotlib/mpl-data/fonts/ttf/LastResortHE-Regular.ttf', index=0, name='Last Resort High-Efficiency', style='normal', variant='normal', weight=400, stretch='normal', size='scalable')) = 10.05
2026-07-21 14:55:57 runnervm3jd5f matplotlib.font_manager[2874] DEBUG findfont: score(FontEntry(fname='/home/runner/micromamba/envs/trajan/lib/python3.14/site-packages/matplotlib/mpl-data/fonts/ttf/cmex10.ttf', index=0, name='cmex10', style='normal', variant='normal', weight=400, stretch='normal', size='scalable')) = 10.05
2026-07-21 14:55:57 runnervm3jd5f matplotlib.font_manager[2874] DEBUG findfont: score(FontEntry(fname='/home/runner/micromamba/envs/trajan/lib/python3.14/site-packages/matplotlib/mpl-data/fonts/ttf/STIXSizFiveSymReg.ttf', index=0, name='STIXSizeFiveSym', style='normal', variant='normal', weight=400, stretch='normal', size='scalable')) = 10.05
2026-07-21 14:55:57 runnervm3jd5f matplotlib.font_manager[2874] DEBUG findfont: score(FontEntry(fname='/home/runner/micromamba/envs/trajan/lib/python3.14/site-packages/matplotlib/mpl-data/fonts/ttf/STIXNonUniBol.ttf', index=0, name='STIXNonUnicode', style='normal', variant='normal', weight=700, stretch='normal', size='scalable')) = 10.335
2026-07-21 14:55:57 runnervm3jd5f matplotlib.font_manager[2874] DEBUG findfont: score(FontEntry(fname='/home/runner/micromamba/envs/trajan/lib/python3.14/site-packages/matplotlib/mpl-data/fonts/ttf/DejaVuSansDisplay.ttf', index=0, name='DejaVu Sans Display', style='normal', variant='normal', weight=400, stretch='normal', size='scalable')) = 10.05
2026-07-21 14:55:57 runnervm3jd5f matplotlib.font_manager[2874] DEBUG findfont: score(FontEntry(fname='/home/runner/micromamba/envs/trajan/lib/python3.14/site-packages/matplotlib/mpl-data/fonts/ttf/DejaVuSansMono.ttf', index=0, name='DejaVu Sans Mono', style='normal', variant='normal', weight=400, stretch='normal', size='scalable')) = 10.05
2026-07-21 14:55:57 runnervm3jd5f matplotlib.font_manager[2874] DEBUG findfont: score(FontEntry(fname='/home/runner/micromamba/envs/trajan/lib/python3.14/site-packages/matplotlib/mpl-data/fonts/ttf/cmb10.ttf', index=0, name='cmb10', style='normal', variant='normal', weight=400, stretch='normal', size='scalable')) = 10.05
2026-07-21 14:55:57 runnervm3jd5f matplotlib.font_manager[2874] DEBUG findfont: score(FontEntry(fname='/home/runner/micromamba/envs/trajan/lib/python3.14/site-packages/matplotlib/mpl-data/fonts/ttf/STIXSizTwoSymReg.ttf', index=0, name='STIXSizeTwoSym', style='normal', variant='normal', weight=400, stretch='normal', size='scalable')) = 10.05
2026-07-21 14:55:57 runnervm3jd5f matplotlib.font_manager[2874] DEBUG findfont: score(FontEntry(fname='/home/runner/micromamba/envs/trajan/lib/python3.14/site-packages/matplotlib/mpl-data/fonts/ttf/DejaVuSans.ttf', index=0, name='DejaVu Sans', style='normal', variant='normal', weight=400, stretch='normal', size='scalable')) = 10.05
2026-07-21 14:55:57 runnervm3jd5f matplotlib.font_manager[2874] DEBUG findfont: score(FontEntry(fname='/home/runner/micromamba/envs/trajan/lib/python3.14/site-packages/matplotlib/mpl-data/fonts/ttf/STIXNonUni.ttf', index=0, name='STIXNonUnicode', style='normal', variant='normal', weight=400, stretch='normal', size='scalable')) = 10.05
2026-07-21 14:55:57 runnervm3jd5f matplotlib.font_manager[2874] DEBUG findfont: score(FontEntry(fname='/home/runner/micromamba/envs/trajan/lib/python3.14/site-packages/matplotlib/mpl-data/fonts/ttf/STIXGeneralItalic.ttf', index=0, name='STIXGeneral', style='italic', variant='normal', weight=400, stretch='normal', size='scalable')) = 11.05
2026-07-21 14:55:57 runnervm3jd5f matplotlib.font_manager[2874] DEBUG findfont: score(FontEntry(fname='/home/runner/micromamba/envs/trajan/lib/python3.14/site-packages/matplotlib/mpl-data/fonts/ttf/STIXSizOneSymBol.ttf', index=0, name='STIXSizeOneSym', style='normal', variant='normal', weight=700, stretch='normal', size='scalable')) = 10.335
2026-07-21 14:55:57 runnervm3jd5f matplotlib.font_manager[2874] DEBUG findfont: score(FontEntry(fname='/home/runner/micromamba/envs/trajan/lib/python3.14/site-packages/matplotlib/mpl-data/fonts/ttf/DejaVuSansMono-Bold.ttf', index=0, name='DejaVu Sans Mono', style='normal', variant='normal', weight=700, stretch='normal', size='scalable')) = 10.335
2026-07-21 14:55:57 runnervm3jd5f matplotlib.font_manager[2874] DEBUG findfont: score(FontEntry(fname='/home/runner/micromamba/envs/trajan/lib/python3.14/site-packages/matplotlib/mpl-data/fonts/ttf/STIXSizTwoSymBol.ttf', index=0, name='STIXSizeTwoSym', style='normal', variant='normal', weight=700, stretch='normal', size='scalable')) = 10.335
2026-07-21 14:55:57 runnervm3jd5f matplotlib.font_manager[2874] DEBUG findfont: score(FontEntry(fname='/home/runner/micromamba/envs/trajan/lib/python3.14/site-packages/matplotlib/mpl-data/fonts/ttf/STIXSizThreeSymBol.ttf', index=0, name='STIXSizeThreeSym', style='normal', variant='normal', weight=700, stretch='normal', size='scalable')) = 10.335
2026-07-21 14:55:57 runnervm3jd5f matplotlib.font_manager[2874] DEBUG findfont: score(FontEntry(fname='/home/runner/micromamba/envs/trajan/lib/python3.14/site-packages/matplotlib/mpl-data/fonts/ttf/DejaVuSerif-BoldItalic.ttf', index=0, name='DejaVu Serif', style='italic', variant='normal', weight=700, stretch='normal', size='scalable')) = 11.335
2026-07-21 14:55:57 runnervm3jd5f matplotlib.font_manager[2874] DEBUG findfont: score(FontEntry(fname='/home/runner/micromamba/envs/trajan/lib/python3.14/site-packages/matplotlib/mpl-data/fonts/ttf/DejaVuSerif-Italic.ttf', index=0, name='DejaVu Serif', style='italic', variant='normal', weight=400, stretch='normal', size='scalable')) = 11.05
2026-07-21 14:55:57 runnervm3jd5f matplotlib.font_manager[2874] DEBUG findfont: score(FontEntry(fname='/home/runner/micromamba/envs/trajan/lib/python3.14/site-packages/matplotlib/mpl-data/fonts/ttf/DejaVuSans-Bold.ttf', index=0, name='DejaVu Sans', style='normal', variant='normal', weight=700, stretch='normal', size='scalable')) = 10.335
2026-07-21 14:55:57 runnervm3jd5f matplotlib.font_manager[2874] DEBUG findfont: score(FontEntry(fname='/home/runner/micromamba/envs/trajan/lib/python3.14/site-packages/matplotlib/mpl-data/fonts/ttf/STIXSizFourSymBol.ttf', index=0, name='STIXSizeFourSym', style='normal', variant='normal', weight=700, stretch='normal', size='scalable')) = 10.335
2026-07-21 14:55:57 runnervm3jd5f matplotlib.font_manager[2874] DEBUG findfont: score(FontEntry(fname='/home/runner/micromamba/envs/trajan/lib/python3.14/site-packages/matplotlib/mpl-data/fonts/ttf/STIXSizOneSymReg.ttf', index=0, name='STIXSizeOneSym', style='normal', variant='normal', weight=400, stretch='normal', size='scalable')) = 10.05
2026-07-21 14:55:57 runnervm3jd5f matplotlib.font_manager[2874] DEBUG findfont: score(FontEntry(fname='/home/runner/micromamba/envs/trajan/lib/python3.14/site-packages/matplotlib/mpl-data/fonts/ttf/cmr10.ttf', index=0, name='cmr10', style='normal', variant='normal', weight=400, stretch='normal', size='scalable')) = 0.05
2026-07-21 14:55:57 runnervm3jd5f matplotlib.font_manager[2874] DEBUG findfont: score(FontEntry(fname='/home/runner/micromamba/envs/trajan/lib/python3.14/site-packages/matplotlib/mpl-data/fonts/ttf/STIXGeneralBol.ttf', index=0, name='STIXGeneral', style='normal', variant='normal', weight=700, stretch='normal', size='scalable')) = 10.335
2026-07-21 14:55:57 runnervm3jd5f matplotlib.font_manager[2874] DEBUG findfont: score(FontEntry(fname='/home/runner/micromamba/envs/trajan/lib/python3.14/site-packages/matplotlib/mpl-data/fonts/ttf/DejaVuSans-BoldOblique.ttf', index=0, name='DejaVu Sans', style='oblique', variant='normal', weight=700, stretch='normal', size='scalable')) = 11.335
2026-07-21 14:55:57 runnervm3jd5f matplotlib.font_manager[2874] DEBUG findfont: score(FontEntry(fname='/home/runner/micromamba/envs/trajan/lib/python3.14/site-packages/matplotlib/mpl-data/fonts/ttf/STIXSizFourSymReg.ttf', index=0, name='STIXSizeFourSym', style='normal', variant='normal', weight=400, stretch='normal', size='scalable')) = 10.05
2026-07-21 14:55:57 runnervm3jd5f matplotlib.font_manager[2874] DEBUG findfont: score(FontEntry(fname='/usr/share/fonts/truetype/lato/Lato-Black.ttf', index=0, name='Lato', style='normal', variant='normal', weight=900, stretch='normal', size='scalable')) = 10.525
2026-07-21 14:55:57 runnervm3jd5f matplotlib.font_manager[2874] DEBUG findfont: score(FontEntry(fname='/usr/share/fonts/truetype/lato/Lato-Black.ttf', index=0, name='Lato Black', style='normal', variant='normal', weight=400, stretch='normal', size='scalable')) = 10.05
2026-07-21 14:55:57 runnervm3jd5f matplotlib.font_manager[2874] DEBUG findfont: score(FontEntry(fname='/usr/share/fonts/truetype/liberation/LiberationSerif-Regular.ttf', index=0, name='Liberation Serif', style='normal', variant='normal', weight=400, stretch='normal', size='scalable')) = 10.05
2026-07-21 14:55:57 runnervm3jd5f matplotlib.font_manager[2874] DEBUG findfont: score(FontEntry(fname='/usr/share/fonts/truetype/dejavu/DejaVuSerifCondensed.ttf', index=0, name='DejaVu Serif', style='normal', variant='normal', weight=400, stretch='condensed', size='scalable')) = 10.25
2026-07-21 14:55:57 runnervm3jd5f matplotlib.font_manager[2874] DEBUG findfont: score(FontEntry(fname='/usr/share/fonts/truetype/dejavu/DejaVuSerifCondensed.ttf', index=0, name='DejaVu Serif Condensed', style='normal', variant='normal', weight=380, stretch='condensed', size='scalable')) = 10.269
2026-07-21 14:55:57 runnervm3jd5f matplotlib.font_manager[2874] DEBUG findfont: score(FontEntry(fname='/home/runner/micromamba/envs/trajan/fonts/UbuntuMono-BI.ttf', index=0, name='Ubuntu Mono', style='italic', variant='normal', weight=700, stretch='normal', size='scalable')) = 11.335
2026-07-21 14:55:57 runnervm3jd5f matplotlib.font_manager[2874] DEBUG findfont: score(FontEntry(fname='/usr/share/fonts/truetype/dejavu/DejaVuSans.ttf', index=0, name='DejaVu Sans', style='normal', variant='normal', weight=400, stretch='normal', size='scalable')) = 10.05
2026-07-21 14:55:57 runnervm3jd5f matplotlib.font_manager[2874] DEBUG findfont: score(FontEntry(fname='/usr/share/fonts/truetype/lato/Lato-Italic.ttf', index=0, name='Lato', style='italic', variant='normal', weight=400, stretch='normal', size='scalable')) = 11.05
2026-07-21 14:55:57 runnervm3jd5f matplotlib.font_manager[2874] DEBUG findfont: score(FontEntry(fname='/usr/share/fonts/truetype/liberation/LiberationSans-Italic.ttf', index=0, name='Liberation Sans', style='italic', variant='normal', weight=400, stretch='normal', size='scalable')) = 11.05
2026-07-21 14:55:57 runnervm3jd5f matplotlib.font_manager[2874] DEBUG findfont: score(FontEntry(fname='/home/runner/micromamba/envs/trajan/fonts/Ubuntu-B.ttf', index=0, name='Ubuntu', style='normal', variant='normal', weight=700, stretch='normal', size='scalable')) = 10.335
2026-07-21 14:55:57 runnervm3jd5f matplotlib.font_manager[2874] DEBUG findfont: score(FontEntry(fname='/home/runner/micromamba/envs/trajan/fonts/SourceCodePro-Semibold.ttf', index=0, name='Source Code Pro', style='normal', variant='normal', weight=600, stretch='normal', size='scalable')) = 10.24
2026-07-21 14:55:57 runnervm3jd5f matplotlib.font_manager[2874] DEBUG findfont: score(FontEntry(fname='/home/runner/micromamba/envs/trajan/fonts/SourceCodePro-Semibold.ttf', index=0, name='Source Code Pro Semibold', style='normal', variant='normal', weight=400, stretch='normal', size='scalable')) = 10.05
2026-07-21 14:55:57 runnervm3jd5f matplotlib.font_manager[2874] DEBUG findfont: score(FontEntry(fname='/home/runner/micromamba/envs/trajan/fonts/SourceCodePro-Bold.ttf', index=0, name='Source Code Pro', style='normal', variant='normal', weight=700, stretch='normal', size='scalable')) = 10.335
2026-07-21 14:55:57 runnervm3jd5f matplotlib.font_manager[2874] DEBUG findfont: score(FontEntry(fname='/home/runner/micromamba/envs/trajan/fonts/Ubuntu-MI.ttf', index=0, name='Ubuntu', style='italic', variant='normal', weight=500, stretch='normal', size='scalable')) = 11.145
2026-07-21 14:55:57 runnervm3jd5f matplotlib.font_manager[2874] DEBUG findfont: score(FontEntry(fname='/home/runner/micromamba/envs/trajan/fonts/Ubuntu-MI.ttf', index=0, name='Ubuntu Light', style='italic', variant='normal', weight=700, stretch='normal', size='scalable')) = 11.335
2026-07-21 14:55:57 runnervm3jd5f matplotlib.font_manager[2874] DEBUG findfont: score(FontEntry(fname='/usr/share/fonts/truetype/lato/Lato-Regular.ttf', index=0, name='Lato', style='normal', variant='normal', weight=400, stretch='normal', size='scalable')) = 10.05
2026-07-21 14:55:57 runnervm3jd5f matplotlib.font_manager[2874] DEBUG findfont: score(FontEntry(fname='/usr/share/fonts/truetype/lato/Lato-ThinItalic.ttf', index=0, name='Lato', style='italic', variant='normal', weight=275, stretch='normal', size='scalable')) = 11.16875
2026-07-21 14:55:57 runnervm3jd5f matplotlib.font_manager[2874] DEBUG findfont: score(FontEntry(fname='/usr/share/fonts/truetype/lato/Lato-ThinItalic.ttf', index=0, name='Lato Thin', style='italic', variant='normal', weight=400, stretch='normal', size='scalable')) = 11.05
2026-07-21 14:55:57 runnervm3jd5f matplotlib.font_manager[2874] DEBUG findfont: score(FontEntry(fname='/usr/share/fonts/truetype/lato/Lato-BlackItalic.ttf', index=0, name='Lato', style='italic', variant='normal', weight=900, stretch='normal', size='scalable')) = 11.525
2026-07-21 14:55:57 runnervm3jd5f matplotlib.font_manager[2874] DEBUG findfont: score(FontEntry(fname='/usr/share/fonts/truetype/lato/Lato-BlackItalic.ttf', index=0, name='Lato Black', style='italic', variant='normal', weight=400, stretch='normal', size='scalable')) = 11.05
2026-07-21 14:55:57 runnervm3jd5f matplotlib.font_manager[2874] DEBUG findfont: score(FontEntry(fname='/usr/share/fonts/truetype/dejavu/DejaVuSerifCondensed-Italic.ttf', index=0, name='DejaVu Serif', style='italic', variant='normal', weight=400, stretch='condensed', size='scalable')) = 11.25
2026-07-21 14:55:57 runnervm3jd5f matplotlib.font_manager[2874] DEBUG findfont: score(FontEntry(fname='/usr/share/fonts/truetype/dejavu/DejaVuSerifCondensed-Italic.ttf', index=0, name='DejaVu Serif Condensed', style='italic', variant='normal', weight=400, stretch='condensed', size='scalable')) = 11.25
2026-07-21 14:55:57 runnervm3jd5f matplotlib.font_manager[2874] DEBUG findfont: score(FontEntry(fname='/usr/share/fonts/truetype/dejavu/DejaVuSans-Bold.ttf', index=0, name='DejaVu Sans', style='normal', variant='normal', weight=700, stretch='normal', size='scalable')) = 10.335
2026-07-21 14:55:57 runnervm3jd5f matplotlib.font_manager[2874] DEBUG findfont: score(FontEntry(fname='/home/runner/micromamba/envs/trajan/fonts/UbuntuMono-R.ttf', index=0, name='Ubuntu Mono', style='normal', variant='normal', weight=400, stretch='normal', size='scalable')) = 10.05
2026-07-21 14:55:57 runnervm3jd5f matplotlib.font_manager[2874] DEBUG findfont: score(FontEntry(fname='/usr/share/fonts/truetype/dejavu/DejaVuSerif-BoldItalic.ttf', index=0, name='DejaVu Serif', style='italic', variant='normal', weight=700, stretch='normal', size='scalable')) = 11.335
2026-07-21 14:55:57 runnervm3jd5f matplotlib.font_manager[2874] DEBUG findfont: score(FontEntry(fname='/usr/share/fonts/truetype/lato/Lato-Hairline.ttf', index=0, name='Lato', style='normal', variant='normal', weight=250, stretch='normal', size='scalable')) = 10.1925
2026-07-21 14:55:57 runnervm3jd5f matplotlib.font_manager[2874] DEBUG findfont: score(FontEntry(fname='/usr/share/fonts/truetype/lato/Lato-Hairline.ttf', index=0, name='Lato Hairline', style='normal', variant='normal', weight=400, stretch='normal', size='scalable')) = 10.05
2026-07-21 14:55:57 runnervm3jd5f matplotlib.font_manager[2874] DEBUG findfont: score(FontEntry(fname='/usr/share/fonts/truetype/lato/Lato-LightItalic.ttf', index=0, name='Lato', style='italic', variant='normal', weight=300, stretch='normal', size='scalable')) = 11.145
2026-07-21 14:55:57 runnervm3jd5f matplotlib.font_manager[2874] DEBUG findfont: score(FontEntry(fname='/usr/share/fonts/truetype/lato/Lato-LightItalic.ttf', index=0, name='Lato Light', style='italic', variant='normal', weight=400, stretch='normal', size='scalable')) = 11.05
2026-07-21 14:55:57 runnervm3jd5f matplotlib.font_manager[2874] DEBUG findfont: score(FontEntry(fname='/usr/share/fonts/truetype/dejavu/DejaVuSansCondensed-BoldOblique.ttf', index=0, name='DejaVu Sans', style='oblique', variant='normal', weight=700, stretch='condensed', size='scalable')) = 11.535
2026-07-21 14:55:57 runnervm3jd5f matplotlib.font_manager[2874] DEBUG findfont: score(FontEntry(fname='/usr/share/fonts/truetype/dejavu/DejaVuSansCondensed-BoldOblique.ttf', index=0, name='DejaVu Sans Condensed', style='oblique', variant='normal', weight=700, stretch='condensed', size='scalable')) = 11.535
2026-07-21 14:55:57 runnervm3jd5f matplotlib.font_manager[2874] DEBUG findfont: score(FontEntry(fname='/home/runner/micromamba/envs/trajan/fonts/SourceCodePro-It.ttf', index=0, name='Source Code Pro', style='italic', variant='normal', weight=400, stretch='normal', size='scalable')) = 11.05
2026-07-21 14:55:57 runnervm3jd5f matplotlib.font_manager[2874] DEBUG findfont: score(FontEntry(fname='/home/runner/micromamba/envs/trajan/fonts/SourceCodePro-ExtraLightIt.ttf', index=0, name='Source Code Pro', style='italic', variant='normal', weight=200, stretch='normal', size='scalable')) = 11.24
2026-07-21 14:55:57 runnervm3jd5f matplotlib.font_manager[2874] DEBUG findfont: score(FontEntry(fname='/home/runner/micromamba/envs/trajan/fonts/SourceCodePro-ExtraLightIt.ttf', index=0, name='Source Code Pro ExtraLight', style='italic', variant='normal', weight=400, stretch='normal', size='scalable')) = 11.05
2026-07-21 14:55:57 runnervm3jd5f matplotlib.font_manager[2874] DEBUG findfont: score(FontEntry(fname='/usr/share/fonts/truetype/lato/Lato-Medium.ttf', index=0, name='Lato', style='normal', variant='normal', weight=500, stretch='normal', size='scalable')) = 10.145
2026-07-21 14:55:57 runnervm3jd5f matplotlib.font_manager[2874] DEBUG findfont: score(FontEntry(fname='/usr/share/fonts/truetype/lato/Lato-Medium.ttf', index=0, name='Lato Medium', style='normal', variant='normal', weight=400, stretch='normal', size='scalable')) = 10.05
2026-07-21 14:55:57 runnervm3jd5f matplotlib.font_manager[2874] DEBUG findfont: score(FontEntry(fname='/usr/share/fonts/truetype/lato/Lato-BoldItalic.ttf', index=0, name='Lato', style='italic', variant='normal', weight=700, stretch='normal', size='scalable')) = 11.335
2026-07-21 14:55:57 runnervm3jd5f matplotlib.font_manager[2874] DEBUG findfont: score(FontEntry(fname='/home/runner/micromamba/envs/trajan/fonts/DejaVuSans.ttf', index=0, name='DejaVu Sans', style='normal', variant='normal', weight=400, stretch='normal', size='scalable')) = 10.05
2026-07-21 14:55:57 runnervm3jd5f matplotlib.font_manager[2874] DEBUG findfont: score(FontEntry(fname='/home/runner/micromamba/envs/trajan/fonts/UbuntuMono-B.ttf', index=0, name='Ubuntu Mono', style='normal', variant='normal', weight=700, stretch='normal', size='scalable')) = 10.335
2026-07-21 14:55:57 runnervm3jd5f matplotlib.font_manager[2874] DEBUG findfont: score(FontEntry(fname='/home/runner/micromamba/envs/trajan/fonts/SourceCodePro-LightIt.ttf', index=0, name='Source Code Pro', style='italic', variant='normal', weight=300, stretch='normal', size='scalable')) = 11.145
2026-07-21 14:55:57 runnervm3jd5f matplotlib.font_manager[2874] DEBUG findfont: score(FontEntry(fname='/home/runner/micromamba/envs/trajan/fonts/SourceCodePro-LightIt.ttf', index=0, name='Source Code Pro Light', style='italic', variant='normal', weight=400, stretch='normal', size='scalable')) = 11.05
2026-07-21 14:55:57 runnervm3jd5f matplotlib.font_manager[2874] DEBUG findfont: score(FontEntry(fname='/usr/share/fonts/truetype/liberation/LiberationSans-BoldItalic.ttf', index=0, name='Liberation Sans', style='italic', variant='normal', weight=700, stretch='normal', size='scalable')) = 11.335
2026-07-21 14:55:57 runnervm3jd5f matplotlib.font_manager[2874] DEBUG findfont: score(FontEntry(fname='/usr/share/fonts/truetype/liberation/LiberationSans-Regular.ttf', index=0, name='Liberation Sans', style='normal', variant='normal', weight=400, stretch='normal', size='scalable')) = 10.05
2026-07-21 14:55:57 runnervm3jd5f matplotlib.font_manager[2874] DEBUG findfont: score(FontEntry(fname='/usr/share/fonts/truetype/dejavu/DejaVuSansMono-Bold.ttf', index=0, name='DejaVu Sans Mono', style='normal', variant='normal', weight=700, stretch='normal', size='scalable')) = 10.335
2026-07-21 14:55:57 runnervm3jd5f matplotlib.font_manager[2874] DEBUG findfont: score(FontEntry(fname='/home/runner/micromamba/envs/trajan/fonts/SourceCodePro-BoldIt.ttf', index=0, name='Source Code Pro', style='italic', variant='normal', weight=700, stretch='normal', size='scalable')) = 11.335
2026-07-21 14:55:57 runnervm3jd5f matplotlib.font_manager[2874] DEBUG findfont: score(FontEntry(fname='/usr/share/fonts/truetype/lato/Lato-Bold.ttf', index=0, name='Lato', style='normal', variant='normal', weight=700, stretch='normal', size='scalable')) = 10.335
2026-07-21 14:55:57 runnervm3jd5f matplotlib.font_manager[2874] DEBUG findfont: score(FontEntry(fname='/usr/share/fonts/truetype/dejavu/DejaVuSansCondensed.ttf', index=0, name='DejaVu Sans', style='normal', variant='normal', weight=400, stretch='condensed', size='scalable')) = 10.25
2026-07-21 14:55:57 runnervm3jd5f matplotlib.font_manager[2874] DEBUG findfont: score(FontEntry(fname='/usr/share/fonts/truetype/dejavu/DejaVuSansCondensed.ttf', index=0, name='DejaVu Sans Condensed', style='normal', variant='normal', weight=380, stretch='condensed', size='scalable')) = 10.269
2026-07-21 14:55:57 runnervm3jd5f matplotlib.font_manager[2874] DEBUG findfont: score(FontEntry(fname='/usr/share/fonts/truetype/lato/Lato-MediumItalic.ttf', index=0, name='Lato', style='italic', variant='normal', weight=500, stretch='normal', size='scalable')) = 11.145
2026-07-21 14:55:57 runnervm3jd5f matplotlib.font_manager[2874] DEBUG findfont: score(FontEntry(fname='/usr/share/fonts/truetype/lato/Lato-MediumItalic.ttf', index=0, name='Lato Medium', style='italic', variant='normal', weight=400, stretch='normal', size='scalable')) = 11.05
2026-07-21 14:55:57 runnervm3jd5f matplotlib.font_manager[2874] DEBUG findfont: score(FontEntry(fname='/usr/share/fonts/truetype/liberation/LiberationSans-Bold.ttf', index=0, name='Liberation Sans', style='normal', variant='normal', weight=700, stretch='normal', size='scalable')) = 10.335
2026-07-21 14:55:57 runnervm3jd5f matplotlib.font_manager[2874] DEBUG findfont: score(FontEntry(fname='/usr/share/fonts/truetype/dejavu/DejaVuSerifCondensed-BoldItalic.ttf', index=0, name='DejaVu Serif', style='italic', variant='normal', weight=700, stretch='condensed', size='scalable')) = 11.535
2026-07-21 14:55:57 runnervm3jd5f matplotlib.font_manager[2874] DEBUG findfont: score(FontEntry(fname='/usr/share/fonts/truetype/dejavu/DejaVuSerifCondensed-BoldItalic.ttf', index=0, name='DejaVu Serif Condensed', style='italic', variant='normal', weight=700, stretch='condensed', size='scalable')) = 11.535
2026-07-21 14:55:57 runnervm3jd5f matplotlib.font_manager[2874] DEBUG findfont: score(FontEntry(fname='/home/runner/micromamba/envs/trajan/fonts/Ubuntu-R.ttf', index=0, name='Ubuntu', style='normal', variant='normal', weight=400, stretch='normal', size='scalable')) = 10.05
2026-07-21 14:55:57 runnervm3jd5f matplotlib.font_manager[2874] DEBUG findfont: score(FontEntry(fname='/usr/share/fonts/truetype/lato/Lato-Light.ttf', index=0, name='Lato', style='normal', variant='normal', weight=300, stretch='normal', size='scalable')) = 10.145
2026-07-21 14:55:57 runnervm3jd5f matplotlib.font_manager[2874] DEBUG findfont: score(FontEntry(fname='/usr/share/fonts/truetype/lato/Lato-Light.ttf', index=0, name='Lato Light', style='normal', variant='normal', weight=400, stretch='normal', size='scalable')) = 10.05
2026-07-21 14:55:57 runnervm3jd5f matplotlib.font_manager[2874] DEBUG findfont: score(FontEntry(fname='/usr/share/fonts/truetype/liberation/LiberationSerif-BoldItalic.ttf', index=0, name='Liberation Serif', style='italic', variant='normal', weight=700, stretch='normal', size='scalable')) = 11.335
2026-07-21 14:55:57 runnervm3jd5f matplotlib.font_manager[2874] DEBUG findfont: score(FontEntry(fname='/home/runner/micromamba/envs/trajan/fonts/Ubuntu-Th.ttf', index=0, name='Ubuntu', style='normal', variant='normal', weight=250, stretch='normal', size='scalable')) = 10.1925
2026-07-21 14:55:57 runnervm3jd5f matplotlib.font_manager[2874] DEBUG findfont: score(FontEntry(fname='/home/runner/micromamba/envs/trajan/fonts/Ubuntu-Th.ttf', index=0, name='Ubuntu Thin', style='normal', variant='normal', weight=400, stretch='normal', size='scalable')) = 10.05
2026-07-21 14:55:57 runnervm3jd5f matplotlib.font_manager[2874] DEBUG findfont: score(FontEntry(fname='/home/runner/micromamba/envs/trajan/fonts/SourceCodePro-ExtraLight.ttf', index=0, name='Source Code Pro', style='normal', variant='normal', weight=200, stretch='normal', size='scalable')) = 10.24
2026-07-21 14:55:57 runnervm3jd5f matplotlib.font_manager[2874] DEBUG findfont: score(FontEntry(fname='/home/runner/micromamba/envs/trajan/fonts/SourceCodePro-ExtraLight.ttf', index=0, name='Source Code Pro ExtraLight', style='normal', variant='normal', weight=400, stretch='normal', size='scalable')) = 10.05
2026-07-21 14:55:57 runnervm3jd5f matplotlib.font_manager[2874] DEBUG findfont: score(FontEntry(fname='/usr/share/fonts/truetype/lato/Lato-Thin.ttf', index=0, name='Lato', style='normal', variant='normal', weight=275, stretch='normal', size='scalable')) = 10.16875
2026-07-21 14:55:57 runnervm3jd5f matplotlib.font_manager[2874] DEBUG findfont: score(FontEntry(fname='/usr/share/fonts/truetype/lato/Lato-Thin.ttf', index=0, name='Lato Thin', style='normal', variant='normal', weight=400, stretch='normal', size='scalable')) = 10.05
2026-07-21 14:55:57 runnervm3jd5f matplotlib.font_manager[2874] DEBUG findfont: score(FontEntry(fname='/usr/share/fonts/truetype/liberation/LiberationSerif-Bold.ttf', index=0, name='Liberation Serif', style='normal', variant='normal', weight=700, stretch='normal', size='scalable')) = 10.335
2026-07-21 14:55:57 runnervm3jd5f matplotlib.font_manager[2874] DEBUG findfont: score(FontEntry(fname='/home/runner/micromamba/envs/trajan/fonts/Inconsolata-Regular.ttf', index=0, name='Inconsolata', style='normal', variant='normal', weight=400, stretch='normal', size='scalable')) = 10.05
2026-07-21 14:55:57 runnervm3jd5f matplotlib.font_manager[2874] DEBUG findfont: score(FontEntry(fname='/home/runner/micromamba/envs/trajan/fonts/Ubuntu-C.ttf', index=0, name='Ubuntu Condensed', style='normal', variant='normal', weight=400, stretch='condensed', size='scalable')) = 10.25
2026-07-21 14:55:57 runnervm3jd5f matplotlib.font_manager[2874] DEBUG findfont: score(FontEntry(fname='/usr/share/fonts/truetype/dejavu/DejaVuSansCondensed-Bold.ttf', index=0, name='DejaVu Sans', style='normal', variant='normal', weight=700, stretch='condensed', size='scalable')) = 10.535
2026-07-21 14:55:57 runnervm3jd5f matplotlib.font_manager[2874] DEBUG findfont: score(FontEntry(fname='/usr/share/fonts/truetype/dejavu/DejaVuSansCondensed-Bold.ttf', index=0, name='DejaVu Sans Condensed', style='normal', variant='normal', weight=700, stretch='condensed', size='scalable')) = 10.535
2026-07-21 14:55:57 runnervm3jd5f matplotlib.font_manager[2874] DEBUG findfont: score(FontEntry(fname='/usr/share/fonts/truetype/liberation/LiberationMono-Bold.ttf', index=0, name='Liberation Mono', style='normal', variant='normal', weight=700, stretch='normal', size='scalable')) = 10.335
2026-07-21 14:55:57 runnervm3jd5f matplotlib.font_manager[2874] DEBUG findfont: score(FontEntry(fname='/home/runner/micromamba/envs/trajan/fonts/SourceCodePro-Black.ttf', index=0, name='Source Code Pro', style='normal', variant='normal', weight=900, stretch='normal', size='scalable')) = 10.525
2026-07-21 14:55:57 runnervm3jd5f matplotlib.font_manager[2874] DEBUG findfont: score(FontEntry(fname='/home/runner/micromamba/envs/trajan/fonts/SourceCodePro-Black.ttf', index=0, name='Source Code Pro Black', style='normal', variant='normal', weight=400, stretch='normal', size='scalable')) = 10.05
2026-07-21 14:55:57 runnervm3jd5f matplotlib.font_manager[2874] DEBUG findfont: score(FontEntry(fname='/home/runner/micromamba/envs/trajan/fonts/SourceCodePro-BlackIt.ttf', index=0, name='Source Code Pro', style='italic', variant='normal', weight=900, stretch='normal', size='scalable')) = 11.525
2026-07-21 14:55:57 runnervm3jd5f matplotlib.font_manager[2874] DEBUG findfont: score(FontEntry(fname='/home/runner/micromamba/envs/trajan/fonts/SourceCodePro-BlackIt.ttf', index=0, name='Source Code Pro Black', style='italic', variant='normal', weight=400, stretch='normal', size='scalable')) = 11.05
2026-07-21 14:55:57 runnervm3jd5f matplotlib.font_manager[2874] DEBUG findfont: score(FontEntry(fname='/home/runner/micromamba/envs/trajan/fonts/Ubuntu-LI.ttf', index=0, name='Ubuntu', style='italic', variant='normal', weight=300, stretch='normal', size='scalable')) = 11.145
2026-07-21 14:55:57 runnervm3jd5f matplotlib.font_manager[2874] DEBUG findfont: score(FontEntry(fname='/home/runner/micromamba/envs/trajan/fonts/Ubuntu-LI.ttf', index=0, name='Ubuntu Light', style='italic', variant='normal', weight=400, stretch='normal', size='scalable')) = 11.05
2026-07-21 14:55:57 runnervm3jd5f matplotlib.font_manager[2874] DEBUG findfont: score(FontEntry(fname='/usr/share/fonts/truetype/liberation/LiberationMono-Regular.ttf', index=0, name='Liberation Mono', style='normal', variant='normal', weight=400, stretch='normal', size='scalable')) = 10.05
2026-07-21 14:55:57 runnervm3jd5f matplotlib.font_manager[2874] DEBUG findfont: score(FontEntry(fname='/home/runner/micromamba/envs/trajan/fonts/UbuntuMono-RI.ttf', index=0, name='Ubuntu Mono', style='italic', variant='normal', weight=400, stretch='normal', size='scalable')) = 11.05
2026-07-21 14:55:57 runnervm3jd5f matplotlib.font_manager[2874] DEBUG findfont: score(FontEntry(fname='/usr/share/fonts/truetype/lato/Lato-Heavy.ttf', index=0, name='Lato', style='normal', variant='normal', weight=800, stretch='normal', size='scalable')) = 10.43
2026-07-21 14:55:57 runnervm3jd5f matplotlib.font_manager[2874] DEBUG findfont: score(FontEntry(fname='/usr/share/fonts/truetype/lato/Lato-Heavy.ttf', index=0, name='Lato Heavy', style='normal', variant='normal', weight=400, stretch='normal', size='scalable')) = 10.05
2026-07-21 14:55:57 runnervm3jd5f matplotlib.font_manager[2874] DEBUG findfont: score(FontEntry(fname='/usr/share/fonts/truetype/lato/Lato-HairlineItalic.ttf', index=0, name='Lato', style='italic', variant='normal', weight=250, stretch='normal', size='scalable')) = 11.1925
2026-07-21 14:55:57 runnervm3jd5f matplotlib.font_manager[2874] DEBUG findfont: score(FontEntry(fname='/usr/share/fonts/truetype/lato/Lato-HairlineItalic.ttf', index=0, name='Lato Hairline', style='italic', variant='normal', weight=400, stretch='normal', size='scalable')) = 11.05
2026-07-21 14:55:57 runnervm3jd5f matplotlib.font_manager[2874] DEBUG findfont: score(FontEntry(fname='/usr/share/fonts/truetype/dejavu/DejaVuSerifCondensed-Bold.ttf', index=0, name='DejaVu Serif', style='normal', variant='normal', weight=700, stretch='condensed', size='scalable')) = 10.535
2026-07-21 14:55:57 runnervm3jd5f matplotlib.font_manager[2874] DEBUG findfont: score(FontEntry(fname='/usr/share/fonts/truetype/dejavu/DejaVuSerifCondensed-Bold.ttf', index=0, name='DejaVu Serif Condensed', style='normal', variant='normal', weight=700, stretch='condensed', size='scalable')) = 10.535
2026-07-21 14:55:57 runnervm3jd5f matplotlib.font_manager[2874] DEBUG findfont: score(FontEntry(fname='/usr/share/fonts/truetype/dejavu/DejaVuSansCondensed-Oblique.ttf', index=0, name='DejaVu Sans', style='oblique', variant='normal', weight=400, stretch='condensed', size='scalable')) = 11.25
2026-07-21 14:55:57 runnervm3jd5f matplotlib.font_manager[2874] DEBUG findfont: score(FontEntry(fname='/usr/share/fonts/truetype/dejavu/DejaVuSansCondensed-Oblique.ttf', index=0, name='DejaVu Sans Condensed', style='oblique', variant='normal', weight=400, stretch='condensed', size='scalable')) = 11.25
2026-07-21 14:55:57 runnervm3jd5f matplotlib.font_manager[2874] DEBUG findfont: score(FontEntry(fname='/usr/share/fonts/truetype/lato/Lato-SemiboldItalic.ttf', index=0, name='Lato', style='italic', variant='normal', weight=600, stretch='normal', size='scalable')) = 11.24
2026-07-21 14:55:57 runnervm3jd5f matplotlib.font_manager[2874] DEBUG findfont: score(FontEntry(fname='/usr/share/fonts/truetype/lato/Lato-SemiboldItalic.ttf', index=0, name='Lato Semibold', style='italic', variant='normal', weight=400, stretch='normal', size='scalable')) = 11.05
2026-07-21 14:55:57 runnervm3jd5f matplotlib.font_manager[2874] DEBUG findfont: score(FontEntry(fname='/usr/share/fonts/truetype/lato/Lato-Semibold.ttf', index=0, name='Lato', style='normal', variant='normal', weight=600, stretch='normal', size='scalable')) = 10.24
2026-07-21 14:55:57 runnervm3jd5f matplotlib.font_manager[2874] DEBUG findfont: score(FontEntry(fname='/usr/share/fonts/truetype/lato/Lato-Semibold.ttf', index=0, name='Lato Semibold', style='normal', variant='normal', weight=400, stretch='normal', size='scalable')) = 10.05
2026-07-21 14:55:57 runnervm3jd5f matplotlib.font_manager[2874] DEBUG findfont: score(FontEntry(fname='/home/runner/micromamba/envs/trajan/fonts/Inconsolata-Bold.ttf', index=0, name='Inconsolata', style='normal', variant='normal', weight=700, stretch='normal', size='scalable')) = 10.335
2026-07-21 14:55:57 runnervm3jd5f matplotlib.font_manager[2874] DEBUG findfont: score(FontEntry(fname='/usr/share/fonts/truetype/dejavu/DejaVuSans-ExtraLight.ttf', index=0, name='DejaVu Sans', style='normal', variant='normal', weight=200, stretch='normal', size='scalable')) = 10.24
2026-07-21 14:55:57 runnervm3jd5f matplotlib.font_manager[2874] DEBUG findfont: score(FontEntry(fname='/usr/share/fonts/truetype/dejavu/DejaVuSans-ExtraLight.ttf', index=0, name='DejaVu Sans Light', style='normal', variant='normal', weight=200, stretch='normal', size='scalable')) = 10.24
2026-07-21 14:55:57 runnervm3jd5f matplotlib.font_manager[2874] DEBUG findfont: score(FontEntry(fname='/home/runner/micromamba/envs/trajan/fonts/Ubuntu-BI.ttf', index=0, name='Ubuntu', style='italic', variant='normal', weight=700, stretch='normal', size='scalable')) = 11.335
2026-07-21 14:55:57 runnervm3jd5f matplotlib.font_manager[2874] DEBUG findfont: score(FontEntry(fname='/usr/share/fonts/truetype/dejavu/DejaVuSans-BoldOblique.ttf', index=0, name='DejaVu Sans', style='oblique', variant='normal', weight=700, stretch='normal', size='scalable')) = 11.335
2026-07-21 14:55:57 runnervm3jd5f matplotlib.font_manager[2874] DEBUG findfont: score(FontEntry(fname='/home/runner/micromamba/envs/trajan/fonts/Ubuntu-RI.ttf', index=0, name='Ubuntu', style='italic', variant='normal', weight=400, stretch='normal', size='scalable')) = 11.05
2026-07-21 14:55:57 runnervm3jd5f matplotlib.font_manager[2874] DEBUG findfont: score(FontEntry(fname='/usr/share/fonts/truetype/dejavu/DejaVuSerif-Italic.ttf', index=0, name='DejaVu Serif', style='italic', variant='normal', weight=400, stretch='normal', size='scalable')) = 11.05
2026-07-21 14:55:57 runnervm3jd5f matplotlib.font_manager[2874] DEBUG findfont: score(FontEntry(fname='/home/runner/micromamba/envs/trajan/fonts/SourceCodePro-Medium.ttf', index=0, name='Source Code Pro', style='normal', variant='normal', weight=500, stretch='normal', size='scalable')) = 10.145
2026-07-21 14:55:57 runnervm3jd5f matplotlib.font_manager[2874] DEBUG findfont: score(FontEntry(fname='/home/runner/micromamba/envs/trajan/fonts/SourceCodePro-Medium.ttf', index=0, name='Source Code Pro Medium', style='normal', variant='normal', weight=400, stretch='normal', size='scalable')) = 10.05
2026-07-21 14:55:57 runnervm3jd5f matplotlib.font_manager[2874] DEBUG findfont: score(FontEntry(fname='/usr/share/fonts/truetype/lato/Lato-HeavyItalic.ttf', index=0, name='Lato', style='italic', variant='normal', weight=800, stretch='normal', size='scalable')) = 11.43
2026-07-21 14:55:57 runnervm3jd5f matplotlib.font_manager[2874] DEBUG findfont: score(FontEntry(fname='/usr/share/fonts/truetype/lato/Lato-HeavyItalic.ttf', index=0, name='Lato Heavy', style='italic', variant='normal', weight=400, stretch='normal', size='scalable')) = 11.05
2026-07-21 14:55:57 runnervm3jd5f matplotlib.font_manager[2874] DEBUG findfont: score(FontEntry(fname='/usr/share/fonts/truetype/dejavu/DejaVuSans-Oblique.ttf', index=0, name='DejaVu Sans', style='oblique', variant='normal', weight=400, stretch='normal', size='scalable')) = 11.05
2026-07-21 14:55:57 runnervm3jd5f matplotlib.font_manager[2874] DEBUG findfont: score(FontEntry(fname='/home/runner/micromamba/envs/trajan/fonts/Ubuntu-M.ttf', index=0, name='Ubuntu', style='normal', variant='normal', weight=500, stretch='normal', size='scalable')) = 10.145
2026-07-21 14:55:57 runnervm3jd5f matplotlib.font_manager[2874] DEBUG findfont: score(FontEntry(fname='/home/runner/micromamba/envs/trajan/fonts/Ubuntu-M.ttf', index=0, name='Ubuntu Light', style='normal', variant='normal', weight=700, stretch='normal', size='scalable')) = 10.335
2026-07-21 14:55:57 runnervm3jd5f matplotlib.font_manager[2874] DEBUG findfont: score(FontEntry(fname='/usr/share/fonts/truetype/liberation/LiberationMono-BoldItalic.ttf', index=0, name='Liberation Mono', style='italic', variant='normal', weight=700, stretch='normal', size='scalable')) = 11.335
2026-07-21 14:55:57 runnervm3jd5f matplotlib.font_manager[2874] DEBUG findfont: score(FontEntry(fname='/usr/share/fonts/truetype/dejavu/DejaVuSansMono.ttf', index=0, name='DejaVu Sans Mono', style='normal', variant='normal', weight=400, stretch='normal', size='scalable')) = 10.05
2026-07-21 14:55:57 runnervm3jd5f matplotlib.font_manager[2874] DEBUG findfont: score(FontEntry(fname='/usr/share/fonts/truetype/dejavu/DejaVuMathTeXGyre.ttf', index=0, name='DejaVu Math TeX Gyre', style='normal', variant='normal', weight=400, stretch='normal', size='scalable')) = 10.05
2026-07-21 14:55:57 runnervm3jd5f matplotlib.font_manager[2874] DEBUG findfont: score(FontEntry(fname='/usr/share/fonts/truetype/dejavu/DejaVuSansMono-Oblique.ttf', index=0, name='DejaVu Sans Mono', style='oblique', variant='normal', weight=400, stretch='normal', size='scalable')) = 11.05
2026-07-21 14:55:57 runnervm3jd5f matplotlib.font_manager[2874] DEBUG findfont: score(FontEntry(fname='/home/runner/micromamba/envs/trajan/fonts/Ubuntu-L.ttf', index=0, name='Ubuntu', style='normal', variant='normal', weight=300, stretch='normal', size='scalable')) = 10.145
2026-07-21 14:55:57 runnervm3jd5f matplotlib.font_manager[2874] DEBUG findfont: score(FontEntry(fname='/home/runner/micromamba/envs/trajan/fonts/Ubuntu-L.ttf', index=0, name='Ubuntu Light', style='normal', variant='normal', weight=400, stretch='normal', size='scalable')) = 10.05
2026-07-21 14:55:57 runnervm3jd5f matplotlib.font_manager[2874] DEBUG findfont: score(FontEntry(fname='/home/runner/micromamba/envs/trajan/fonts/SourceCodePro-MediumIt.ttf', index=0, name='Source Code Pro', style='italic', variant='normal', weight=500, stretch='normal', size='scalable')) = 11.145
2026-07-21 14:55:57 runnervm3jd5f matplotlib.font_manager[2874] DEBUG findfont: score(FontEntry(fname='/home/runner/micromamba/envs/trajan/fonts/SourceCodePro-MediumIt.ttf', index=0, name='Source Code Pro Medium', style='italic', variant='normal', weight=400, stretch='normal', size='scalable')) = 11.05
2026-07-21 14:55:57 runnervm3jd5f matplotlib.font_manager[2874] DEBUG findfont: score(FontEntry(fname='/home/runner/micromamba/envs/trajan/fonts/SourceCodePro-Regular.ttf', index=0, name='Source Code Pro', style='normal', variant='normal', weight=400, stretch='normal', size='scalable')) = 10.05
2026-07-21 14:55:57 runnervm3jd5f matplotlib.font_manager[2874] DEBUG findfont: score(FontEntry(fname='/home/runner/micromamba/envs/trajan/fonts/SourceCodePro-SemiboldIt.ttf', index=0, name='Source Code Pro', style='italic', variant='normal', weight=600, stretch='normal', size='scalable')) = 11.24
2026-07-21 14:55:57 runnervm3jd5f matplotlib.font_manager[2874] DEBUG findfont: score(FontEntry(fname='/home/runner/micromamba/envs/trajan/fonts/SourceCodePro-SemiboldIt.ttf', index=0, name='Source Code Pro Semibold', style='italic', variant='normal', weight=400, stretch='normal', size='scalable')) = 11.05
2026-07-21 14:55:57 runnervm3jd5f matplotlib.font_manager[2874] DEBUG findfont: score(FontEntry(fname='/usr/share/fonts/truetype/dejavu/DejaVuSerif.ttf', index=0, name='DejaVu Serif', style='normal', variant='normal', weight=400, stretch='normal', size='scalable')) = 10.05
2026-07-21 14:55:57 runnervm3jd5f matplotlib.font_manager[2874] DEBUG findfont: score(FontEntry(fname='/usr/share/fonts/truetype/dejavu/DejaVuSerif-Bold.ttf', index=0, name='DejaVu Serif', style='normal', variant='normal', weight=700, stretch='normal', size='scalable')) = 10.335
2026-07-21 14:55:57 runnervm3jd5f matplotlib.font_manager[2874] DEBUG findfont: score(FontEntry(fname='/usr/share/fonts/truetype/liberation/LiberationSerif-Italic.ttf', index=0, name='Liberation Serif', style='italic', variant='normal', weight=400, stretch='normal', size='scalable')) = 11.05
2026-07-21 14:55:57 runnervm3jd5f matplotlib.font_manager[2874] DEBUG findfont: score(FontEntry(fname='/usr/share/fonts/truetype/dejavu/DejaVuSansMono-BoldOblique.ttf', index=0, name='DejaVu Sans Mono', style='oblique', variant='normal', weight=700, stretch='normal', size='scalable')) = 11.335
2026-07-21 14:55:57 runnervm3jd5f matplotlib.font_manager[2874] DEBUG findfont: score(FontEntry(fname='/home/runner/micromamba/envs/trajan/fonts/SourceCodePro-Light.ttf', index=0, name='Source Code Pro', style='normal', variant='normal', weight=300, stretch='normal', size='scalable')) = 10.145
2026-07-21 14:55:57 runnervm3jd5f matplotlib.font_manager[2874] DEBUG findfont: score(FontEntry(fname='/home/runner/micromamba/envs/trajan/fonts/SourceCodePro-Light.ttf', index=0, name='Source Code Pro Light', style='normal', variant='normal', weight=400, stretch='normal', size='scalable')) = 10.05
2026-07-21 14:55:57 runnervm3jd5f matplotlib.font_manager[2874] DEBUG findfont: score(FontEntry(fname='/usr/share/fonts/truetype/liberation/LiberationMono-Italic.ttf', index=0, name='Liberation Mono', style='italic', variant='normal', weight=400, stretch='normal', size='scalable')) = 11.05
2026-07-21 14:55:57 runnervm3jd5f matplotlib.font_manager[2874] DEBUG findfont: Matching cmr10:style=normal:variant=normal:weight=normal:stretch=normal:size=10.0 to cmr10 ('/home/runner/micromamba/envs/trajan/lib/python3.14/site-packages/matplotlib/mpl-data/fonts/ttf/cmr10.ttf') with score of 0.050000.
2026-07-21 14:55:57 runnervm3jd5f matplotlib.font_manager[2874] DEBUG findfont: Matching cmtt10:style=normal:variant=normal:weight=normal:stretch=normal:size=10.0.
2026-07-21 14:55:57 runnervm3jd5f matplotlib.font_manager[2874] DEBUG findfont: score(FontEntry(fname='/home/runner/micromamba/envs/trajan/lib/python3.14/site-packages/matplotlib/mpl-data/fonts/ttf/cmmi10.ttf', index=0, name='cmmi10', style='normal', variant='normal', weight=400, stretch='normal', size='scalable')) = 10.05
2026-07-21 14:55:57 runnervm3jd5f matplotlib.font_manager[2874] DEBUG findfont: score(FontEntry(fname='/home/runner/micromamba/envs/trajan/lib/python3.14/site-packages/matplotlib/mpl-data/fonts/ttf/DejaVuSerif-Bold.ttf', index=0, name='DejaVu Serif', style='normal', variant='normal', weight=700, stretch='normal', size='scalable')) = 10.335
2026-07-21 14:55:57 runnervm3jd5f matplotlib.font_manager[2874] DEBUG findfont: score(FontEntry(fname='/home/runner/micromamba/envs/trajan/lib/python3.14/site-packages/matplotlib/mpl-data/fonts/ttf/DejaVuSans-Oblique.ttf', index=0, name='DejaVu Sans', style='oblique', variant='normal', weight=400, stretch='normal', size='scalable')) = 11.05
2026-07-21 14:55:57 runnervm3jd5f matplotlib.font_manager[2874] DEBUG findfont: score(FontEntry(fname='/home/runner/micromamba/envs/trajan/lib/python3.14/site-packages/matplotlib/mpl-data/fonts/ttf/STIXSizThreeSymReg.ttf', index=0, name='STIXSizeThreeSym', style='normal', variant='normal', weight=400, stretch='normal', size='scalable')) = 10.05
2026-07-21 14:55:57 runnervm3jd5f matplotlib.font_manager[2874] DEBUG findfont: score(FontEntry(fname='/home/runner/micromamba/envs/trajan/lib/python3.14/site-packages/matplotlib/mpl-data/fonts/ttf/STIXNonUniBolIta.ttf', index=0, name='STIXNonUnicode', style='italic', variant='normal', weight=700, stretch='normal', size='scalable')) = 11.335
2026-07-21 14:55:57 runnervm3jd5f matplotlib.font_manager[2874] DEBUG findfont: score(FontEntry(fname='/home/runner/micromamba/envs/trajan/lib/python3.14/site-packages/matplotlib/mpl-data/fonts/ttf/DejaVuSerifDisplay.ttf', index=0, name='DejaVu Serif Display', style='normal', variant='normal', weight=400, stretch='normal', size='scalable')) = 10.05
2026-07-21 14:55:57 runnervm3jd5f matplotlib.font_manager[2874] DEBUG findfont: score(FontEntry(fname='/home/runner/micromamba/envs/trajan/lib/python3.14/site-packages/matplotlib/mpl-data/fonts/ttf/cmss10.ttf', index=0, name='cmss10', style='normal', variant='normal', weight=400, stretch='normal', size='scalable')) = 10.05
2026-07-21 14:55:57 runnervm3jd5f matplotlib.font_manager[2874] DEBUG findfont: score(FontEntry(fname='/home/runner/micromamba/envs/trajan/lib/python3.14/site-packages/matplotlib/mpl-data/fonts/ttf/STIXGeneralBolIta.ttf', index=0, name='STIXGeneral', style='italic', variant='normal', weight=700, stretch='normal', size='scalable')) = 11.335
2026-07-21 14:55:57 runnervm3jd5f matplotlib.font_manager[2874] DEBUG findfont: score(FontEntry(fname='/home/runner/micromamba/envs/trajan/lib/python3.14/site-packages/matplotlib/mpl-data/fonts/ttf/cmtt10.ttf', index=0, name='cmtt10', style='normal', variant='normal', weight=400, stretch='normal', size='scalable')) = 0.05
2026-07-21 14:55:57 runnervm3jd5f matplotlib.font_manager[2874] DEBUG findfont: score(FontEntry(fname='/home/runner/micromamba/envs/trajan/lib/python3.14/site-packages/matplotlib/mpl-data/fonts/ttf/cmsy10.ttf', index=0, name='cmsy10', style='normal', variant='normal', weight=400, stretch='normal', size='scalable')) = 10.05
2026-07-21 14:55:57 runnervm3jd5f matplotlib.font_manager[2874] DEBUG findfont: score(FontEntry(fname='/home/runner/micromamba/envs/trajan/lib/python3.14/site-packages/matplotlib/mpl-data/fonts/ttf/DejaVuSansMono-Oblique.ttf', index=0, name='DejaVu Sans Mono', style='oblique', variant='normal', weight=400, stretch='normal', size='scalable')) = 11.05
2026-07-21 14:55:57 runnervm3jd5f matplotlib.font_manager[2874] DEBUG findfont: score(FontEntry(fname='/home/runner/micromamba/envs/trajan/lib/python3.14/site-packages/matplotlib/mpl-data/fonts/ttf/STIXNonUniIta.ttf', index=0, name='STIXNonUnicode', style='italic', variant='normal', weight=400, stretch='normal', size='scalable')) = 11.05
2026-07-21 14:55:57 runnervm3jd5f matplotlib.font_manager[2874] DEBUG findfont: score(FontEntry(fname='/home/runner/micromamba/envs/trajan/lib/python3.14/site-packages/matplotlib/mpl-data/fonts/ttf/STIXGeneral.ttf', index=0, name='STIXGeneral', style='normal', variant='normal', weight=400, stretch='normal', size='scalable')) = 10.05
2026-07-21 14:55:57 runnervm3jd5f matplotlib.font_manager[2874] DEBUG findfont: score(FontEntry(fname='/home/runner/micromamba/envs/trajan/lib/python3.14/site-packages/matplotlib/mpl-data/fonts/ttf/cmti10.ttf', index=0, name='cmti10', style='normal', variant='normal', weight=400, stretch='normal', size='scalable')) = 10.05
2026-07-21 14:55:57 runnervm3jd5f matplotlib.font_manager[2874] DEBUG findfont: score(FontEntry(fname='/home/runner/micromamba/envs/trajan/lib/python3.14/site-packages/matplotlib/mpl-data/fonts/ttf/DejaVuSansMono-BoldOblique.ttf', index=0, name='DejaVu Sans Mono', style='oblique', variant='normal', weight=700, stretch='normal', size='scalable')) = 11.335
2026-07-21 14:55:57 runnervm3jd5f matplotlib.font_manager[2874] DEBUG findfont: score(FontEntry(fname='/home/runner/micromamba/envs/trajan/lib/python3.14/site-packages/matplotlib/mpl-data/fonts/ttf/DejaVuSerif.ttf', index=0, name='DejaVu Serif', style='normal', variant='normal', weight=400, stretch='normal', size='scalable')) = 10.05
2026-07-21 14:55:57 runnervm3jd5f matplotlib.font_manager[2874] DEBUG findfont: score(FontEntry(fname='/home/runner/micromamba/envs/trajan/lib/python3.14/site-packages/matplotlib/mpl-data/fonts/ttf/LastResortHE-Regular.ttf', index=0, name='Last Resort High-Efficiency', style='normal', variant='normal', weight=400, stretch='normal', size='scalable')) = 10.05
2026-07-21 14:55:57 runnervm3jd5f matplotlib.font_manager[2874] DEBUG findfont: score(FontEntry(fname='/home/runner/micromamba/envs/trajan/lib/python3.14/site-packages/matplotlib/mpl-data/fonts/ttf/cmex10.ttf', index=0, name='cmex10', style='normal', variant='normal', weight=400, stretch='normal', size='scalable')) = 10.05
2026-07-21 14:55:57 runnervm3jd5f matplotlib.font_manager[2874] DEBUG findfont: score(FontEntry(fname='/home/runner/micromamba/envs/trajan/lib/python3.14/site-packages/matplotlib/mpl-data/fonts/ttf/STIXSizFiveSymReg.ttf', index=0, name='STIXSizeFiveSym', style='normal', variant='normal', weight=400, stretch='normal', size='scalable')) = 10.05
2026-07-21 14:55:57 runnervm3jd5f matplotlib.font_manager[2874] DEBUG findfont: score(FontEntry(fname='/home/runner/micromamba/envs/trajan/lib/python3.14/site-packages/matplotlib/mpl-data/fonts/ttf/STIXNonUniBol.ttf', index=0, name='STIXNonUnicode', style='normal', variant='normal', weight=700, stretch='normal', size='scalable')) = 10.335
2026-07-21 14:55:57 runnervm3jd5f matplotlib.font_manager[2874] DEBUG findfont: score(FontEntry(fname='/home/runner/micromamba/envs/trajan/lib/python3.14/site-packages/matplotlib/mpl-data/fonts/ttf/DejaVuSansDisplay.ttf', index=0, name='DejaVu Sans Display', style='normal', variant='normal', weight=400, stretch='normal', size='scalable')) = 10.05
2026-07-21 14:55:57 runnervm3jd5f matplotlib.font_manager[2874] DEBUG findfont: score(FontEntry(fname='/home/runner/micromamba/envs/trajan/lib/python3.14/site-packages/matplotlib/mpl-data/fonts/ttf/DejaVuSansMono.ttf', index=0, name='DejaVu Sans Mono', style='normal', variant='normal', weight=400, stretch='normal', size='scalable')) = 10.05
2026-07-21 14:55:57 runnervm3jd5f matplotlib.font_manager[2874] DEBUG findfont: score(FontEntry(fname='/home/runner/micromamba/envs/trajan/lib/python3.14/site-packages/matplotlib/mpl-data/fonts/ttf/cmb10.ttf', index=0, name='cmb10', style='normal', variant='normal', weight=400, stretch='normal', size='scalable')) = 10.05
2026-07-21 14:55:57 runnervm3jd5f matplotlib.font_manager[2874] DEBUG findfont: score(FontEntry(fname='/home/runner/micromamba/envs/trajan/lib/python3.14/site-packages/matplotlib/mpl-data/fonts/ttf/STIXSizTwoSymReg.ttf', index=0, name='STIXSizeTwoSym', style='normal', variant='normal', weight=400, stretch='normal', size='scalable')) = 10.05
2026-07-21 14:55:57 runnervm3jd5f matplotlib.font_manager[2874] DEBUG findfont: score(FontEntry(fname='/home/runner/micromamba/envs/trajan/lib/python3.14/site-packages/matplotlib/mpl-data/fonts/ttf/DejaVuSans.ttf', index=0, name='DejaVu Sans', style='normal', variant='normal', weight=400, stretch='normal', size='scalable')) = 10.05
2026-07-21 14:55:57 runnervm3jd5f matplotlib.font_manager[2874] DEBUG findfont: score(FontEntry(fname='/home/runner/micromamba/envs/trajan/lib/python3.14/site-packages/matplotlib/mpl-data/fonts/ttf/STIXNonUni.ttf', index=0, name='STIXNonUnicode', style='normal', variant='normal', weight=400, stretch='normal', size='scalable')) = 10.05
2026-07-21 14:55:57 runnervm3jd5f matplotlib.font_manager[2874] DEBUG findfont: score(FontEntry(fname='/home/runner/micromamba/envs/trajan/lib/python3.14/site-packages/matplotlib/mpl-data/fonts/ttf/STIXGeneralItalic.ttf', index=0, name='STIXGeneral', style='italic', variant='normal', weight=400, stretch='normal', size='scalable')) = 11.05
2026-07-21 14:55:57 runnervm3jd5f matplotlib.font_manager[2874] DEBUG findfont: score(FontEntry(fname='/home/runner/micromamba/envs/trajan/lib/python3.14/site-packages/matplotlib/mpl-data/fonts/ttf/STIXSizOneSymBol.ttf', index=0, name='STIXSizeOneSym', style='normal', variant='normal', weight=700, stretch='normal', size='scalable')) = 10.335
2026-07-21 14:55:57 runnervm3jd5f matplotlib.font_manager[2874] DEBUG findfont: score(FontEntry(fname='/home/runner/micromamba/envs/trajan/lib/python3.14/site-packages/matplotlib/mpl-data/fonts/ttf/DejaVuSansMono-Bold.ttf', index=0, name='DejaVu Sans Mono', style='normal', variant='normal', weight=700, stretch='normal', size='scalable')) = 10.335
2026-07-21 14:55:57 runnervm3jd5f matplotlib.font_manager[2874] DEBUG findfont: score(FontEntry(fname='/home/runner/micromamba/envs/trajan/lib/python3.14/site-packages/matplotlib/mpl-data/fonts/ttf/STIXSizTwoSymBol.ttf', index=0, name='STIXSizeTwoSym', style='normal', variant='normal', weight=700, stretch='normal', size='scalable')) = 10.335
2026-07-21 14:55:57 runnervm3jd5f matplotlib.font_manager[2874] DEBUG findfont: score(FontEntry(fname='/home/runner/micromamba/envs/trajan/lib/python3.14/site-packages/matplotlib/mpl-data/fonts/ttf/STIXSizThreeSymBol.ttf', index=0, name='STIXSizeThreeSym', style='normal', variant='normal', weight=700, stretch='normal', size='scalable')) = 10.335
2026-07-21 14:55:57 runnervm3jd5f matplotlib.font_manager[2874] DEBUG findfont: score(FontEntry(fname='/home/runner/micromamba/envs/trajan/lib/python3.14/site-packages/matplotlib/mpl-data/fonts/ttf/DejaVuSerif-BoldItalic.ttf', index=0, name='DejaVu Serif', style='italic', variant='normal', weight=700, stretch='normal', size='scalable')) = 11.335
2026-07-21 14:55:57 runnervm3jd5f matplotlib.font_manager[2874] DEBUG findfont: score(FontEntry(fname='/home/runner/micromamba/envs/trajan/lib/python3.14/site-packages/matplotlib/mpl-data/fonts/ttf/DejaVuSerif-Italic.ttf', index=0, name='DejaVu Serif', style='italic', variant='normal', weight=400, stretch='normal', size='scalable')) = 11.05
2026-07-21 14:55:57 runnervm3jd5f matplotlib.font_manager[2874] DEBUG findfont: score(FontEntry(fname='/home/runner/micromamba/envs/trajan/lib/python3.14/site-packages/matplotlib/mpl-data/fonts/ttf/DejaVuSans-Bold.ttf', index=0, name='DejaVu Sans', style='normal', variant='normal', weight=700, stretch='normal', size='scalable')) = 10.335
2026-07-21 14:55:57 runnervm3jd5f matplotlib.font_manager[2874] DEBUG findfont: score(FontEntry(fname='/home/runner/micromamba/envs/trajan/lib/python3.14/site-packages/matplotlib/mpl-data/fonts/ttf/STIXSizFourSymBol.ttf', index=0, name='STIXSizeFourSym', style='normal', variant='normal', weight=700, stretch='normal', size='scalable')) = 10.335
2026-07-21 14:55:57 runnervm3jd5f matplotlib.font_manager[2874] DEBUG findfont: score(FontEntry(fname='/home/runner/micromamba/envs/trajan/lib/python3.14/site-packages/matplotlib/mpl-data/fonts/ttf/STIXSizOneSymReg.ttf', index=0, name='STIXSizeOneSym', style='normal', variant='normal', weight=400, stretch='normal', size='scalable')) = 10.05
2026-07-21 14:55:57 runnervm3jd5f matplotlib.font_manager[2874] DEBUG findfont: score(FontEntry(fname='/home/runner/micromamba/envs/trajan/lib/python3.14/site-packages/matplotlib/mpl-data/fonts/ttf/cmr10.ttf', index=0, name='cmr10', style='normal', variant='normal', weight=400, stretch='normal', size='scalable')) = 10.05
2026-07-21 14:55:57 runnervm3jd5f matplotlib.font_manager[2874] DEBUG findfont: score(FontEntry(fname='/home/runner/micromamba/envs/trajan/lib/python3.14/site-packages/matplotlib/mpl-data/fonts/ttf/STIXGeneralBol.ttf', index=0, name='STIXGeneral', style='normal', variant='normal', weight=700, stretch='normal', size='scalable')) = 10.335
2026-07-21 14:55:57 runnervm3jd5f matplotlib.font_manager[2874] DEBUG findfont: score(FontEntry(fname='/home/runner/micromamba/envs/trajan/lib/python3.14/site-packages/matplotlib/mpl-data/fonts/ttf/DejaVuSans-BoldOblique.ttf', index=0, name='DejaVu Sans', style='oblique', variant='normal', weight=700, stretch='normal', size='scalable')) = 11.335
2026-07-21 14:55:57 runnervm3jd5f matplotlib.font_manager[2874] DEBUG findfont: score(FontEntry(fname='/home/runner/micromamba/envs/trajan/lib/python3.14/site-packages/matplotlib/mpl-data/fonts/ttf/STIXSizFourSymReg.ttf', index=0, name='STIXSizeFourSym', style='normal', variant='normal', weight=400, stretch='normal', size='scalable')) = 10.05
2026-07-21 14:55:57 runnervm3jd5f matplotlib.font_manager[2874] DEBUG findfont: score(FontEntry(fname='/usr/share/fonts/truetype/lato/Lato-Black.ttf', index=0, name='Lato', style='normal', variant='normal', weight=900, stretch='normal', size='scalable')) = 10.525
2026-07-21 14:55:57 runnervm3jd5f matplotlib.font_manager[2874] DEBUG findfont: score(FontEntry(fname='/usr/share/fonts/truetype/lato/Lato-Black.ttf', index=0, name='Lato Black', style='normal', variant='normal', weight=400, stretch='normal', size='scalable')) = 10.05
2026-07-21 14:55:57 runnervm3jd5f matplotlib.font_manager[2874] DEBUG findfont: score(FontEntry(fname='/usr/share/fonts/truetype/liberation/LiberationSerif-Regular.ttf', index=0, name='Liberation Serif', style='normal', variant='normal', weight=400, stretch='normal', size='scalable')) = 10.05
2026-07-21 14:55:57 runnervm3jd5f matplotlib.font_manager[2874] DEBUG findfont: score(FontEntry(fname='/usr/share/fonts/truetype/dejavu/DejaVuSerifCondensed.ttf', index=0, name='DejaVu Serif', style='normal', variant='normal', weight=400, stretch='condensed', size='scalable')) = 10.25
2026-07-21 14:55:57 runnervm3jd5f matplotlib.font_manager[2874] DEBUG findfont: score(FontEntry(fname='/usr/share/fonts/truetype/dejavu/DejaVuSerifCondensed.ttf', index=0, name='DejaVu Serif Condensed', style='normal', variant='normal', weight=380, stretch='condensed', size='scalable')) = 10.269
2026-07-21 14:55:57 runnervm3jd5f matplotlib.font_manager[2874] DEBUG findfont: score(FontEntry(fname='/home/runner/micromamba/envs/trajan/fonts/UbuntuMono-BI.ttf', index=0, name='Ubuntu Mono', style='italic', variant='normal', weight=700, stretch='normal', size='scalable')) = 11.335
2026-07-21 14:55:57 runnervm3jd5f matplotlib.font_manager[2874] DEBUG findfont: score(FontEntry(fname='/usr/share/fonts/truetype/dejavu/DejaVuSans.ttf', index=0, name='DejaVu Sans', style='normal', variant='normal', weight=400, stretch='normal', size='scalable')) = 10.05
2026-07-21 14:55:57 runnervm3jd5f matplotlib.font_manager[2874] DEBUG findfont: score(FontEntry(fname='/usr/share/fonts/truetype/lato/Lato-Italic.ttf', index=0, name='Lato', style='italic', variant='normal', weight=400, stretch='normal', size='scalable')) = 11.05
2026-07-21 14:55:57 runnervm3jd5f matplotlib.font_manager[2874] DEBUG findfont: score(FontEntry(fname='/usr/share/fonts/truetype/liberation/LiberationSans-Italic.ttf', index=0, name='Liberation Sans', style='italic', variant='normal', weight=400, stretch='normal', size='scalable')) = 11.05
2026-07-21 14:55:57 runnervm3jd5f matplotlib.font_manager[2874] DEBUG findfont: score(FontEntry(fname='/home/runner/micromamba/envs/trajan/fonts/Ubuntu-B.ttf', index=0, name='Ubuntu', style='normal', variant='normal', weight=700, stretch='normal', size='scalable')) = 10.335
2026-07-21 14:55:57 runnervm3jd5f matplotlib.font_manager[2874] DEBUG findfont: score(FontEntry(fname='/home/runner/micromamba/envs/trajan/fonts/SourceCodePro-Semibold.ttf', index=0, name='Source Code Pro', style='normal', variant='normal', weight=600, stretch='normal', size='scalable')) = 10.24
2026-07-21 14:55:57 runnervm3jd5f matplotlib.font_manager[2874] DEBUG findfont: score(FontEntry(fname='/home/runner/micromamba/envs/trajan/fonts/SourceCodePro-Semibold.ttf', index=0, name='Source Code Pro Semibold', style='normal', variant='normal', weight=400, stretch='normal', size='scalable')) = 10.05
2026-07-21 14:55:57 runnervm3jd5f matplotlib.font_manager[2874] DEBUG findfont: score(FontEntry(fname='/home/runner/micromamba/envs/trajan/fonts/SourceCodePro-Bold.ttf', index=0, name='Source Code Pro', style='normal', variant='normal', weight=700, stretch='normal', size='scalable')) = 10.335
2026-07-21 14:55:57 runnervm3jd5f matplotlib.font_manager[2874] DEBUG findfont: score(FontEntry(fname='/home/runner/micromamba/envs/trajan/fonts/Ubuntu-MI.ttf', index=0, name='Ubuntu', style='italic', variant='normal', weight=500, stretch='normal', size='scalable')) = 11.145
2026-07-21 14:55:57 runnervm3jd5f matplotlib.font_manager[2874] DEBUG findfont: score(FontEntry(fname='/home/runner/micromamba/envs/trajan/fonts/Ubuntu-MI.ttf', index=0, name='Ubuntu Light', style='italic', variant='normal', weight=700, stretch='normal', size='scalable')) = 11.335
2026-07-21 14:55:57 runnervm3jd5f matplotlib.font_manager[2874] DEBUG findfont: score(FontEntry(fname='/usr/share/fonts/truetype/lato/Lato-Regular.ttf', index=0, name='Lato', style='normal', variant='normal', weight=400, stretch='normal', size='scalable')) = 10.05
2026-07-21 14:55:57 runnervm3jd5f matplotlib.font_manager[2874] DEBUG findfont: score(FontEntry(fname='/usr/share/fonts/truetype/lato/Lato-ThinItalic.ttf', index=0, name='Lato', style='italic', variant='normal', weight=275, stretch='normal', size='scalable')) = 11.16875
2026-07-21 14:55:57 runnervm3jd5f matplotlib.font_manager[2874] DEBUG findfont: score(FontEntry(fname='/usr/share/fonts/truetype/lato/Lato-ThinItalic.ttf', index=0, name='Lato Thin', style='italic', variant='normal', weight=400, stretch='normal', size='scalable')) = 11.05
2026-07-21 14:55:57 runnervm3jd5f matplotlib.font_manager[2874] DEBUG findfont: score(FontEntry(fname='/usr/share/fonts/truetype/lato/Lato-BlackItalic.ttf', index=0, name='Lato', style='italic', variant='normal', weight=900, stretch='normal', size='scalable')) = 11.525
2026-07-21 14:55:57 runnervm3jd5f matplotlib.font_manager[2874] DEBUG findfont: score(FontEntry(fname='/usr/share/fonts/truetype/lato/Lato-BlackItalic.ttf', index=0, name='Lato Black', style='italic', variant='normal', weight=400, stretch='normal', size='scalable')) = 11.05
2026-07-21 14:55:57 runnervm3jd5f matplotlib.font_manager[2874] DEBUG findfont: score(FontEntry(fname='/usr/share/fonts/truetype/dejavu/DejaVuSerifCondensed-Italic.ttf', index=0, name='DejaVu Serif', style='italic', variant='normal', weight=400, stretch='condensed', size='scalable')) = 11.25
2026-07-21 14:55:57 runnervm3jd5f matplotlib.font_manager[2874] DEBUG findfont: score(FontEntry(fname='/usr/share/fonts/truetype/dejavu/DejaVuSerifCondensed-Italic.ttf', index=0, name='DejaVu Serif Condensed', style='italic', variant='normal', weight=400, stretch='condensed', size='scalable')) = 11.25
2026-07-21 14:55:57 runnervm3jd5f matplotlib.font_manager[2874] DEBUG findfont: score(FontEntry(fname='/usr/share/fonts/truetype/dejavu/DejaVuSans-Bold.ttf', index=0, name='DejaVu Sans', style='normal', variant='normal', weight=700, stretch='normal', size='scalable')) = 10.335
2026-07-21 14:55:57 runnervm3jd5f matplotlib.font_manager[2874] DEBUG findfont: score(FontEntry(fname='/home/runner/micromamba/envs/trajan/fonts/UbuntuMono-R.ttf', index=0, name='Ubuntu Mono', style='normal', variant='normal', weight=400, stretch='normal', size='scalable')) = 10.05
2026-07-21 14:55:57 runnervm3jd5f matplotlib.font_manager[2874] DEBUG findfont: score(FontEntry(fname='/usr/share/fonts/truetype/dejavu/DejaVuSerif-BoldItalic.ttf', index=0, name='DejaVu Serif', style='italic', variant='normal', weight=700, stretch='normal', size='scalable')) = 11.335
2026-07-21 14:55:57 runnervm3jd5f matplotlib.font_manager[2874] DEBUG findfont: score(FontEntry(fname='/usr/share/fonts/truetype/lato/Lato-Hairline.ttf', index=0, name='Lato', style='normal', variant='normal', weight=250, stretch='normal', size='scalable')) = 10.1925
2026-07-21 14:55:57 runnervm3jd5f matplotlib.font_manager[2874] DEBUG findfont: score(FontEntry(fname='/usr/share/fonts/truetype/lato/Lato-Hairline.ttf', index=0, name='Lato Hairline', style='normal', variant='normal', weight=400, stretch='normal', size='scalable')) = 10.05
2026-07-21 14:55:57 runnervm3jd5f matplotlib.font_manager[2874] DEBUG findfont: score(FontEntry(fname='/usr/share/fonts/truetype/lato/Lato-LightItalic.ttf', index=0, name='Lato', style='italic', variant='normal', weight=300, stretch='normal', size='scalable')) = 11.145
2026-07-21 14:55:57 runnervm3jd5f matplotlib.font_manager[2874] DEBUG findfont: score(FontEntry(fname='/usr/share/fonts/truetype/lato/Lato-LightItalic.ttf', index=0, name='Lato Light', style='italic', variant='normal', weight=400, stretch='normal', size='scalable')) = 11.05
2026-07-21 14:55:57 runnervm3jd5f matplotlib.font_manager[2874] DEBUG findfont: score(FontEntry(fname='/usr/share/fonts/truetype/dejavu/DejaVuSansCondensed-BoldOblique.ttf', index=0, name='DejaVu Sans', style='oblique', variant='normal', weight=700, stretch='condensed', size='scalable')) = 11.535
2026-07-21 14:55:57 runnervm3jd5f matplotlib.font_manager[2874] DEBUG findfont: score(FontEntry(fname='/usr/share/fonts/truetype/dejavu/DejaVuSansCondensed-BoldOblique.ttf', index=0, name='DejaVu Sans Condensed', style='oblique', variant='normal', weight=700, stretch='condensed', size='scalable')) = 11.535
2026-07-21 14:55:57 runnervm3jd5f matplotlib.font_manager[2874] DEBUG findfont: score(FontEntry(fname='/home/runner/micromamba/envs/trajan/fonts/SourceCodePro-It.ttf', index=0, name='Source Code Pro', style='italic', variant='normal', weight=400, stretch='normal', size='scalable')) = 11.05
2026-07-21 14:55:57 runnervm3jd5f matplotlib.font_manager[2874] DEBUG findfont: score(FontEntry(fname='/home/runner/micromamba/envs/trajan/fonts/SourceCodePro-ExtraLightIt.ttf', index=0, name='Source Code Pro', style='italic', variant='normal', weight=200, stretch='normal', size='scalable')) = 11.24
2026-07-21 14:55:57 runnervm3jd5f matplotlib.font_manager[2874] DEBUG findfont: score(FontEntry(fname='/home/runner/micromamba/envs/trajan/fonts/SourceCodePro-ExtraLightIt.ttf', index=0, name='Source Code Pro ExtraLight', style='italic', variant='normal', weight=400, stretch='normal', size='scalable')) = 11.05
2026-07-21 14:55:57 runnervm3jd5f matplotlib.font_manager[2874] DEBUG findfont: score(FontEntry(fname='/usr/share/fonts/truetype/lato/Lato-Medium.ttf', index=0, name='Lato', style='normal', variant='normal', weight=500, stretch='normal', size='scalable')) = 10.145
2026-07-21 14:55:57 runnervm3jd5f matplotlib.font_manager[2874] DEBUG findfont: score(FontEntry(fname='/usr/share/fonts/truetype/lato/Lato-Medium.ttf', index=0, name='Lato Medium', style='normal', variant='normal', weight=400, stretch='normal', size='scalable')) = 10.05
2026-07-21 14:55:57 runnervm3jd5f matplotlib.font_manager[2874] DEBUG findfont: score(FontEntry(fname='/usr/share/fonts/truetype/lato/Lato-BoldItalic.ttf', index=0, name='Lato', style='italic', variant='normal', weight=700, stretch='normal', size='scalable')) = 11.335
2026-07-21 14:55:57 runnervm3jd5f matplotlib.font_manager[2874] DEBUG findfont: score(FontEntry(fname='/home/runner/micromamba/envs/trajan/fonts/DejaVuSans.ttf', index=0, name='DejaVu Sans', style='normal', variant='normal', weight=400, stretch='normal', size='scalable')) = 10.05
2026-07-21 14:55:57 runnervm3jd5f matplotlib.font_manager[2874] DEBUG findfont: score(FontEntry(fname='/home/runner/micromamba/envs/trajan/fonts/UbuntuMono-B.ttf', index=0, name='Ubuntu Mono', style='normal', variant='normal', weight=700, stretch='normal', size='scalable')) = 10.335
2026-07-21 14:55:57 runnervm3jd5f matplotlib.font_manager[2874] DEBUG findfont: score(FontEntry(fname='/home/runner/micromamba/envs/trajan/fonts/SourceCodePro-LightIt.ttf', index=0, name='Source Code Pro', style='italic', variant='normal', weight=300, stretch='normal', size='scalable')) = 11.145
2026-07-21 14:55:57 runnervm3jd5f matplotlib.font_manager[2874] DEBUG findfont: score(FontEntry(fname='/home/runner/micromamba/envs/trajan/fonts/SourceCodePro-LightIt.ttf', index=0, name='Source Code Pro Light', style='italic', variant='normal', weight=400, stretch='normal', size='scalable')) = 11.05
2026-07-21 14:55:57 runnervm3jd5f matplotlib.font_manager[2874] DEBUG findfont: score(FontEntry(fname='/usr/share/fonts/truetype/liberation/LiberationSans-BoldItalic.ttf', index=0, name='Liberation Sans', style='italic', variant='normal', weight=700, stretch='normal', size='scalable')) = 11.335
2026-07-21 14:55:57 runnervm3jd5f matplotlib.font_manager[2874] DEBUG findfont: score(FontEntry(fname='/usr/share/fonts/truetype/liberation/LiberationSans-Regular.ttf', index=0, name='Liberation Sans', style='normal', variant='normal', weight=400, stretch='normal', size='scalable')) = 10.05
2026-07-21 14:55:57 runnervm3jd5f matplotlib.font_manager[2874] DEBUG findfont: score(FontEntry(fname='/usr/share/fonts/truetype/dejavu/DejaVuSansMono-Bold.ttf', index=0, name='DejaVu Sans Mono', style='normal', variant='normal', weight=700, stretch='normal', size='scalable')) = 10.335
2026-07-21 14:55:57 runnervm3jd5f matplotlib.font_manager[2874] DEBUG findfont: score(FontEntry(fname='/home/runner/micromamba/envs/trajan/fonts/SourceCodePro-BoldIt.ttf', index=0, name='Source Code Pro', style='italic', variant='normal', weight=700, stretch='normal', size='scalable')) = 11.335
2026-07-21 14:55:57 runnervm3jd5f matplotlib.font_manager[2874] DEBUG findfont: score(FontEntry(fname='/usr/share/fonts/truetype/lato/Lato-Bold.ttf', index=0, name='Lato', style='normal', variant='normal', weight=700, stretch='normal', size='scalable')) = 10.335
2026-07-21 14:55:57 runnervm3jd5f matplotlib.font_manager[2874] DEBUG findfont: score(FontEntry(fname='/usr/share/fonts/truetype/dejavu/DejaVuSansCondensed.ttf', index=0, name='DejaVu Sans', style='normal', variant='normal', weight=400, stretch='condensed', size='scalable')) = 10.25
2026-07-21 14:55:57 runnervm3jd5f matplotlib.font_manager[2874] DEBUG findfont: score(FontEntry(fname='/usr/share/fonts/truetype/dejavu/DejaVuSansCondensed.ttf', index=0, name='DejaVu Sans Condensed', style='normal', variant='normal', weight=380, stretch='condensed', size='scalable')) = 10.269
2026-07-21 14:55:57 runnervm3jd5f matplotlib.font_manager[2874] DEBUG findfont: score(FontEntry(fname='/usr/share/fonts/truetype/lato/Lato-MediumItalic.ttf', index=0, name='Lato', style='italic', variant='normal', weight=500, stretch='normal', size='scalable')) = 11.145
2026-07-21 14:55:57 runnervm3jd5f matplotlib.font_manager[2874] DEBUG findfont: score(FontEntry(fname='/usr/share/fonts/truetype/lato/Lato-MediumItalic.ttf', index=0, name='Lato Medium', style='italic', variant='normal', weight=400, stretch='normal', size='scalable')) = 11.05
2026-07-21 14:55:57 runnervm3jd5f matplotlib.font_manager[2874] DEBUG findfont: score(FontEntry(fname='/usr/share/fonts/truetype/liberation/LiberationSans-Bold.ttf', index=0, name='Liberation Sans', style='normal', variant='normal', weight=700, stretch='normal', size='scalable')) = 10.335
2026-07-21 14:55:57 runnervm3jd5f matplotlib.font_manager[2874] DEBUG findfont: score(FontEntry(fname='/usr/share/fonts/truetype/dejavu/DejaVuSerifCondensed-BoldItalic.ttf', index=0, name='DejaVu Serif', style='italic', variant='normal', weight=700, stretch='condensed', size='scalable')) = 11.535
2026-07-21 14:55:57 runnervm3jd5f matplotlib.font_manager[2874] DEBUG findfont: score(FontEntry(fname='/usr/share/fonts/truetype/dejavu/DejaVuSerifCondensed-BoldItalic.ttf', index=0, name='DejaVu Serif Condensed', style='italic', variant='normal', weight=700, stretch='condensed', size='scalable')) = 11.535
2026-07-21 14:55:57 runnervm3jd5f matplotlib.font_manager[2874] DEBUG findfont: score(FontEntry(fname='/home/runner/micromamba/envs/trajan/fonts/Ubuntu-R.ttf', index=0, name='Ubuntu', style='normal', variant='normal', weight=400, stretch='normal', size='scalable')) = 10.05
2026-07-21 14:55:57 runnervm3jd5f matplotlib.font_manager[2874] DEBUG findfont: score(FontEntry(fname='/usr/share/fonts/truetype/lato/Lato-Light.ttf', index=0, name='Lato', style='normal', variant='normal', weight=300, stretch='normal', size='scalable')) = 10.145
2026-07-21 14:55:57 runnervm3jd5f matplotlib.font_manager[2874] DEBUG findfont: score(FontEntry(fname='/usr/share/fonts/truetype/lato/Lato-Light.ttf', index=0, name='Lato Light', style='normal', variant='normal', weight=400, stretch='normal', size='scalable')) = 10.05
2026-07-21 14:55:57 runnervm3jd5f matplotlib.font_manager[2874] DEBUG findfont: score(FontEntry(fname='/usr/share/fonts/truetype/liberation/LiberationSerif-BoldItalic.ttf', index=0, name='Liberation Serif', style='italic', variant='normal', weight=700, stretch='normal', size='scalable')) = 11.335
2026-07-21 14:55:57 runnervm3jd5f matplotlib.font_manager[2874] DEBUG findfont: score(FontEntry(fname='/home/runner/micromamba/envs/trajan/fonts/Ubuntu-Th.ttf', index=0, name='Ubuntu', style='normal', variant='normal', weight=250, stretch='normal', size='scalable')) = 10.1925
2026-07-21 14:55:57 runnervm3jd5f matplotlib.font_manager[2874] DEBUG findfont: score(FontEntry(fname='/home/runner/micromamba/envs/trajan/fonts/Ubuntu-Th.ttf', index=0, name='Ubuntu Thin', style='normal', variant='normal', weight=400, stretch='normal', size='scalable')) = 10.05
2026-07-21 14:55:57 runnervm3jd5f matplotlib.font_manager[2874] DEBUG findfont: score(FontEntry(fname='/home/runner/micromamba/envs/trajan/fonts/SourceCodePro-ExtraLight.ttf', index=0, name='Source Code Pro', style='normal', variant='normal', weight=200, stretch='normal', size='scalable')) = 10.24
2026-07-21 14:55:57 runnervm3jd5f matplotlib.font_manager[2874] DEBUG findfont: score(FontEntry(fname='/home/runner/micromamba/envs/trajan/fonts/SourceCodePro-ExtraLight.ttf', index=0, name='Source Code Pro ExtraLight', style='normal', variant='normal', weight=400, stretch='normal', size='scalable')) = 10.05
2026-07-21 14:55:57 runnervm3jd5f matplotlib.font_manager[2874] DEBUG findfont: score(FontEntry(fname='/usr/share/fonts/truetype/lato/Lato-Thin.ttf', index=0, name='Lato', style='normal', variant='normal', weight=275, stretch='normal', size='scalable')) = 10.16875
2026-07-21 14:55:57 runnervm3jd5f matplotlib.font_manager[2874] DEBUG findfont: score(FontEntry(fname='/usr/share/fonts/truetype/lato/Lato-Thin.ttf', index=0, name='Lato Thin', style='normal', variant='normal', weight=400, stretch='normal', size='scalable')) = 10.05
2026-07-21 14:55:57 runnervm3jd5f matplotlib.font_manager[2874] DEBUG findfont: score(FontEntry(fname='/usr/share/fonts/truetype/liberation/LiberationSerif-Bold.ttf', index=0, name='Liberation Serif', style='normal', variant='normal', weight=700, stretch='normal', size='scalable')) = 10.335
2026-07-21 14:55:57 runnervm3jd5f matplotlib.font_manager[2874] DEBUG findfont: score(FontEntry(fname='/home/runner/micromamba/envs/trajan/fonts/Inconsolata-Regular.ttf', index=0, name='Inconsolata', style='normal', variant='normal', weight=400, stretch='normal', size='scalable')) = 10.05
2026-07-21 14:55:57 runnervm3jd5f matplotlib.font_manager[2874] DEBUG findfont: score(FontEntry(fname='/home/runner/micromamba/envs/trajan/fonts/Ubuntu-C.ttf', index=0, name='Ubuntu Condensed', style='normal', variant='normal', weight=400, stretch='condensed', size='scalable')) = 10.25
2026-07-21 14:55:57 runnervm3jd5f matplotlib.font_manager[2874] DEBUG findfont: score(FontEntry(fname='/usr/share/fonts/truetype/dejavu/DejaVuSansCondensed-Bold.ttf', index=0, name='DejaVu Sans', style='normal', variant='normal', weight=700, stretch='condensed', size='scalable')) = 10.535
2026-07-21 14:55:57 runnervm3jd5f matplotlib.font_manager[2874] DEBUG findfont: score(FontEntry(fname='/usr/share/fonts/truetype/dejavu/DejaVuSansCondensed-Bold.ttf', index=0, name='DejaVu Sans Condensed', style='normal', variant='normal', weight=700, stretch='condensed', size='scalable')) = 10.535
2026-07-21 14:55:57 runnervm3jd5f matplotlib.font_manager[2874] DEBUG findfont: score(FontEntry(fname='/usr/share/fonts/truetype/liberation/LiberationMono-Bold.ttf', index=0, name='Liberation Mono', style='normal', variant='normal', weight=700, stretch='normal', size='scalable')) = 10.335
2026-07-21 14:55:57 runnervm3jd5f matplotlib.font_manager[2874] DEBUG findfont: score(FontEntry(fname='/home/runner/micromamba/envs/trajan/fonts/SourceCodePro-Black.ttf', index=0, name='Source Code Pro', style='normal', variant='normal', weight=900, stretch='normal', size='scalable')) = 10.525
2026-07-21 14:55:57 runnervm3jd5f matplotlib.font_manager[2874] DEBUG findfont: score(FontEntry(fname='/home/runner/micromamba/envs/trajan/fonts/SourceCodePro-Black.ttf', index=0, name='Source Code Pro Black', style='normal', variant='normal', weight=400, stretch='normal', size='scalable')) = 10.05
2026-07-21 14:55:57 runnervm3jd5f matplotlib.font_manager[2874] DEBUG findfont: score(FontEntry(fname='/home/runner/micromamba/envs/trajan/fonts/SourceCodePro-BlackIt.ttf', index=0, name='Source Code Pro', style='italic', variant='normal', weight=900, stretch='normal', size='scalable')) = 11.525
2026-07-21 14:55:57 runnervm3jd5f matplotlib.font_manager[2874] DEBUG findfont: score(FontEntry(fname='/home/runner/micromamba/envs/trajan/fonts/SourceCodePro-BlackIt.ttf', index=0, name='Source Code Pro Black', style='italic', variant='normal', weight=400, stretch='normal', size='scalable')) = 11.05
2026-07-21 14:55:57 runnervm3jd5f matplotlib.font_manager[2874] DEBUG findfont: score(FontEntry(fname='/home/runner/micromamba/envs/trajan/fonts/Ubuntu-LI.ttf', index=0, name='Ubuntu', style='italic', variant='normal', weight=300, stretch='normal', size='scalable')) = 11.145
2026-07-21 14:55:57 runnervm3jd5f matplotlib.font_manager[2874] DEBUG findfont: score(FontEntry(fname='/home/runner/micromamba/envs/trajan/fonts/Ubuntu-LI.ttf', index=0, name='Ubuntu Light', style='italic', variant='normal', weight=400, stretch='normal', size='scalable')) = 11.05
2026-07-21 14:55:57 runnervm3jd5f matplotlib.font_manager[2874] DEBUG findfont: score(FontEntry(fname='/usr/share/fonts/truetype/liberation/LiberationMono-Regular.ttf', index=0, name='Liberation Mono', style='normal', variant='normal', weight=400, stretch='normal', size='scalable')) = 10.05
2026-07-21 14:55:57 runnervm3jd5f matplotlib.font_manager[2874] DEBUG findfont: score(FontEntry(fname='/home/runner/micromamba/envs/trajan/fonts/UbuntuMono-RI.ttf', index=0, name='Ubuntu Mono', style='italic', variant='normal', weight=400, stretch='normal', size='scalable')) = 11.05
2026-07-21 14:55:57 runnervm3jd5f matplotlib.font_manager[2874] DEBUG findfont: score(FontEntry(fname='/usr/share/fonts/truetype/lato/Lato-Heavy.ttf', index=0, name='Lato', style='normal', variant='normal', weight=800, stretch='normal', size='scalable')) = 10.43
2026-07-21 14:55:57 runnervm3jd5f matplotlib.font_manager[2874] DEBUG findfont: score(FontEntry(fname='/usr/share/fonts/truetype/lato/Lato-Heavy.ttf', index=0, name='Lato Heavy', style='normal', variant='normal', weight=400, stretch='normal', size='scalable')) = 10.05
2026-07-21 14:55:57 runnervm3jd5f matplotlib.font_manager[2874] DEBUG findfont: score(FontEntry(fname='/usr/share/fonts/truetype/lato/Lato-HairlineItalic.ttf', index=0, name='Lato', style='italic', variant='normal', weight=250, stretch='normal', size='scalable')) = 11.1925
2026-07-21 14:55:57 runnervm3jd5f matplotlib.font_manager[2874] DEBUG findfont: score(FontEntry(fname='/usr/share/fonts/truetype/lato/Lato-HairlineItalic.ttf', index=0, name='Lato Hairline', style='italic', variant='normal', weight=400, stretch='normal', size='scalable')) = 11.05
2026-07-21 14:55:57 runnervm3jd5f matplotlib.font_manager[2874] DEBUG findfont: score(FontEntry(fname='/usr/share/fonts/truetype/dejavu/DejaVuSerifCondensed-Bold.ttf', index=0, name='DejaVu Serif', style='normal', variant='normal', weight=700, stretch='condensed', size='scalable')) = 10.535
2026-07-21 14:55:57 runnervm3jd5f matplotlib.font_manager[2874] DEBUG findfont: score(FontEntry(fname='/usr/share/fonts/truetype/dejavu/DejaVuSerifCondensed-Bold.ttf', index=0, name='DejaVu Serif Condensed', style='normal', variant='normal', weight=700, stretch='condensed', size='scalable')) = 10.535
2026-07-21 14:55:57 runnervm3jd5f matplotlib.font_manager[2874] DEBUG findfont: score(FontEntry(fname='/usr/share/fonts/truetype/dejavu/DejaVuSansCondensed-Oblique.ttf', index=0, name='DejaVu Sans', style='oblique', variant='normal', weight=400, stretch='condensed', size='scalable')) = 11.25
2026-07-21 14:55:57 runnervm3jd5f matplotlib.font_manager[2874] DEBUG findfont: score(FontEntry(fname='/usr/share/fonts/truetype/dejavu/DejaVuSansCondensed-Oblique.ttf', index=0, name='DejaVu Sans Condensed', style='oblique', variant='normal', weight=400, stretch='condensed', size='scalable')) = 11.25
2026-07-21 14:55:57 runnervm3jd5f matplotlib.font_manager[2874] DEBUG findfont: score(FontEntry(fname='/usr/share/fonts/truetype/lato/Lato-SemiboldItalic.ttf', index=0, name='Lato', style='italic', variant='normal', weight=600, stretch='normal', size='scalable')) = 11.24
2026-07-21 14:55:57 runnervm3jd5f matplotlib.font_manager[2874] DEBUG findfont: score(FontEntry(fname='/usr/share/fonts/truetype/lato/Lato-SemiboldItalic.ttf', index=0, name='Lato Semibold', style='italic', variant='normal', weight=400, stretch='normal', size='scalable')) = 11.05
2026-07-21 14:55:57 runnervm3jd5f matplotlib.font_manager[2874] DEBUG findfont: score(FontEntry(fname='/usr/share/fonts/truetype/lato/Lato-Semibold.ttf', index=0, name='Lato', style='normal', variant='normal', weight=600, stretch='normal', size='scalable')) = 10.24
2026-07-21 14:55:57 runnervm3jd5f matplotlib.font_manager[2874] DEBUG findfont: score(FontEntry(fname='/usr/share/fonts/truetype/lato/Lato-Semibold.ttf', index=0, name='Lato Semibold', style='normal', variant='normal', weight=400, stretch='normal', size='scalable')) = 10.05
2026-07-21 14:55:57 runnervm3jd5f matplotlib.font_manager[2874] DEBUG findfont: score(FontEntry(fname='/home/runner/micromamba/envs/trajan/fonts/Inconsolata-Bold.ttf', index=0, name='Inconsolata', style='normal', variant='normal', weight=700, stretch='normal', size='scalable')) = 10.335
2026-07-21 14:55:57 runnervm3jd5f matplotlib.font_manager[2874] DEBUG findfont: score(FontEntry(fname='/usr/share/fonts/truetype/dejavu/DejaVuSans-ExtraLight.ttf', index=0, name='DejaVu Sans', style='normal', variant='normal', weight=200, stretch='normal', size='scalable')) = 10.24
2026-07-21 14:55:57 runnervm3jd5f matplotlib.font_manager[2874] DEBUG findfont: score(FontEntry(fname='/usr/share/fonts/truetype/dejavu/DejaVuSans-ExtraLight.ttf', index=0, name='DejaVu Sans Light', style='normal', variant='normal', weight=200, stretch='normal', size='scalable')) = 10.24
2026-07-21 14:55:57 runnervm3jd5f matplotlib.font_manager[2874] DEBUG findfont: score(FontEntry(fname='/home/runner/micromamba/envs/trajan/fonts/Ubuntu-BI.ttf', index=0, name='Ubuntu', style='italic', variant='normal', weight=700, stretch='normal', size='scalable')) = 11.335
2026-07-21 14:55:57 runnervm3jd5f matplotlib.font_manager[2874] DEBUG findfont: score(FontEntry(fname='/usr/share/fonts/truetype/dejavu/DejaVuSans-BoldOblique.ttf', index=0, name='DejaVu Sans', style='oblique', variant='normal', weight=700, stretch='normal', size='scalable')) = 11.335
2026-07-21 14:55:57 runnervm3jd5f matplotlib.font_manager[2874] DEBUG findfont: score(FontEntry(fname='/home/runner/micromamba/envs/trajan/fonts/Ubuntu-RI.ttf', index=0, name='Ubuntu', style='italic', variant='normal', weight=400, stretch='normal', size='scalable')) = 11.05
2026-07-21 14:55:57 runnervm3jd5f matplotlib.font_manager[2874] DEBUG findfont: score(FontEntry(fname='/usr/share/fonts/truetype/dejavu/DejaVuSerif-Italic.ttf', index=0, name='DejaVu Serif', style='italic', variant='normal', weight=400, stretch='normal', size='scalable')) = 11.05
2026-07-21 14:55:57 runnervm3jd5f matplotlib.font_manager[2874] DEBUG findfont: score(FontEntry(fname='/home/runner/micromamba/envs/trajan/fonts/SourceCodePro-Medium.ttf', index=0, name='Source Code Pro', style='normal', variant='normal', weight=500, stretch='normal', size='scalable')) = 10.145
2026-07-21 14:55:57 runnervm3jd5f matplotlib.font_manager[2874] DEBUG findfont: score(FontEntry(fname='/home/runner/micromamba/envs/trajan/fonts/SourceCodePro-Medium.ttf', index=0, name='Source Code Pro Medium', style='normal', variant='normal', weight=400, stretch='normal', size='scalable')) = 10.05
2026-07-21 14:55:57 runnervm3jd5f matplotlib.font_manager[2874] DEBUG findfont: score(FontEntry(fname='/usr/share/fonts/truetype/lato/Lato-HeavyItalic.ttf', index=0, name='Lato', style='italic', variant='normal', weight=800, stretch='normal', size='scalable')) = 11.43
2026-07-21 14:55:57 runnervm3jd5f matplotlib.font_manager[2874] DEBUG findfont: score(FontEntry(fname='/usr/share/fonts/truetype/lato/Lato-HeavyItalic.ttf', index=0, name='Lato Heavy', style='italic', variant='normal', weight=400, stretch='normal', size='scalable')) = 11.05
2026-07-21 14:55:57 runnervm3jd5f matplotlib.font_manager[2874] DEBUG findfont: score(FontEntry(fname='/usr/share/fonts/truetype/dejavu/DejaVuSans-Oblique.ttf', index=0, name='DejaVu Sans', style='oblique', variant='normal', weight=400, stretch='normal', size='scalable')) = 11.05
2026-07-21 14:55:57 runnervm3jd5f matplotlib.font_manager[2874] DEBUG findfont: score(FontEntry(fname='/home/runner/micromamba/envs/trajan/fonts/Ubuntu-M.ttf', index=0, name='Ubuntu', style='normal', variant='normal', weight=500, stretch='normal', size='scalable')) = 10.145
2026-07-21 14:55:57 runnervm3jd5f matplotlib.font_manager[2874] DEBUG findfont: score(FontEntry(fname='/home/runner/micromamba/envs/trajan/fonts/Ubuntu-M.ttf', index=0, name='Ubuntu Light', style='normal', variant='normal', weight=700, stretch='normal', size='scalable')) = 10.335
2026-07-21 14:55:57 runnervm3jd5f matplotlib.font_manager[2874] DEBUG findfont: score(FontEntry(fname='/usr/share/fonts/truetype/liberation/LiberationMono-BoldItalic.ttf', index=0, name='Liberation Mono', style='italic', variant='normal', weight=700, stretch='normal', size='scalable')) = 11.335
2026-07-21 14:55:57 runnervm3jd5f matplotlib.font_manager[2874] DEBUG findfont: score(FontEntry(fname='/usr/share/fonts/truetype/dejavu/DejaVuSansMono.ttf', index=0, name='DejaVu Sans Mono', style='normal', variant='normal', weight=400, stretch='normal', size='scalable')) = 10.05
2026-07-21 14:55:57 runnervm3jd5f matplotlib.font_manager[2874] DEBUG findfont: score(FontEntry(fname='/usr/share/fonts/truetype/dejavu/DejaVuMathTeXGyre.ttf', index=0, name='DejaVu Math TeX Gyre', style='normal', variant='normal', weight=400, stretch='normal', size='scalable')) = 10.05
2026-07-21 14:55:57 runnervm3jd5f matplotlib.font_manager[2874] DEBUG findfont: score(FontEntry(fname='/usr/share/fonts/truetype/dejavu/DejaVuSansMono-Oblique.ttf', index=0, name='DejaVu Sans Mono', style='oblique', variant='normal', weight=400, stretch='normal', size='scalable')) = 11.05
2026-07-21 14:55:57 runnervm3jd5f matplotlib.font_manager[2874] DEBUG findfont: score(FontEntry(fname='/home/runner/micromamba/envs/trajan/fonts/Ubuntu-L.ttf', index=0, name='Ubuntu', style='normal', variant='normal', weight=300, stretch='normal', size='scalable')) = 10.145
2026-07-21 14:55:57 runnervm3jd5f matplotlib.font_manager[2874] DEBUG findfont: score(FontEntry(fname='/home/runner/micromamba/envs/trajan/fonts/Ubuntu-L.ttf', index=0, name='Ubuntu Light', style='normal', variant='normal', weight=400, stretch='normal', size='scalable')) = 10.05
2026-07-21 14:55:57 runnervm3jd5f matplotlib.font_manager[2874] DEBUG findfont: score(FontEntry(fname='/home/runner/micromamba/envs/trajan/fonts/SourceCodePro-MediumIt.ttf', index=0, name='Source Code Pro', style='italic', variant='normal', weight=500, stretch='normal', size='scalable')) = 11.145
2026-07-21 14:55:57 runnervm3jd5f matplotlib.font_manager[2874] DEBUG findfont: score(FontEntry(fname='/home/runner/micromamba/envs/trajan/fonts/SourceCodePro-MediumIt.ttf', index=0, name='Source Code Pro Medium', style='italic', variant='normal', weight=400, stretch='normal', size='scalable')) = 11.05
2026-07-21 14:55:57 runnervm3jd5f matplotlib.font_manager[2874] DEBUG findfont: score(FontEntry(fname='/home/runner/micromamba/envs/trajan/fonts/SourceCodePro-Regular.ttf', index=0, name='Source Code Pro', style='normal', variant='normal', weight=400, stretch='normal', size='scalable')) = 10.05
2026-07-21 14:55:57 runnervm3jd5f matplotlib.font_manager[2874] DEBUG findfont: score(FontEntry(fname='/home/runner/micromamba/envs/trajan/fonts/SourceCodePro-SemiboldIt.ttf', index=0, name='Source Code Pro', style='italic', variant='normal', weight=600, stretch='normal', size='scalable')) = 11.24
2026-07-21 14:55:57 runnervm3jd5f matplotlib.font_manager[2874] DEBUG findfont: score(FontEntry(fname='/home/runner/micromamba/envs/trajan/fonts/SourceCodePro-SemiboldIt.ttf', index=0, name='Source Code Pro Semibold', style='italic', variant='normal', weight=400, stretch='normal', size='scalable')) = 11.05
2026-07-21 14:55:57 runnervm3jd5f matplotlib.font_manager[2874] DEBUG findfont: score(FontEntry(fname='/usr/share/fonts/truetype/dejavu/DejaVuSerif.ttf', index=0, name='DejaVu Serif', style='normal', variant='normal', weight=400, stretch='normal', size='scalable')) = 10.05
2026-07-21 14:55:57 runnervm3jd5f matplotlib.font_manager[2874] DEBUG findfont: score(FontEntry(fname='/usr/share/fonts/truetype/dejavu/DejaVuSerif-Bold.ttf', index=0, name='DejaVu Serif', style='normal', variant='normal', weight=700, stretch='normal', size='scalable')) = 10.335
2026-07-21 14:55:57 runnervm3jd5f matplotlib.font_manager[2874] DEBUG findfont: score(FontEntry(fname='/usr/share/fonts/truetype/liberation/LiberationSerif-Italic.ttf', index=0, name='Liberation Serif', style='italic', variant='normal', weight=400, stretch='normal', size='scalable')) = 11.05
2026-07-21 14:55:57 runnervm3jd5f matplotlib.font_manager[2874] DEBUG findfont: score(FontEntry(fname='/usr/share/fonts/truetype/dejavu/DejaVuSansMono-BoldOblique.ttf', index=0, name='DejaVu Sans Mono', style='oblique', variant='normal', weight=700, stretch='normal', size='scalable')) = 11.335
2026-07-21 14:55:57 runnervm3jd5f matplotlib.font_manager[2874] DEBUG findfont: score(FontEntry(fname='/home/runner/micromamba/envs/trajan/fonts/SourceCodePro-Light.ttf', index=0, name='Source Code Pro', style='normal', variant='normal', weight=300, stretch='normal', size='scalable')) = 10.145
2026-07-21 14:55:57 runnervm3jd5f matplotlib.font_manager[2874] DEBUG findfont: score(FontEntry(fname='/home/runner/micromamba/envs/trajan/fonts/SourceCodePro-Light.ttf', index=0, name='Source Code Pro Light', style='normal', variant='normal', weight=400, stretch='normal', size='scalable')) = 10.05
2026-07-21 14:55:57 runnervm3jd5f matplotlib.font_manager[2874] DEBUG findfont: score(FontEntry(fname='/usr/share/fonts/truetype/liberation/LiberationMono-Italic.ttf', index=0, name='Liberation Mono', style='italic', variant='normal', weight=400, stretch='normal', size='scalable')) = 11.05
2026-07-21 14:55:57 runnervm3jd5f matplotlib.font_manager[2874] DEBUG findfont: Matching cmtt10:style=normal:variant=normal:weight=normal:stretch=normal:size=10.0 to cmtt10 ('/home/runner/micromamba/envs/trajan/lib/python3.14/site-packages/matplotlib/mpl-data/fonts/ttf/cmtt10.ttf') with score of 0.050000.
2026-07-21 14:55:57 runnervm3jd5f matplotlib.font_manager[2874] DEBUG findfont: Matching cmti10:style=normal:variant=normal:weight=normal:stretch=normal:size=10.0.
2026-07-21 14:55:57 runnervm3jd5f matplotlib.font_manager[2874] DEBUG findfont: score(FontEntry(fname='/home/runner/micromamba/envs/trajan/lib/python3.14/site-packages/matplotlib/mpl-data/fonts/ttf/cmmi10.ttf', index=0, name='cmmi10', style='normal', variant='normal', weight=400, stretch='normal', size='scalable')) = 10.05
2026-07-21 14:55:57 runnervm3jd5f matplotlib.font_manager[2874] DEBUG findfont: score(FontEntry(fname='/home/runner/micromamba/envs/trajan/lib/python3.14/site-packages/matplotlib/mpl-data/fonts/ttf/DejaVuSerif-Bold.ttf', index=0, name='DejaVu Serif', style='normal', variant='normal', weight=700, stretch='normal', size='scalable')) = 10.335
2026-07-21 14:55:57 runnervm3jd5f matplotlib.font_manager[2874] DEBUG findfont: score(FontEntry(fname='/home/runner/micromamba/envs/trajan/lib/python3.14/site-packages/matplotlib/mpl-data/fonts/ttf/DejaVuSans-Oblique.ttf', index=0, name='DejaVu Sans', style='oblique', variant='normal', weight=400, stretch='normal', size='scalable')) = 11.05
2026-07-21 14:55:57 runnervm3jd5f matplotlib.font_manager[2874] DEBUG findfont: score(FontEntry(fname='/home/runner/micromamba/envs/trajan/lib/python3.14/site-packages/matplotlib/mpl-data/fonts/ttf/STIXSizThreeSymReg.ttf', index=0, name='STIXSizeThreeSym', style='normal', variant='normal', weight=400, stretch='normal', size='scalable')) = 10.05
2026-07-21 14:55:57 runnervm3jd5f matplotlib.font_manager[2874] DEBUG findfont: score(FontEntry(fname='/home/runner/micromamba/envs/trajan/lib/python3.14/site-packages/matplotlib/mpl-data/fonts/ttf/STIXNonUniBolIta.ttf', index=0, name='STIXNonUnicode', style='italic', variant='normal', weight=700, stretch='normal', size='scalable')) = 11.335
2026-07-21 14:55:57 runnervm3jd5f matplotlib.font_manager[2874] DEBUG findfont: score(FontEntry(fname='/home/runner/micromamba/envs/trajan/lib/python3.14/site-packages/matplotlib/mpl-data/fonts/ttf/DejaVuSerifDisplay.ttf', index=0, name='DejaVu Serif Display', style='normal', variant='normal', weight=400, stretch='normal', size='scalable')) = 10.05
2026-07-21 14:55:57 runnervm3jd5f matplotlib.font_manager[2874] DEBUG findfont: score(FontEntry(fname='/home/runner/micromamba/envs/trajan/lib/python3.14/site-packages/matplotlib/mpl-data/fonts/ttf/cmss10.ttf', index=0, name='cmss10', style='normal', variant='normal', weight=400, stretch='normal', size='scalable')) = 10.05
2026-07-21 14:55:57 runnervm3jd5f matplotlib.font_manager[2874] DEBUG findfont: score(FontEntry(fname='/home/runner/micromamba/envs/trajan/lib/python3.14/site-packages/matplotlib/mpl-data/fonts/ttf/STIXGeneralBolIta.ttf', index=0, name='STIXGeneral', style='italic', variant='normal', weight=700, stretch='normal', size='scalable')) = 11.335
2026-07-21 14:55:57 runnervm3jd5f matplotlib.font_manager[2874] DEBUG findfont: score(FontEntry(fname='/home/runner/micromamba/envs/trajan/lib/python3.14/site-packages/matplotlib/mpl-data/fonts/ttf/cmtt10.ttf', index=0, name='cmtt10', style='normal', variant='normal', weight=400, stretch='normal', size='scalable')) = 10.05
2026-07-21 14:55:57 runnervm3jd5f matplotlib.font_manager[2874] DEBUG findfont: score(FontEntry(fname='/home/runner/micromamba/envs/trajan/lib/python3.14/site-packages/matplotlib/mpl-data/fonts/ttf/cmsy10.ttf', index=0, name='cmsy10', style='normal', variant='normal', weight=400, stretch='normal', size='scalable')) = 10.05
2026-07-21 14:55:57 runnervm3jd5f matplotlib.font_manager[2874] DEBUG findfont: score(FontEntry(fname='/home/runner/micromamba/envs/trajan/lib/python3.14/site-packages/matplotlib/mpl-data/fonts/ttf/DejaVuSansMono-Oblique.ttf', index=0, name='DejaVu Sans Mono', style='oblique', variant='normal', weight=400, stretch='normal', size='scalable')) = 11.05
2026-07-21 14:55:57 runnervm3jd5f matplotlib.font_manager[2874] DEBUG findfont: score(FontEntry(fname='/home/runner/micromamba/envs/trajan/lib/python3.14/site-packages/matplotlib/mpl-data/fonts/ttf/STIXNonUniIta.ttf', index=0, name='STIXNonUnicode', style='italic', variant='normal', weight=400, stretch='normal', size='scalable')) = 11.05
2026-07-21 14:55:57 runnervm3jd5f matplotlib.font_manager[2874] DEBUG findfont: score(FontEntry(fname='/home/runner/micromamba/envs/trajan/lib/python3.14/site-packages/matplotlib/mpl-data/fonts/ttf/STIXGeneral.ttf', index=0, name='STIXGeneral', style='normal', variant='normal', weight=400, stretch='normal', size='scalable')) = 10.05
2026-07-21 14:55:57 runnervm3jd5f matplotlib.font_manager[2874] DEBUG findfont: score(FontEntry(fname='/home/runner/micromamba/envs/trajan/lib/python3.14/site-packages/matplotlib/mpl-data/fonts/ttf/cmti10.ttf', index=0, name='cmti10', style='normal', variant='normal', weight=400, stretch='normal', size='scalable')) = 0.05
2026-07-21 14:55:57 runnervm3jd5f matplotlib.font_manager[2874] DEBUG findfont: score(FontEntry(fname='/home/runner/micromamba/envs/trajan/lib/python3.14/site-packages/matplotlib/mpl-data/fonts/ttf/DejaVuSansMono-BoldOblique.ttf', index=0, name='DejaVu Sans Mono', style='oblique', variant='normal', weight=700, stretch='normal', size='scalable')) = 11.335
2026-07-21 14:55:57 runnervm3jd5f matplotlib.font_manager[2874] DEBUG findfont: score(FontEntry(fname='/home/runner/micromamba/envs/trajan/lib/python3.14/site-packages/matplotlib/mpl-data/fonts/ttf/DejaVuSerif.ttf', index=0, name='DejaVu Serif', style='normal', variant='normal', weight=400, stretch='normal', size='scalable')) = 10.05
2026-07-21 14:55:57 runnervm3jd5f matplotlib.font_manager[2874] DEBUG findfont: score(FontEntry(fname='/home/runner/micromamba/envs/trajan/lib/python3.14/site-packages/matplotlib/mpl-data/fonts/ttf/LastResortHE-Regular.ttf', index=0, name='Last Resort High-Efficiency', style='normal', variant='normal', weight=400, stretch='normal', size='scalable')) = 10.05
2026-07-21 14:55:57 runnervm3jd5f matplotlib.font_manager[2874] DEBUG findfont: score(FontEntry(fname='/home/runner/micromamba/envs/trajan/lib/python3.14/site-packages/matplotlib/mpl-data/fonts/ttf/cmex10.ttf', index=0, name='cmex10', style='normal', variant='normal', weight=400, stretch='normal', size='scalable')) = 10.05
2026-07-21 14:55:57 runnervm3jd5f matplotlib.font_manager[2874] DEBUG findfont: score(FontEntry(fname='/home/runner/micromamba/envs/trajan/lib/python3.14/site-packages/matplotlib/mpl-data/fonts/ttf/STIXSizFiveSymReg.ttf', index=0, name='STIXSizeFiveSym', style='normal', variant='normal', weight=400, stretch='normal', size='scalable')) = 10.05
2026-07-21 14:55:57 runnervm3jd5f matplotlib.font_manager[2874] DEBUG findfont: score(FontEntry(fname='/home/runner/micromamba/envs/trajan/lib/python3.14/site-packages/matplotlib/mpl-data/fonts/ttf/STIXNonUniBol.ttf', index=0, name='STIXNonUnicode', style='normal', variant='normal', weight=700, stretch='normal', size='scalable')) = 10.335
2026-07-21 14:55:57 runnervm3jd5f matplotlib.font_manager[2874] DEBUG findfont: score(FontEntry(fname='/home/runner/micromamba/envs/trajan/lib/python3.14/site-packages/matplotlib/mpl-data/fonts/ttf/DejaVuSansDisplay.ttf', index=0, name='DejaVu Sans Display', style='normal', variant='normal', weight=400, stretch='normal', size='scalable')) = 10.05
2026-07-21 14:55:57 runnervm3jd5f matplotlib.font_manager[2874] DEBUG findfont: score(FontEntry(fname='/home/runner/micromamba/envs/trajan/lib/python3.14/site-packages/matplotlib/mpl-data/fonts/ttf/DejaVuSansMono.ttf', index=0, name='DejaVu Sans Mono', style='normal', variant='normal', weight=400, stretch='normal', size='scalable')) = 10.05
2026-07-21 14:55:57 runnervm3jd5f matplotlib.font_manager[2874] DEBUG findfont: score(FontEntry(fname='/home/runner/micromamba/envs/trajan/lib/python3.14/site-packages/matplotlib/mpl-data/fonts/ttf/cmb10.ttf', index=0, name='cmb10', style='normal', variant='normal', weight=400, stretch='normal', size='scalable')) = 10.05
2026-07-21 14:55:57 runnervm3jd5f matplotlib.font_manager[2874] DEBUG findfont: score(FontEntry(fname='/home/runner/micromamba/envs/trajan/lib/python3.14/site-packages/matplotlib/mpl-data/fonts/ttf/STIXSizTwoSymReg.ttf', index=0, name='STIXSizeTwoSym', style='normal', variant='normal', weight=400, stretch='normal', size='scalable')) = 10.05
2026-07-21 14:55:57 runnervm3jd5f matplotlib.font_manager[2874] DEBUG findfont: score(FontEntry(fname='/home/runner/micromamba/envs/trajan/lib/python3.14/site-packages/matplotlib/mpl-data/fonts/ttf/DejaVuSans.ttf', index=0, name='DejaVu Sans', style='normal', variant='normal', weight=400, stretch='normal', size='scalable')) = 10.05
2026-07-21 14:55:57 runnervm3jd5f matplotlib.font_manager[2874] DEBUG findfont: score(FontEntry(fname='/home/runner/micromamba/envs/trajan/lib/python3.14/site-packages/matplotlib/mpl-data/fonts/ttf/STIXNonUni.ttf', index=0, name='STIXNonUnicode', style='normal', variant='normal', weight=400, stretch='normal', size='scalable')) = 10.05
2026-07-21 14:55:57 runnervm3jd5f matplotlib.font_manager[2874] DEBUG findfont: score(FontEntry(fname='/home/runner/micromamba/envs/trajan/lib/python3.14/site-packages/matplotlib/mpl-data/fonts/ttf/STIXGeneralItalic.ttf', index=0, name='STIXGeneral', style='italic', variant='normal', weight=400, stretch='normal', size='scalable')) = 11.05
2026-07-21 14:55:57 runnervm3jd5f matplotlib.font_manager[2874] DEBUG findfont: score(FontEntry(fname='/home/runner/micromamba/envs/trajan/lib/python3.14/site-packages/matplotlib/mpl-data/fonts/ttf/STIXSizOneSymBol.ttf', index=0, name='STIXSizeOneSym', style='normal', variant='normal', weight=700, stretch='normal', size='scalable')) = 10.335
2026-07-21 14:55:57 runnervm3jd5f matplotlib.font_manager[2874] DEBUG findfont: score(FontEntry(fname='/home/runner/micromamba/envs/trajan/lib/python3.14/site-packages/matplotlib/mpl-data/fonts/ttf/DejaVuSansMono-Bold.ttf', index=0, name='DejaVu Sans Mono', style='normal', variant='normal', weight=700, stretch='normal', size='scalable')) = 10.335
2026-07-21 14:55:57 runnervm3jd5f matplotlib.font_manager[2874] DEBUG findfont: score(FontEntry(fname='/home/runner/micromamba/envs/trajan/lib/python3.14/site-packages/matplotlib/mpl-data/fonts/ttf/STIXSizTwoSymBol.ttf', index=0, name='STIXSizeTwoSym', style='normal', variant='normal', weight=700, stretch='normal', size='scalable')) = 10.335
2026-07-21 14:55:57 runnervm3jd5f matplotlib.font_manager[2874] DEBUG findfont: score(FontEntry(fname='/home/runner/micromamba/envs/trajan/lib/python3.14/site-packages/matplotlib/mpl-data/fonts/ttf/STIXSizThreeSymBol.ttf', index=0, name='STIXSizeThreeSym', style='normal', variant='normal', weight=700, stretch='normal', size='scalable')) = 10.335
2026-07-21 14:55:57 runnervm3jd5f matplotlib.font_manager[2874] DEBUG findfont: score(FontEntry(fname='/home/runner/micromamba/envs/trajan/lib/python3.14/site-packages/matplotlib/mpl-data/fonts/ttf/DejaVuSerif-BoldItalic.ttf', index=0, name='DejaVu Serif', style='italic', variant='normal', weight=700, stretch='normal', size='scalable')) = 11.335
2026-07-21 14:55:57 runnervm3jd5f matplotlib.font_manager[2874] DEBUG findfont: score(FontEntry(fname='/home/runner/micromamba/envs/trajan/lib/python3.14/site-packages/matplotlib/mpl-data/fonts/ttf/DejaVuSerif-Italic.ttf', index=0, name='DejaVu Serif', style='italic', variant='normal', weight=400, stretch='normal', size='scalable')) = 11.05
2026-07-21 14:55:57 runnervm3jd5f matplotlib.font_manager[2874] DEBUG findfont: score(FontEntry(fname='/home/runner/micromamba/envs/trajan/lib/python3.14/site-packages/matplotlib/mpl-data/fonts/ttf/DejaVuSans-Bold.ttf', index=0, name='DejaVu Sans', style='normal', variant='normal', weight=700, stretch='normal', size='scalable')) = 10.335
2026-07-21 14:55:57 runnervm3jd5f matplotlib.font_manager[2874] DEBUG findfont: score(FontEntry(fname='/home/runner/micromamba/envs/trajan/lib/python3.14/site-packages/matplotlib/mpl-data/fonts/ttf/STIXSizFourSymBol.ttf', index=0, name='STIXSizeFourSym', style='normal', variant='normal', weight=700, stretch='normal', size='scalable')) = 10.335
2026-07-21 14:55:57 runnervm3jd5f matplotlib.font_manager[2874] DEBUG findfont: score(FontEntry(fname='/home/runner/micromamba/envs/trajan/lib/python3.14/site-packages/matplotlib/mpl-data/fonts/ttf/STIXSizOneSymReg.ttf', index=0, name='STIXSizeOneSym', style='normal', variant='normal', weight=400, stretch='normal', size='scalable')) = 10.05
2026-07-21 14:55:57 runnervm3jd5f matplotlib.font_manager[2874] DEBUG findfont: score(FontEntry(fname='/home/runner/micromamba/envs/trajan/lib/python3.14/site-packages/matplotlib/mpl-data/fonts/ttf/cmr10.ttf', index=0, name='cmr10', style='normal', variant='normal', weight=400, stretch='normal', size='scalable')) = 10.05
2026-07-21 14:55:57 runnervm3jd5f matplotlib.font_manager[2874] DEBUG findfont: score(FontEntry(fname='/home/runner/micromamba/envs/trajan/lib/python3.14/site-packages/matplotlib/mpl-data/fonts/ttf/STIXGeneralBol.ttf', index=0, name='STIXGeneral', style='normal', variant='normal', weight=700, stretch='normal', size='scalable')) = 10.335
2026-07-21 14:55:57 runnervm3jd5f matplotlib.font_manager[2874] DEBUG findfont: score(FontEntry(fname='/home/runner/micromamba/envs/trajan/lib/python3.14/site-packages/matplotlib/mpl-data/fonts/ttf/DejaVuSans-BoldOblique.ttf', index=0, name='DejaVu Sans', style='oblique', variant='normal', weight=700, stretch='normal', size='scalable')) = 11.335
2026-07-21 14:55:57 runnervm3jd5f matplotlib.font_manager[2874] DEBUG findfont: score(FontEntry(fname='/home/runner/micromamba/envs/trajan/lib/python3.14/site-packages/matplotlib/mpl-data/fonts/ttf/STIXSizFourSymReg.ttf', index=0, name='STIXSizeFourSym', style='normal', variant='normal', weight=400, stretch='normal', size='scalable')) = 10.05
2026-07-21 14:55:57 runnervm3jd5f matplotlib.font_manager[2874] DEBUG findfont: score(FontEntry(fname='/usr/share/fonts/truetype/lato/Lato-Black.ttf', index=0, name='Lato', style='normal', variant='normal', weight=900, stretch='normal', size='scalable')) = 10.525
2026-07-21 14:55:57 runnervm3jd5f matplotlib.font_manager[2874] DEBUG findfont: score(FontEntry(fname='/usr/share/fonts/truetype/lato/Lato-Black.ttf', index=0, name='Lato Black', style='normal', variant='normal', weight=400, stretch='normal', size='scalable')) = 10.05
2026-07-21 14:55:57 runnervm3jd5f matplotlib.font_manager[2874] DEBUG findfont: score(FontEntry(fname='/usr/share/fonts/truetype/liberation/LiberationSerif-Regular.ttf', index=0, name='Liberation Serif', style='normal', variant='normal', weight=400, stretch='normal', size='scalable')) = 10.05
2026-07-21 14:55:57 runnervm3jd5f matplotlib.font_manager[2874] DEBUG findfont: score(FontEntry(fname='/usr/share/fonts/truetype/dejavu/DejaVuSerifCondensed.ttf', index=0, name='DejaVu Serif', style='normal', variant='normal', weight=400, stretch='condensed', size='scalable')) = 10.25
2026-07-21 14:55:57 runnervm3jd5f matplotlib.font_manager[2874] DEBUG findfont: score(FontEntry(fname='/usr/share/fonts/truetype/dejavu/DejaVuSerifCondensed.ttf', index=0, name='DejaVu Serif Condensed', style='normal', variant='normal', weight=380, stretch='condensed', size='scalable')) = 10.269
2026-07-21 14:55:57 runnervm3jd5f matplotlib.font_manager[2874] DEBUG findfont: score(FontEntry(fname='/home/runner/micromamba/envs/trajan/fonts/UbuntuMono-BI.ttf', index=0, name='Ubuntu Mono', style='italic', variant='normal', weight=700, stretch='normal', size='scalable')) = 11.335
2026-07-21 14:55:57 runnervm3jd5f matplotlib.font_manager[2874] DEBUG findfont: score(FontEntry(fname='/usr/share/fonts/truetype/dejavu/DejaVuSans.ttf', index=0, name='DejaVu Sans', style='normal', variant='normal', weight=400, stretch='normal', size='scalable')) = 10.05
2026-07-21 14:55:57 runnervm3jd5f matplotlib.font_manager[2874] DEBUG findfont: score(FontEntry(fname='/usr/share/fonts/truetype/lato/Lato-Italic.ttf', index=0, name='Lato', style='italic', variant='normal', weight=400, stretch='normal', size='scalable')) = 11.05
2026-07-21 14:55:57 runnervm3jd5f matplotlib.font_manager[2874] DEBUG findfont: score(FontEntry(fname='/usr/share/fonts/truetype/liberation/LiberationSans-Italic.ttf', index=0, name='Liberation Sans', style='italic', variant='normal', weight=400, stretch='normal', size='scalable')) = 11.05
2026-07-21 14:55:57 runnervm3jd5f matplotlib.font_manager[2874] DEBUG findfont: score(FontEntry(fname='/home/runner/micromamba/envs/trajan/fonts/Ubuntu-B.ttf', index=0, name='Ubuntu', style='normal', variant='normal', weight=700, stretch='normal', size='scalable')) = 10.335
2026-07-21 14:55:57 runnervm3jd5f matplotlib.font_manager[2874] DEBUG findfont: score(FontEntry(fname='/home/runner/micromamba/envs/trajan/fonts/SourceCodePro-Semibold.ttf', index=0, name='Source Code Pro', style='normal', variant='normal', weight=600, stretch='normal', size='scalable')) = 10.24
2026-07-21 14:55:57 runnervm3jd5f matplotlib.font_manager[2874] DEBUG findfont: score(FontEntry(fname='/home/runner/micromamba/envs/trajan/fonts/SourceCodePro-Semibold.ttf', index=0, name='Source Code Pro Semibold', style='normal', variant='normal', weight=400, stretch='normal', size='scalable')) = 10.05
2026-07-21 14:55:57 runnervm3jd5f matplotlib.font_manager[2874] DEBUG findfont: score(FontEntry(fname='/home/runner/micromamba/envs/trajan/fonts/SourceCodePro-Bold.ttf', index=0, name='Source Code Pro', style='normal', variant='normal', weight=700, stretch='normal', size='scalable')) = 10.335
2026-07-21 14:55:57 runnervm3jd5f matplotlib.font_manager[2874] DEBUG findfont: score(FontEntry(fname='/home/runner/micromamba/envs/trajan/fonts/Ubuntu-MI.ttf', index=0, name='Ubuntu', style='italic', variant='normal', weight=500, stretch='normal', size='scalable')) = 11.145
2026-07-21 14:55:57 runnervm3jd5f matplotlib.font_manager[2874] DEBUG findfont: score(FontEntry(fname='/home/runner/micromamba/envs/trajan/fonts/Ubuntu-MI.ttf', index=0, name='Ubuntu Light', style='italic', variant='normal', weight=700, stretch='normal', size='scalable')) = 11.335
2026-07-21 14:55:57 runnervm3jd5f matplotlib.font_manager[2874] DEBUG findfont: score(FontEntry(fname='/usr/share/fonts/truetype/lato/Lato-Regular.ttf', index=0, name='Lato', style='normal', variant='normal', weight=400, stretch='normal', size='scalable')) = 10.05
2026-07-21 14:55:57 runnervm3jd5f matplotlib.font_manager[2874] DEBUG findfont: score(FontEntry(fname='/usr/share/fonts/truetype/lato/Lato-ThinItalic.ttf', index=0, name='Lato', style='italic', variant='normal', weight=275, stretch='normal', size='scalable')) = 11.16875
2026-07-21 14:55:57 runnervm3jd5f matplotlib.font_manager[2874] DEBUG findfont: score(FontEntry(fname='/usr/share/fonts/truetype/lato/Lato-ThinItalic.ttf', index=0, name='Lato Thin', style='italic', variant='normal', weight=400, stretch='normal', size='scalable')) = 11.05
2026-07-21 14:55:57 runnervm3jd5f matplotlib.font_manager[2874] DEBUG findfont: score(FontEntry(fname='/usr/share/fonts/truetype/lato/Lato-BlackItalic.ttf', index=0, name='Lato', style='italic', variant='normal', weight=900, stretch='normal', size='scalable')) = 11.525
2026-07-21 14:55:57 runnervm3jd5f matplotlib.font_manager[2874] DEBUG findfont: score(FontEntry(fname='/usr/share/fonts/truetype/lato/Lato-BlackItalic.ttf', index=0, name='Lato Black', style='italic', variant='normal', weight=400, stretch='normal', size='scalable')) = 11.05
2026-07-21 14:55:57 runnervm3jd5f matplotlib.font_manager[2874] DEBUG findfont: score(FontEntry(fname='/usr/share/fonts/truetype/dejavu/DejaVuSerifCondensed-Italic.ttf', index=0, name='DejaVu Serif', style='italic', variant='normal', weight=400, stretch='condensed', size='scalable')) = 11.25
2026-07-21 14:55:57 runnervm3jd5f matplotlib.font_manager[2874] DEBUG findfont: score(FontEntry(fname='/usr/share/fonts/truetype/dejavu/DejaVuSerifCondensed-Italic.ttf', index=0, name='DejaVu Serif Condensed', style='italic', variant='normal', weight=400, stretch='condensed', size='scalable')) = 11.25
2026-07-21 14:55:57 runnervm3jd5f matplotlib.font_manager[2874] DEBUG findfont: score(FontEntry(fname='/usr/share/fonts/truetype/dejavu/DejaVuSans-Bold.ttf', index=0, name='DejaVu Sans', style='normal', variant='normal', weight=700, stretch='normal', size='scalable')) = 10.335
2026-07-21 14:55:57 runnervm3jd5f matplotlib.font_manager[2874] DEBUG findfont: score(FontEntry(fname='/home/runner/micromamba/envs/trajan/fonts/UbuntuMono-R.ttf', index=0, name='Ubuntu Mono', style='normal', variant='normal', weight=400, stretch='normal', size='scalable')) = 10.05
2026-07-21 14:55:57 runnervm3jd5f matplotlib.font_manager[2874] DEBUG findfont: score(FontEntry(fname='/usr/share/fonts/truetype/dejavu/DejaVuSerif-BoldItalic.ttf', index=0, name='DejaVu Serif', style='italic', variant='normal', weight=700, stretch='normal', size='scalable')) = 11.335
2026-07-21 14:55:57 runnervm3jd5f matplotlib.font_manager[2874] DEBUG findfont: score(FontEntry(fname='/usr/share/fonts/truetype/lato/Lato-Hairline.ttf', index=0, name='Lato', style='normal', variant='normal', weight=250, stretch='normal', size='scalable')) = 10.1925
2026-07-21 14:55:57 runnervm3jd5f matplotlib.font_manager[2874] DEBUG findfont: score(FontEntry(fname='/usr/share/fonts/truetype/lato/Lato-Hairline.ttf', index=0, name='Lato Hairline', style='normal', variant='normal', weight=400, stretch='normal', size='scalable')) = 10.05
2026-07-21 14:55:57 runnervm3jd5f matplotlib.font_manager[2874] DEBUG findfont: score(FontEntry(fname='/usr/share/fonts/truetype/lato/Lato-LightItalic.ttf', index=0, name='Lato', style='italic', variant='normal', weight=300, stretch='normal', size='scalable')) = 11.145
2026-07-21 14:55:57 runnervm3jd5f matplotlib.font_manager[2874] DEBUG findfont: score(FontEntry(fname='/usr/share/fonts/truetype/lato/Lato-LightItalic.ttf', index=0, name='Lato Light', style='italic', variant='normal', weight=400, stretch='normal', size='scalable')) = 11.05
2026-07-21 14:55:57 runnervm3jd5f matplotlib.font_manager[2874] DEBUG findfont: score(FontEntry(fname='/usr/share/fonts/truetype/dejavu/DejaVuSansCondensed-BoldOblique.ttf', index=0, name='DejaVu Sans', style='oblique', variant='normal', weight=700, stretch='condensed', size='scalable')) = 11.535
2026-07-21 14:55:57 runnervm3jd5f matplotlib.font_manager[2874] DEBUG findfont: score(FontEntry(fname='/usr/share/fonts/truetype/dejavu/DejaVuSansCondensed-BoldOblique.ttf', index=0, name='DejaVu Sans Condensed', style='oblique', variant='normal', weight=700, stretch='condensed', size='scalable')) = 11.535
2026-07-21 14:55:57 runnervm3jd5f matplotlib.font_manager[2874] DEBUG findfont: score(FontEntry(fname='/home/runner/micromamba/envs/trajan/fonts/SourceCodePro-It.ttf', index=0, name='Source Code Pro', style='italic', variant='normal', weight=400, stretch='normal', size='scalable')) = 11.05
2026-07-21 14:55:57 runnervm3jd5f matplotlib.font_manager[2874] DEBUG findfont: score(FontEntry(fname='/home/runner/micromamba/envs/trajan/fonts/SourceCodePro-ExtraLightIt.ttf', index=0, name='Source Code Pro', style='italic', variant='normal', weight=200, stretch='normal', size='scalable')) = 11.24
2026-07-21 14:55:57 runnervm3jd5f matplotlib.font_manager[2874] DEBUG findfont: score(FontEntry(fname='/home/runner/micromamba/envs/trajan/fonts/SourceCodePro-ExtraLightIt.ttf', index=0, name='Source Code Pro ExtraLight', style='italic', variant='normal', weight=400, stretch='normal', size='scalable')) = 11.05
2026-07-21 14:55:57 runnervm3jd5f matplotlib.font_manager[2874] DEBUG findfont: score(FontEntry(fname='/usr/share/fonts/truetype/lato/Lato-Medium.ttf', index=0, name='Lato', style='normal', variant='normal', weight=500, stretch='normal', size='scalable')) = 10.145
2026-07-21 14:55:57 runnervm3jd5f matplotlib.font_manager[2874] DEBUG findfont: score(FontEntry(fname='/usr/share/fonts/truetype/lato/Lato-Medium.ttf', index=0, name='Lato Medium', style='normal', variant='normal', weight=400, stretch='normal', size='scalable')) = 10.05
2026-07-21 14:55:57 runnervm3jd5f matplotlib.font_manager[2874] DEBUG findfont: score(FontEntry(fname='/usr/share/fonts/truetype/lato/Lato-BoldItalic.ttf', index=0, name='Lato', style='italic', variant='normal', weight=700, stretch='normal', size='scalable')) = 11.335
2026-07-21 14:55:57 runnervm3jd5f matplotlib.font_manager[2874] DEBUG findfont: score(FontEntry(fname='/home/runner/micromamba/envs/trajan/fonts/DejaVuSans.ttf', index=0, name='DejaVu Sans', style='normal', variant='normal', weight=400, stretch='normal', size='scalable')) = 10.05
2026-07-21 14:55:57 runnervm3jd5f matplotlib.font_manager[2874] DEBUG findfont: score(FontEntry(fname='/home/runner/micromamba/envs/trajan/fonts/UbuntuMono-B.ttf', index=0, name='Ubuntu Mono', style='normal', variant='normal', weight=700, stretch='normal', size='scalable')) = 10.335
2026-07-21 14:55:57 runnervm3jd5f matplotlib.font_manager[2874] DEBUG findfont: score(FontEntry(fname='/home/runner/micromamba/envs/trajan/fonts/SourceCodePro-LightIt.ttf', index=0, name='Source Code Pro', style='italic', variant='normal', weight=300, stretch='normal', size='scalable')) = 11.145
2026-07-21 14:55:57 runnervm3jd5f matplotlib.font_manager[2874] DEBUG findfont: score(FontEntry(fname='/home/runner/micromamba/envs/trajan/fonts/SourceCodePro-LightIt.ttf', index=0, name='Source Code Pro Light', style='italic', variant='normal', weight=400, stretch='normal', size='scalable')) = 11.05
2026-07-21 14:55:57 runnervm3jd5f matplotlib.font_manager[2874] DEBUG findfont: score(FontEntry(fname='/usr/share/fonts/truetype/liberation/LiberationSans-BoldItalic.ttf', index=0, name='Liberation Sans', style='italic', variant='normal', weight=700, stretch='normal', size='scalable')) = 11.335
2026-07-21 14:55:57 runnervm3jd5f matplotlib.font_manager[2874] DEBUG findfont: score(FontEntry(fname='/usr/share/fonts/truetype/liberation/LiberationSans-Regular.ttf', index=0, name='Liberation Sans', style='normal', variant='normal', weight=400, stretch='normal', size='scalable')) = 10.05
2026-07-21 14:55:57 runnervm3jd5f matplotlib.font_manager[2874] DEBUG findfont: score(FontEntry(fname='/usr/share/fonts/truetype/dejavu/DejaVuSansMono-Bold.ttf', index=0, name='DejaVu Sans Mono', style='normal', variant='normal', weight=700, stretch='normal', size='scalable')) = 10.335
2026-07-21 14:55:57 runnervm3jd5f matplotlib.font_manager[2874] DEBUG findfont: score(FontEntry(fname='/home/runner/micromamba/envs/trajan/fonts/SourceCodePro-BoldIt.ttf', index=0, name='Source Code Pro', style='italic', variant='normal', weight=700, stretch='normal', size='scalable')) = 11.335
2026-07-21 14:55:57 runnervm3jd5f matplotlib.font_manager[2874] DEBUG findfont: score(FontEntry(fname='/usr/share/fonts/truetype/lato/Lato-Bold.ttf', index=0, name='Lato', style='normal', variant='normal', weight=700, stretch='normal', size='scalable')) = 10.335
2026-07-21 14:55:57 runnervm3jd5f matplotlib.font_manager[2874] DEBUG findfont: score(FontEntry(fname='/usr/share/fonts/truetype/dejavu/DejaVuSansCondensed.ttf', index=0, name='DejaVu Sans', style='normal', variant='normal', weight=400, stretch='condensed', size='scalable')) = 10.25
2026-07-21 14:55:57 runnervm3jd5f matplotlib.font_manager[2874] DEBUG findfont: score(FontEntry(fname='/usr/share/fonts/truetype/dejavu/DejaVuSansCondensed.ttf', index=0, name='DejaVu Sans Condensed', style='normal', variant='normal', weight=380, stretch='condensed', size='scalable')) = 10.269
2026-07-21 14:55:57 runnervm3jd5f matplotlib.font_manager[2874] DEBUG findfont: score(FontEntry(fname='/usr/share/fonts/truetype/lato/Lato-MediumItalic.ttf', index=0, name='Lato', style='italic', variant='normal', weight=500, stretch='normal', size='scalable')) = 11.145
2026-07-21 14:55:57 runnervm3jd5f matplotlib.font_manager[2874] DEBUG findfont: score(FontEntry(fname='/usr/share/fonts/truetype/lato/Lato-MediumItalic.ttf', index=0, name='Lato Medium', style='italic', variant='normal', weight=400, stretch='normal', size='scalable')) = 11.05
2026-07-21 14:55:57 runnervm3jd5f matplotlib.font_manager[2874] DEBUG findfont: score(FontEntry(fname='/usr/share/fonts/truetype/liberation/LiberationSans-Bold.ttf', index=0, name='Liberation Sans', style='normal', variant='normal', weight=700, stretch='normal', size='scalable')) = 10.335
2026-07-21 14:55:57 runnervm3jd5f matplotlib.font_manager[2874] DEBUG findfont: score(FontEntry(fname='/usr/share/fonts/truetype/dejavu/DejaVuSerifCondensed-BoldItalic.ttf', index=0, name='DejaVu Serif', style='italic', variant='normal', weight=700, stretch='condensed', size='scalable')) = 11.535
2026-07-21 14:55:57 runnervm3jd5f matplotlib.font_manager[2874] DEBUG findfont: score(FontEntry(fname='/usr/share/fonts/truetype/dejavu/DejaVuSerifCondensed-BoldItalic.ttf', index=0, name='DejaVu Serif Condensed', style='italic', variant='normal', weight=700, stretch='condensed', size='scalable')) = 11.535
2026-07-21 14:55:57 runnervm3jd5f matplotlib.font_manager[2874] DEBUG findfont: score(FontEntry(fname='/home/runner/micromamba/envs/trajan/fonts/Ubuntu-R.ttf', index=0, name='Ubuntu', style='normal', variant='normal', weight=400, stretch='normal', size='scalable')) = 10.05
2026-07-21 14:55:57 runnervm3jd5f matplotlib.font_manager[2874] DEBUG findfont: score(FontEntry(fname='/usr/share/fonts/truetype/lato/Lato-Light.ttf', index=0, name='Lato', style='normal', variant='normal', weight=300, stretch='normal', size='scalable')) = 10.145
2026-07-21 14:55:57 runnervm3jd5f matplotlib.font_manager[2874] DEBUG findfont: score(FontEntry(fname='/usr/share/fonts/truetype/lato/Lato-Light.ttf', index=0, name='Lato Light', style='normal', variant='normal', weight=400, stretch='normal', size='scalable')) = 10.05
2026-07-21 14:55:57 runnervm3jd5f matplotlib.font_manager[2874] DEBUG findfont: score(FontEntry(fname='/usr/share/fonts/truetype/liberation/LiberationSerif-BoldItalic.ttf', index=0, name='Liberation Serif', style='italic', variant='normal', weight=700, stretch='normal', size='scalable')) = 11.335
2026-07-21 14:55:57 runnervm3jd5f matplotlib.font_manager[2874] DEBUG findfont: score(FontEntry(fname='/home/runner/micromamba/envs/trajan/fonts/Ubuntu-Th.ttf', index=0, name='Ubuntu', style='normal', variant='normal', weight=250, stretch='normal', size='scalable')) = 10.1925
2026-07-21 14:55:57 runnervm3jd5f matplotlib.font_manager[2874] DEBUG findfont: score(FontEntry(fname='/home/runner/micromamba/envs/trajan/fonts/Ubuntu-Th.ttf', index=0, name='Ubuntu Thin', style='normal', variant='normal', weight=400, stretch='normal', size='scalable')) = 10.05
2026-07-21 14:55:57 runnervm3jd5f matplotlib.font_manager[2874] DEBUG findfont: score(FontEntry(fname='/home/runner/micromamba/envs/trajan/fonts/SourceCodePro-ExtraLight.ttf', index=0, name='Source Code Pro', style='normal', variant='normal', weight=200, stretch='normal', size='scalable')) = 10.24
2026-07-21 14:55:57 runnervm3jd5f matplotlib.font_manager[2874] DEBUG findfont: score(FontEntry(fname='/home/runner/micromamba/envs/trajan/fonts/SourceCodePro-ExtraLight.ttf', index=0, name='Source Code Pro ExtraLight', style='normal', variant='normal', weight=400, stretch='normal', size='scalable')) = 10.05
2026-07-21 14:55:57 runnervm3jd5f matplotlib.font_manager[2874] DEBUG findfont: score(FontEntry(fname='/usr/share/fonts/truetype/lato/Lato-Thin.ttf', index=0, name='Lato', style='normal', variant='normal', weight=275, stretch='normal', size='scalable')) = 10.16875
2026-07-21 14:55:57 runnervm3jd5f matplotlib.font_manager[2874] DEBUG findfont: score(FontEntry(fname='/usr/share/fonts/truetype/lato/Lato-Thin.ttf', index=0, name='Lato Thin', style='normal', variant='normal', weight=400, stretch='normal', size='scalable')) = 10.05
2026-07-21 14:55:57 runnervm3jd5f matplotlib.font_manager[2874] DEBUG findfont: score(FontEntry(fname='/usr/share/fonts/truetype/liberation/LiberationSerif-Bold.ttf', index=0, name='Liberation Serif', style='normal', variant='normal', weight=700, stretch='normal', size='scalable')) = 10.335
2026-07-21 14:55:57 runnervm3jd5f matplotlib.font_manager[2874] DEBUG findfont: score(FontEntry(fname='/home/runner/micromamba/envs/trajan/fonts/Inconsolata-Regular.ttf', index=0, name='Inconsolata', style='normal', variant='normal', weight=400, stretch='normal', size='scalable')) = 10.05
2026-07-21 14:55:57 runnervm3jd5f matplotlib.font_manager[2874] DEBUG findfont: score(FontEntry(fname='/home/runner/micromamba/envs/trajan/fonts/Ubuntu-C.ttf', index=0, name='Ubuntu Condensed', style='normal', variant='normal', weight=400, stretch='condensed', size='scalable')) = 10.25
2026-07-21 14:55:57 runnervm3jd5f matplotlib.font_manager[2874] DEBUG findfont: score(FontEntry(fname='/usr/share/fonts/truetype/dejavu/DejaVuSansCondensed-Bold.ttf', index=0, name='DejaVu Sans', style='normal', variant='normal', weight=700, stretch='condensed', size='scalable')) = 10.535
2026-07-21 14:55:57 runnervm3jd5f matplotlib.font_manager[2874] DEBUG findfont: score(FontEntry(fname='/usr/share/fonts/truetype/dejavu/DejaVuSansCondensed-Bold.ttf', index=0, name='DejaVu Sans Condensed', style='normal', variant='normal', weight=700, stretch='condensed', size='scalable')) = 10.535
2026-07-21 14:55:57 runnervm3jd5f matplotlib.font_manager[2874] DEBUG findfont: score(FontEntry(fname='/usr/share/fonts/truetype/liberation/LiberationMono-Bold.ttf', index=0, name='Liberation Mono', style='normal', variant='normal', weight=700, stretch='normal', size='scalable')) = 10.335
2026-07-21 14:55:57 runnervm3jd5f matplotlib.font_manager[2874] DEBUG findfont: score(FontEntry(fname='/home/runner/micromamba/envs/trajan/fonts/SourceCodePro-Black.ttf', index=0, name='Source Code Pro', style='normal', variant='normal', weight=900, stretch='normal', size='scalable')) = 10.525
2026-07-21 14:55:57 runnervm3jd5f matplotlib.font_manager[2874] DEBUG findfont: score(FontEntry(fname='/home/runner/micromamba/envs/trajan/fonts/SourceCodePro-Black.ttf', index=0, name='Source Code Pro Black', style='normal', variant='normal', weight=400, stretch='normal', size='scalable')) = 10.05
2026-07-21 14:55:57 runnervm3jd5f matplotlib.font_manager[2874] DEBUG findfont: score(FontEntry(fname='/home/runner/micromamba/envs/trajan/fonts/SourceCodePro-BlackIt.ttf', index=0, name='Source Code Pro', style='italic', variant='normal', weight=900, stretch='normal', size='scalable')) = 11.525
2026-07-21 14:55:57 runnervm3jd5f matplotlib.font_manager[2874] DEBUG findfont: score(FontEntry(fname='/home/runner/micromamba/envs/trajan/fonts/SourceCodePro-BlackIt.ttf', index=0, name='Source Code Pro Black', style='italic', variant='normal', weight=400, stretch='normal', size='scalable')) = 11.05
2026-07-21 14:55:57 runnervm3jd5f matplotlib.font_manager[2874] DEBUG findfont: score(FontEntry(fname='/home/runner/micromamba/envs/trajan/fonts/Ubuntu-LI.ttf', index=0, name='Ubuntu', style='italic', variant='normal', weight=300, stretch='normal', size='scalable')) = 11.145
2026-07-21 14:55:57 runnervm3jd5f matplotlib.font_manager[2874] DEBUG findfont: score(FontEntry(fname='/home/runner/micromamba/envs/trajan/fonts/Ubuntu-LI.ttf', index=0, name='Ubuntu Light', style='italic', variant='normal', weight=400, stretch='normal', size='scalable')) = 11.05
2026-07-21 14:55:57 runnervm3jd5f matplotlib.font_manager[2874] DEBUG findfont: score(FontEntry(fname='/usr/share/fonts/truetype/liberation/LiberationMono-Regular.ttf', index=0, name='Liberation Mono', style='normal', variant='normal', weight=400, stretch='normal', size='scalable')) = 10.05
2026-07-21 14:55:57 runnervm3jd5f matplotlib.font_manager[2874] DEBUG findfont: score(FontEntry(fname='/home/runner/micromamba/envs/trajan/fonts/UbuntuMono-RI.ttf', index=0, name='Ubuntu Mono', style='italic', variant='normal', weight=400, stretch='normal', size='scalable')) = 11.05
2026-07-21 14:55:57 runnervm3jd5f matplotlib.font_manager[2874] DEBUG findfont: score(FontEntry(fname='/usr/share/fonts/truetype/lato/Lato-Heavy.ttf', index=0, name='Lato', style='normal', variant='normal', weight=800, stretch='normal', size='scalable')) = 10.43
2026-07-21 14:55:57 runnervm3jd5f matplotlib.font_manager[2874] DEBUG findfont: score(FontEntry(fname='/usr/share/fonts/truetype/lato/Lato-Heavy.ttf', index=0, name='Lato Heavy', style='normal', variant='normal', weight=400, stretch='normal', size='scalable')) = 10.05
2026-07-21 14:55:57 runnervm3jd5f matplotlib.font_manager[2874] DEBUG findfont: score(FontEntry(fname='/usr/share/fonts/truetype/lato/Lato-HairlineItalic.ttf', index=0, name='Lato', style='italic', variant='normal', weight=250, stretch='normal', size='scalable')) = 11.1925
2026-07-21 14:55:57 runnervm3jd5f matplotlib.font_manager[2874] DEBUG findfont: score(FontEntry(fname='/usr/share/fonts/truetype/lato/Lato-HairlineItalic.ttf', index=0, name='Lato Hairline', style='italic', variant='normal', weight=400, stretch='normal', size='scalable')) = 11.05
2026-07-21 14:55:57 runnervm3jd5f matplotlib.font_manager[2874] DEBUG findfont: score(FontEntry(fname='/usr/share/fonts/truetype/dejavu/DejaVuSerifCondensed-Bold.ttf', index=0, name='DejaVu Serif', style='normal', variant='normal', weight=700, stretch='condensed', size='scalable')) = 10.535
2026-07-21 14:55:57 runnervm3jd5f matplotlib.font_manager[2874] DEBUG findfont: score(FontEntry(fname='/usr/share/fonts/truetype/dejavu/DejaVuSerifCondensed-Bold.ttf', index=0, name='DejaVu Serif Condensed', style='normal', variant='normal', weight=700, stretch='condensed', size='scalable')) = 10.535
2026-07-21 14:55:57 runnervm3jd5f matplotlib.font_manager[2874] DEBUG findfont: score(FontEntry(fname='/usr/share/fonts/truetype/dejavu/DejaVuSansCondensed-Oblique.ttf', index=0, name='DejaVu Sans', style='oblique', variant='normal', weight=400, stretch='condensed', size='scalable')) = 11.25
2026-07-21 14:55:57 runnervm3jd5f matplotlib.font_manager[2874] DEBUG findfont: score(FontEntry(fname='/usr/share/fonts/truetype/dejavu/DejaVuSansCondensed-Oblique.ttf', index=0, name='DejaVu Sans Condensed', style='oblique', variant='normal', weight=400, stretch='condensed', size='scalable')) = 11.25
2026-07-21 14:55:57 runnervm3jd5f matplotlib.font_manager[2874] DEBUG findfont: score(FontEntry(fname='/usr/share/fonts/truetype/lato/Lato-SemiboldItalic.ttf', index=0, name='Lato', style='italic', variant='normal', weight=600, stretch='normal', size='scalable')) = 11.24
2026-07-21 14:55:57 runnervm3jd5f matplotlib.font_manager[2874] DEBUG findfont: score(FontEntry(fname='/usr/share/fonts/truetype/lato/Lato-SemiboldItalic.ttf', index=0, name='Lato Semibold', style='italic', variant='normal', weight=400, stretch='normal', size='scalable')) = 11.05
2026-07-21 14:55:57 runnervm3jd5f matplotlib.font_manager[2874] DEBUG findfont: score(FontEntry(fname='/usr/share/fonts/truetype/lato/Lato-Semibold.ttf', index=0, name='Lato', style='normal', variant='normal', weight=600, stretch='normal', size='scalable')) = 10.24
2026-07-21 14:55:57 runnervm3jd5f matplotlib.font_manager[2874] DEBUG findfont: score(FontEntry(fname='/usr/share/fonts/truetype/lato/Lato-Semibold.ttf', index=0, name='Lato Semibold', style='normal', variant='normal', weight=400, stretch='normal', size='scalable')) = 10.05
2026-07-21 14:55:57 runnervm3jd5f matplotlib.font_manager[2874] DEBUG findfont: score(FontEntry(fname='/home/runner/micromamba/envs/trajan/fonts/Inconsolata-Bold.ttf', index=0, name='Inconsolata', style='normal', variant='normal', weight=700, stretch='normal', size='scalable')) = 10.335
2026-07-21 14:55:57 runnervm3jd5f matplotlib.font_manager[2874] DEBUG findfont: score(FontEntry(fname='/usr/share/fonts/truetype/dejavu/DejaVuSans-ExtraLight.ttf', index=0, name='DejaVu Sans', style='normal', variant='normal', weight=200, stretch='normal', size='scalable')) = 10.24
2026-07-21 14:55:57 runnervm3jd5f matplotlib.font_manager[2874] DEBUG findfont: score(FontEntry(fname='/usr/share/fonts/truetype/dejavu/DejaVuSans-ExtraLight.ttf', index=0, name='DejaVu Sans Light', style='normal', variant='normal', weight=200, stretch='normal', size='scalable')) = 10.24
2026-07-21 14:55:57 runnervm3jd5f matplotlib.font_manager[2874] DEBUG findfont: score(FontEntry(fname='/home/runner/micromamba/envs/trajan/fonts/Ubuntu-BI.ttf', index=0, name='Ubuntu', style='italic', variant='normal', weight=700, stretch='normal', size='scalable')) = 11.335
2026-07-21 14:55:57 runnervm3jd5f matplotlib.font_manager[2874] DEBUG findfont: score(FontEntry(fname='/usr/share/fonts/truetype/dejavu/DejaVuSans-BoldOblique.ttf', index=0, name='DejaVu Sans', style='oblique', variant='normal', weight=700, stretch='normal', size='scalable')) = 11.335
2026-07-21 14:55:57 runnervm3jd5f matplotlib.font_manager[2874] DEBUG findfont: score(FontEntry(fname='/home/runner/micromamba/envs/trajan/fonts/Ubuntu-RI.ttf', index=0, name='Ubuntu', style='italic', variant='normal', weight=400, stretch='normal', size='scalable')) = 11.05
2026-07-21 14:55:57 runnervm3jd5f matplotlib.font_manager[2874] DEBUG findfont: score(FontEntry(fname='/usr/share/fonts/truetype/dejavu/DejaVuSerif-Italic.ttf', index=0, name='DejaVu Serif', style='italic', variant='normal', weight=400, stretch='normal', size='scalable')) = 11.05
2026-07-21 14:55:57 runnervm3jd5f matplotlib.font_manager[2874] DEBUG findfont: score(FontEntry(fname='/home/runner/micromamba/envs/trajan/fonts/SourceCodePro-Medium.ttf', index=0, name='Source Code Pro', style='normal', variant='normal', weight=500, stretch='normal', size='scalable')) = 10.145
2026-07-21 14:55:57 runnervm3jd5f matplotlib.font_manager[2874] DEBUG findfont: score(FontEntry(fname='/home/runner/micromamba/envs/trajan/fonts/SourceCodePro-Medium.ttf', index=0, name='Source Code Pro Medium', style='normal', variant='normal', weight=400, stretch='normal', size='scalable')) = 10.05
2026-07-21 14:55:57 runnervm3jd5f matplotlib.font_manager[2874] DEBUG findfont: score(FontEntry(fname='/usr/share/fonts/truetype/lato/Lato-HeavyItalic.ttf', index=0, name='Lato', style='italic', variant='normal', weight=800, stretch='normal', size='scalable')) = 11.43
2026-07-21 14:55:57 runnervm3jd5f matplotlib.font_manager[2874] DEBUG findfont: score(FontEntry(fname='/usr/share/fonts/truetype/lato/Lato-HeavyItalic.ttf', index=0, name='Lato Heavy', style='italic', variant='normal', weight=400, stretch='normal', size='scalable')) = 11.05
2026-07-21 14:55:57 runnervm3jd5f matplotlib.font_manager[2874] DEBUG findfont: score(FontEntry(fname='/usr/share/fonts/truetype/dejavu/DejaVuSans-Oblique.ttf', index=0, name='DejaVu Sans', style='oblique', variant='normal', weight=400, stretch='normal', size='scalable')) = 11.05
2026-07-21 14:55:57 runnervm3jd5f matplotlib.font_manager[2874] DEBUG findfont: score(FontEntry(fname='/home/runner/micromamba/envs/trajan/fonts/Ubuntu-M.ttf', index=0, name='Ubuntu', style='normal', variant='normal', weight=500, stretch='normal', size='scalable')) = 10.145
2026-07-21 14:55:57 runnervm3jd5f matplotlib.font_manager[2874] DEBUG findfont: score(FontEntry(fname='/home/runner/micromamba/envs/trajan/fonts/Ubuntu-M.ttf', index=0, name='Ubuntu Light', style='normal', variant='normal', weight=700, stretch='normal', size='scalable')) = 10.335
2026-07-21 14:55:57 runnervm3jd5f matplotlib.font_manager[2874] DEBUG findfont: score(FontEntry(fname='/usr/share/fonts/truetype/liberation/LiberationMono-BoldItalic.ttf', index=0, name='Liberation Mono', style='italic', variant='normal', weight=700, stretch='normal', size='scalable')) = 11.335
2026-07-21 14:55:57 runnervm3jd5f matplotlib.font_manager[2874] DEBUG findfont: score(FontEntry(fname='/usr/share/fonts/truetype/dejavu/DejaVuSansMono.ttf', index=0, name='DejaVu Sans Mono', style='normal', variant='normal', weight=400, stretch='normal', size='scalable')) = 10.05
2026-07-21 14:55:57 runnervm3jd5f matplotlib.font_manager[2874] DEBUG findfont: score(FontEntry(fname='/usr/share/fonts/truetype/dejavu/DejaVuMathTeXGyre.ttf', index=0, name='DejaVu Math TeX Gyre', style='normal', variant='normal', weight=400, stretch='normal', size='scalable')) = 10.05
2026-07-21 14:55:57 runnervm3jd5f matplotlib.font_manager[2874] DEBUG findfont: score(FontEntry(fname='/usr/share/fonts/truetype/dejavu/DejaVuSansMono-Oblique.ttf', index=0, name='DejaVu Sans Mono', style='oblique', variant='normal', weight=400, stretch='normal', size='scalable')) = 11.05
2026-07-21 14:55:57 runnervm3jd5f matplotlib.font_manager[2874] DEBUG findfont: score(FontEntry(fname='/home/runner/micromamba/envs/trajan/fonts/Ubuntu-L.ttf', index=0, name='Ubuntu', style='normal', variant='normal', weight=300, stretch='normal', size='scalable')) = 10.145
2026-07-21 14:55:57 runnervm3jd5f matplotlib.font_manager[2874] DEBUG findfont: score(FontEntry(fname='/home/runner/micromamba/envs/trajan/fonts/Ubuntu-L.ttf', index=0, name='Ubuntu Light', style='normal', variant='normal', weight=400, stretch='normal', size='scalable')) = 10.05
2026-07-21 14:55:57 runnervm3jd5f matplotlib.font_manager[2874] DEBUG findfont: score(FontEntry(fname='/home/runner/micromamba/envs/trajan/fonts/SourceCodePro-MediumIt.ttf', index=0, name='Source Code Pro', style='italic', variant='normal', weight=500, stretch='normal', size='scalable')) = 11.145
2026-07-21 14:55:57 runnervm3jd5f matplotlib.font_manager[2874] DEBUG findfont: score(FontEntry(fname='/home/runner/micromamba/envs/trajan/fonts/SourceCodePro-MediumIt.ttf', index=0, name='Source Code Pro Medium', style='italic', variant='normal', weight=400, stretch='normal', size='scalable')) = 11.05
2026-07-21 14:55:57 runnervm3jd5f matplotlib.font_manager[2874] DEBUG findfont: score(FontEntry(fname='/home/runner/micromamba/envs/trajan/fonts/SourceCodePro-Regular.ttf', index=0, name='Source Code Pro', style='normal', variant='normal', weight=400, stretch='normal', size='scalable')) = 10.05
2026-07-21 14:55:57 runnervm3jd5f matplotlib.font_manager[2874] DEBUG findfont: score(FontEntry(fname='/home/runner/micromamba/envs/trajan/fonts/SourceCodePro-SemiboldIt.ttf', index=0, name='Source Code Pro', style='italic', variant='normal', weight=600, stretch='normal', size='scalable')) = 11.24
2026-07-21 14:55:57 runnervm3jd5f matplotlib.font_manager[2874] DEBUG findfont: score(FontEntry(fname='/home/runner/micromamba/envs/trajan/fonts/SourceCodePro-SemiboldIt.ttf', index=0, name='Source Code Pro Semibold', style='italic', variant='normal', weight=400, stretch='normal', size='scalable')) = 11.05
2026-07-21 14:55:57 runnervm3jd5f matplotlib.font_manager[2874] DEBUG findfont: score(FontEntry(fname='/usr/share/fonts/truetype/dejavu/DejaVuSerif.ttf', index=0, name='DejaVu Serif', style='normal', variant='normal', weight=400, stretch='normal', size='scalable')) = 10.05
2026-07-21 14:55:57 runnervm3jd5f matplotlib.font_manager[2874] DEBUG findfont: score(FontEntry(fname='/usr/share/fonts/truetype/dejavu/DejaVuSerif-Bold.ttf', index=0, name='DejaVu Serif', style='normal', variant='normal', weight=700, stretch='normal', size='scalable')) = 10.335
2026-07-21 14:55:57 runnervm3jd5f matplotlib.font_manager[2874] DEBUG findfont: score(FontEntry(fname='/usr/share/fonts/truetype/liberation/LiberationSerif-Italic.ttf', index=0, name='Liberation Serif', style='italic', variant='normal', weight=400, stretch='normal', size='scalable')) = 11.05
2026-07-21 14:55:57 runnervm3jd5f matplotlib.font_manager[2874] DEBUG findfont: score(FontEntry(fname='/usr/share/fonts/truetype/dejavu/DejaVuSansMono-BoldOblique.ttf', index=0, name='DejaVu Sans Mono', style='oblique', variant='normal', weight=700, stretch='normal', size='scalable')) = 11.335
2026-07-21 14:55:57 runnervm3jd5f matplotlib.font_manager[2874] DEBUG findfont: score(FontEntry(fname='/home/runner/micromamba/envs/trajan/fonts/SourceCodePro-Light.ttf', index=0, name='Source Code Pro', style='normal', variant='normal', weight=300, stretch='normal', size='scalable')) = 10.145
2026-07-21 14:55:57 runnervm3jd5f matplotlib.font_manager[2874] DEBUG findfont: score(FontEntry(fname='/home/runner/micromamba/envs/trajan/fonts/SourceCodePro-Light.ttf', index=0, name='Source Code Pro Light', style='normal', variant='normal', weight=400, stretch='normal', size='scalable')) = 10.05
2026-07-21 14:55:57 runnervm3jd5f matplotlib.font_manager[2874] DEBUG findfont: score(FontEntry(fname='/usr/share/fonts/truetype/liberation/LiberationMono-Italic.ttf', index=0, name='Liberation Mono', style='italic', variant='normal', weight=400, stretch='normal', size='scalable')) = 11.05
2026-07-21 14:55:57 runnervm3jd5f matplotlib.font_manager[2874] DEBUG findfont: Matching cmti10:style=normal:variant=normal:weight=normal:stretch=normal:size=10.0 to cmti10 ('/home/runner/micromamba/envs/trajan/lib/python3.14/site-packages/matplotlib/mpl-data/fonts/ttf/cmti10.ttf') with score of 0.050000.
2026-07-21 14:55:57 runnervm3jd5f matplotlib.font_manager[2874] DEBUG findfont: Matching cmb10:style=normal:variant=normal:weight=normal:stretch=normal:size=10.0.
2026-07-21 14:55:57 runnervm3jd5f matplotlib.font_manager[2874] DEBUG findfont: score(FontEntry(fname='/home/runner/micromamba/envs/trajan/lib/python3.14/site-packages/matplotlib/mpl-data/fonts/ttf/cmmi10.ttf', index=0, name='cmmi10', style='normal', variant='normal', weight=400, stretch='normal', size='scalable')) = 10.05
2026-07-21 14:55:57 runnervm3jd5f matplotlib.font_manager[2874] DEBUG findfont: score(FontEntry(fname='/home/runner/micromamba/envs/trajan/lib/python3.14/site-packages/matplotlib/mpl-data/fonts/ttf/DejaVuSerif-Bold.ttf', index=0, name='DejaVu Serif', style='normal', variant='normal', weight=700, stretch='normal', size='scalable')) = 10.335
2026-07-21 14:55:57 runnervm3jd5f matplotlib.font_manager[2874] DEBUG findfont: score(FontEntry(fname='/home/runner/micromamba/envs/trajan/lib/python3.14/site-packages/matplotlib/mpl-data/fonts/ttf/DejaVuSans-Oblique.ttf', index=0, name='DejaVu Sans', style='oblique', variant='normal', weight=400, stretch='normal', size='scalable')) = 11.05
2026-07-21 14:55:57 runnervm3jd5f matplotlib.font_manager[2874] DEBUG findfont: score(FontEntry(fname='/home/runner/micromamba/envs/trajan/lib/python3.14/site-packages/matplotlib/mpl-data/fonts/ttf/STIXSizThreeSymReg.ttf', index=0, name='STIXSizeThreeSym', style='normal', variant='normal', weight=400, stretch='normal', size='scalable')) = 10.05
2026-07-21 14:55:57 runnervm3jd5f matplotlib.font_manager[2874] DEBUG findfont: score(FontEntry(fname='/home/runner/micromamba/envs/trajan/lib/python3.14/site-packages/matplotlib/mpl-data/fonts/ttf/STIXNonUniBolIta.ttf', index=0, name='STIXNonUnicode', style='italic', variant='normal', weight=700, stretch='normal', size='scalable')) = 11.335
2026-07-21 14:55:57 runnervm3jd5f matplotlib.font_manager[2874] DEBUG findfont: score(FontEntry(fname='/home/runner/micromamba/envs/trajan/lib/python3.14/site-packages/matplotlib/mpl-data/fonts/ttf/DejaVuSerifDisplay.ttf', index=0, name='DejaVu Serif Display', style='normal', variant='normal', weight=400, stretch='normal', size='scalable')) = 10.05
2026-07-21 14:55:57 runnervm3jd5f matplotlib.font_manager[2874] DEBUG findfont: score(FontEntry(fname='/home/runner/micromamba/envs/trajan/lib/python3.14/site-packages/matplotlib/mpl-data/fonts/ttf/cmss10.ttf', index=0, name='cmss10', style='normal', variant='normal', weight=400, stretch='normal', size='scalable')) = 10.05
2026-07-21 14:55:57 runnervm3jd5f matplotlib.font_manager[2874] DEBUG findfont: score(FontEntry(fname='/home/runner/micromamba/envs/trajan/lib/python3.14/site-packages/matplotlib/mpl-data/fonts/ttf/STIXGeneralBolIta.ttf', index=0, name='STIXGeneral', style='italic', variant='normal', weight=700, stretch='normal', size='scalable')) = 11.335
2026-07-21 14:55:57 runnervm3jd5f matplotlib.font_manager[2874] DEBUG findfont: score(FontEntry(fname='/home/runner/micromamba/envs/trajan/lib/python3.14/site-packages/matplotlib/mpl-data/fonts/ttf/cmtt10.ttf', index=0, name='cmtt10', style='normal', variant='normal', weight=400, stretch='normal', size='scalable')) = 10.05
2026-07-21 14:55:57 runnervm3jd5f matplotlib.font_manager[2874] DEBUG findfont: score(FontEntry(fname='/home/runner/micromamba/envs/trajan/lib/python3.14/site-packages/matplotlib/mpl-data/fonts/ttf/cmsy10.ttf', index=0, name='cmsy10', style='normal', variant='normal', weight=400, stretch='normal', size='scalable')) = 10.05
2026-07-21 14:55:57 runnervm3jd5f matplotlib.font_manager[2874] DEBUG findfont: score(FontEntry(fname='/home/runner/micromamba/envs/trajan/lib/python3.14/site-packages/matplotlib/mpl-data/fonts/ttf/DejaVuSansMono-Oblique.ttf', index=0, name='DejaVu Sans Mono', style='oblique', variant='normal', weight=400, stretch='normal', size='scalable')) = 11.05
2026-07-21 14:55:57 runnervm3jd5f matplotlib.font_manager[2874] DEBUG findfont: score(FontEntry(fname='/home/runner/micromamba/envs/trajan/lib/python3.14/site-packages/matplotlib/mpl-data/fonts/ttf/STIXNonUniIta.ttf', index=0, name='STIXNonUnicode', style='italic', variant='normal', weight=400, stretch='normal', size='scalable')) = 11.05
2026-07-21 14:55:57 runnervm3jd5f matplotlib.font_manager[2874] DEBUG findfont: score(FontEntry(fname='/home/runner/micromamba/envs/trajan/lib/python3.14/site-packages/matplotlib/mpl-data/fonts/ttf/STIXGeneral.ttf', index=0, name='STIXGeneral', style='normal', variant='normal', weight=400, stretch='normal', size='scalable')) = 10.05
2026-07-21 14:55:57 runnervm3jd5f matplotlib.font_manager[2874] DEBUG findfont: score(FontEntry(fname='/home/runner/micromamba/envs/trajan/lib/python3.14/site-packages/matplotlib/mpl-data/fonts/ttf/cmti10.ttf', index=0, name='cmti10', style='normal', variant='normal', weight=400, stretch='normal', size='scalable')) = 10.05
2026-07-21 14:55:57 runnervm3jd5f matplotlib.font_manager[2874] DEBUG findfont: score(FontEntry(fname='/home/runner/micromamba/envs/trajan/lib/python3.14/site-packages/matplotlib/mpl-data/fonts/ttf/DejaVuSansMono-BoldOblique.ttf', index=0, name='DejaVu Sans Mono', style='oblique', variant='normal', weight=700, stretch='normal', size='scalable')) = 11.335
2026-07-21 14:55:57 runnervm3jd5f matplotlib.font_manager[2874] DEBUG findfont: score(FontEntry(fname='/home/runner/micromamba/envs/trajan/lib/python3.14/site-packages/matplotlib/mpl-data/fonts/ttf/DejaVuSerif.ttf', index=0, name='DejaVu Serif', style='normal', variant='normal', weight=400, stretch='normal', size='scalable')) = 10.05
2026-07-21 14:55:57 runnervm3jd5f matplotlib.font_manager[2874] DEBUG findfont: score(FontEntry(fname='/home/runner/micromamba/envs/trajan/lib/python3.14/site-packages/matplotlib/mpl-data/fonts/ttf/LastResortHE-Regular.ttf', index=0, name='Last Resort High-Efficiency', style='normal', variant='normal', weight=400, stretch='normal', size='scalable')) = 10.05
2026-07-21 14:55:57 runnervm3jd5f matplotlib.font_manager[2874] DEBUG findfont: score(FontEntry(fname='/home/runner/micromamba/envs/trajan/lib/python3.14/site-packages/matplotlib/mpl-data/fonts/ttf/cmex10.ttf', index=0, name='cmex10', style='normal', variant='normal', weight=400, stretch='normal', size='scalable')) = 10.05
2026-07-21 14:55:57 runnervm3jd5f matplotlib.font_manager[2874] DEBUG findfont: score(FontEntry(fname='/home/runner/micromamba/envs/trajan/lib/python3.14/site-packages/matplotlib/mpl-data/fonts/ttf/STIXSizFiveSymReg.ttf', index=0, name='STIXSizeFiveSym', style='normal', variant='normal', weight=400, stretch='normal', size='scalable')) = 10.05
2026-07-21 14:55:57 runnervm3jd5f matplotlib.font_manager[2874] DEBUG findfont: score(FontEntry(fname='/home/runner/micromamba/envs/trajan/lib/python3.14/site-packages/matplotlib/mpl-data/fonts/ttf/STIXNonUniBol.ttf', index=0, name='STIXNonUnicode', style='normal', variant='normal', weight=700, stretch='normal', size='scalable')) = 10.335
2026-07-21 14:55:57 runnervm3jd5f matplotlib.font_manager[2874] DEBUG findfont: score(FontEntry(fname='/home/runner/micromamba/envs/trajan/lib/python3.14/site-packages/matplotlib/mpl-data/fonts/ttf/DejaVuSansDisplay.ttf', index=0, name='DejaVu Sans Display', style='normal', variant='normal', weight=400, stretch='normal', size='scalable')) = 10.05
2026-07-21 14:55:57 runnervm3jd5f matplotlib.font_manager[2874] DEBUG findfont: score(FontEntry(fname='/home/runner/micromamba/envs/trajan/lib/python3.14/site-packages/matplotlib/mpl-data/fonts/ttf/DejaVuSansMono.ttf', index=0, name='DejaVu Sans Mono', style='normal', variant='normal', weight=400, stretch='normal', size='scalable')) = 10.05
2026-07-21 14:55:57 runnervm3jd5f matplotlib.font_manager[2874] DEBUG findfont: score(FontEntry(fname='/home/runner/micromamba/envs/trajan/lib/python3.14/site-packages/matplotlib/mpl-data/fonts/ttf/cmb10.ttf', index=0, name='cmb10', style='normal', variant='normal', weight=400, stretch='normal', size='scalable')) = 0.05
2026-07-21 14:55:57 runnervm3jd5f matplotlib.font_manager[2874] DEBUG findfont: score(FontEntry(fname='/home/runner/micromamba/envs/trajan/lib/python3.14/site-packages/matplotlib/mpl-data/fonts/ttf/STIXSizTwoSymReg.ttf', index=0, name='STIXSizeTwoSym', style='normal', variant='normal', weight=400, stretch='normal', size='scalable')) = 10.05
2026-07-21 14:55:57 runnervm3jd5f matplotlib.font_manager[2874] DEBUG findfont: score(FontEntry(fname='/home/runner/micromamba/envs/trajan/lib/python3.14/site-packages/matplotlib/mpl-data/fonts/ttf/DejaVuSans.ttf', index=0, name='DejaVu Sans', style='normal', variant='normal', weight=400, stretch='normal', size='scalable')) = 10.05
2026-07-21 14:55:57 runnervm3jd5f matplotlib.font_manager[2874] DEBUG findfont: score(FontEntry(fname='/home/runner/micromamba/envs/trajan/lib/python3.14/site-packages/matplotlib/mpl-data/fonts/ttf/STIXNonUni.ttf', index=0, name='STIXNonUnicode', style='normal', variant='normal', weight=400, stretch='normal', size='scalable')) = 10.05
2026-07-21 14:55:57 runnervm3jd5f matplotlib.font_manager[2874] DEBUG findfont: score(FontEntry(fname='/home/runner/micromamba/envs/trajan/lib/python3.14/site-packages/matplotlib/mpl-data/fonts/ttf/STIXGeneralItalic.ttf', index=0, name='STIXGeneral', style='italic', variant='normal', weight=400, stretch='normal', size='scalable')) = 11.05
2026-07-21 14:55:57 runnervm3jd5f matplotlib.font_manager[2874] DEBUG findfont: score(FontEntry(fname='/home/runner/micromamba/envs/trajan/lib/python3.14/site-packages/matplotlib/mpl-data/fonts/ttf/STIXSizOneSymBol.ttf', index=0, name='STIXSizeOneSym', style='normal', variant='normal', weight=700, stretch='normal', size='scalable')) = 10.335
2026-07-21 14:55:57 runnervm3jd5f matplotlib.font_manager[2874] DEBUG findfont: score(FontEntry(fname='/home/runner/micromamba/envs/trajan/lib/python3.14/site-packages/matplotlib/mpl-data/fonts/ttf/DejaVuSansMono-Bold.ttf', index=0, name='DejaVu Sans Mono', style='normal', variant='normal', weight=700, stretch='normal', size='scalable')) = 10.335
2026-07-21 14:55:57 runnervm3jd5f matplotlib.font_manager[2874] DEBUG findfont: score(FontEntry(fname='/home/runner/micromamba/envs/trajan/lib/python3.14/site-packages/matplotlib/mpl-data/fonts/ttf/STIXSizTwoSymBol.ttf', index=0, name='STIXSizeTwoSym', style='normal', variant='normal', weight=700, stretch='normal', size='scalable')) = 10.335
2026-07-21 14:55:57 runnervm3jd5f matplotlib.font_manager[2874] DEBUG findfont: score(FontEntry(fname='/home/runner/micromamba/envs/trajan/lib/python3.14/site-packages/matplotlib/mpl-data/fonts/ttf/STIXSizThreeSymBol.ttf', index=0, name='STIXSizeThreeSym', style='normal', variant='normal', weight=700, stretch='normal', size='scalable')) = 10.335
2026-07-21 14:55:57 runnervm3jd5f matplotlib.font_manager[2874] DEBUG findfont: score(FontEntry(fname='/home/runner/micromamba/envs/trajan/lib/python3.14/site-packages/matplotlib/mpl-data/fonts/ttf/DejaVuSerif-BoldItalic.ttf', index=0, name='DejaVu Serif', style='italic', variant='normal', weight=700, stretch='normal', size='scalable')) = 11.335
2026-07-21 14:55:57 runnervm3jd5f matplotlib.font_manager[2874] DEBUG findfont: score(FontEntry(fname='/home/runner/micromamba/envs/trajan/lib/python3.14/site-packages/matplotlib/mpl-data/fonts/ttf/DejaVuSerif-Italic.ttf', index=0, name='DejaVu Serif', style='italic', variant='normal', weight=400, stretch='normal', size='scalable')) = 11.05
2026-07-21 14:55:57 runnervm3jd5f matplotlib.font_manager[2874] DEBUG findfont: score(FontEntry(fname='/home/runner/micromamba/envs/trajan/lib/python3.14/site-packages/matplotlib/mpl-data/fonts/ttf/DejaVuSans-Bold.ttf', index=0, name='DejaVu Sans', style='normal', variant='normal', weight=700, stretch='normal', size='scalable')) = 10.335
2026-07-21 14:55:57 runnervm3jd5f matplotlib.font_manager[2874] DEBUG findfont: score(FontEntry(fname='/home/runner/micromamba/envs/trajan/lib/python3.14/site-packages/matplotlib/mpl-data/fonts/ttf/STIXSizFourSymBol.ttf', index=0, name='STIXSizeFourSym', style='normal', variant='normal', weight=700, stretch='normal', size='scalable')) = 10.335
2026-07-21 14:55:57 runnervm3jd5f matplotlib.font_manager[2874] DEBUG findfont: score(FontEntry(fname='/home/runner/micromamba/envs/trajan/lib/python3.14/site-packages/matplotlib/mpl-data/fonts/ttf/STIXSizOneSymReg.ttf', index=0, name='STIXSizeOneSym', style='normal', variant='normal', weight=400, stretch='normal', size='scalable')) = 10.05
2026-07-21 14:55:57 runnervm3jd5f matplotlib.font_manager[2874] DEBUG findfont: score(FontEntry(fname='/home/runner/micromamba/envs/trajan/lib/python3.14/site-packages/matplotlib/mpl-data/fonts/ttf/cmr10.ttf', index=0, name='cmr10', style='normal', variant='normal', weight=400, stretch='normal', size='scalable')) = 10.05
2026-07-21 14:55:57 runnervm3jd5f matplotlib.font_manager[2874] DEBUG findfont: score(FontEntry(fname='/home/runner/micromamba/envs/trajan/lib/python3.14/site-packages/matplotlib/mpl-data/fonts/ttf/STIXGeneralBol.ttf', index=0, name='STIXGeneral', style='normal', variant='normal', weight=700, stretch='normal', size='scalable')) = 10.335
2026-07-21 14:55:57 runnervm3jd5f matplotlib.font_manager[2874] DEBUG findfont: score(FontEntry(fname='/home/runner/micromamba/envs/trajan/lib/python3.14/site-packages/matplotlib/mpl-data/fonts/ttf/DejaVuSans-BoldOblique.ttf', index=0, name='DejaVu Sans', style='oblique', variant='normal', weight=700, stretch='normal', size='scalable')) = 11.335
2026-07-21 14:55:57 runnervm3jd5f matplotlib.font_manager[2874] DEBUG findfont: score(FontEntry(fname='/home/runner/micromamba/envs/trajan/lib/python3.14/site-packages/matplotlib/mpl-data/fonts/ttf/STIXSizFourSymReg.ttf', index=0, name='STIXSizeFourSym', style='normal', variant='normal', weight=400, stretch='normal', size='scalable')) = 10.05
2026-07-21 14:55:57 runnervm3jd5f matplotlib.font_manager[2874] DEBUG findfont: score(FontEntry(fname='/usr/share/fonts/truetype/lato/Lato-Black.ttf', index=0, name='Lato', style='normal', variant='normal', weight=900, stretch='normal', size='scalable')) = 10.525
2026-07-21 14:55:57 runnervm3jd5f matplotlib.font_manager[2874] DEBUG findfont: score(FontEntry(fname='/usr/share/fonts/truetype/lato/Lato-Black.ttf', index=0, name='Lato Black', style='normal', variant='normal', weight=400, stretch='normal', size='scalable')) = 10.05
2026-07-21 14:55:57 runnervm3jd5f matplotlib.font_manager[2874] DEBUG findfont: score(FontEntry(fname='/usr/share/fonts/truetype/liberation/LiberationSerif-Regular.ttf', index=0, name='Liberation Serif', style='normal', variant='normal', weight=400, stretch='normal', size='scalable')) = 10.05
2026-07-21 14:55:57 runnervm3jd5f matplotlib.font_manager[2874] DEBUG findfont: score(FontEntry(fname='/usr/share/fonts/truetype/dejavu/DejaVuSerifCondensed.ttf', index=0, name='DejaVu Serif', style='normal', variant='normal', weight=400, stretch='condensed', size='scalable')) = 10.25
2026-07-21 14:55:57 runnervm3jd5f matplotlib.font_manager[2874] DEBUG findfont: score(FontEntry(fname='/usr/share/fonts/truetype/dejavu/DejaVuSerifCondensed.ttf', index=0, name='DejaVu Serif Condensed', style='normal', variant='normal', weight=380, stretch='condensed', size='scalable')) = 10.269
2026-07-21 14:55:57 runnervm3jd5f matplotlib.font_manager[2874] DEBUG findfont: score(FontEntry(fname='/home/runner/micromamba/envs/trajan/fonts/UbuntuMono-BI.ttf', index=0, name='Ubuntu Mono', style='italic', variant='normal', weight=700, stretch='normal', size='scalable')) = 11.335
2026-07-21 14:55:57 runnervm3jd5f matplotlib.font_manager[2874] DEBUG findfont: score(FontEntry(fname='/usr/share/fonts/truetype/dejavu/DejaVuSans.ttf', index=0, name='DejaVu Sans', style='normal', variant='normal', weight=400, stretch='normal', size='scalable')) = 10.05
2026-07-21 14:55:57 runnervm3jd5f matplotlib.font_manager[2874] DEBUG findfont: score(FontEntry(fname='/usr/share/fonts/truetype/lato/Lato-Italic.ttf', index=0, name='Lato', style='italic', variant='normal', weight=400, stretch='normal', size='scalable')) = 11.05
2026-07-21 14:55:57 runnervm3jd5f matplotlib.font_manager[2874] DEBUG findfont: score(FontEntry(fname='/usr/share/fonts/truetype/liberation/LiberationSans-Italic.ttf', index=0, name='Liberation Sans', style='italic', variant='normal', weight=400, stretch='normal', size='scalable')) = 11.05
2026-07-21 14:55:57 runnervm3jd5f matplotlib.font_manager[2874] DEBUG findfont: score(FontEntry(fname='/home/runner/micromamba/envs/trajan/fonts/Ubuntu-B.ttf', index=0, name='Ubuntu', style='normal', variant='normal', weight=700, stretch='normal', size='scalable')) = 10.335
2026-07-21 14:55:57 runnervm3jd5f matplotlib.font_manager[2874] DEBUG findfont: score(FontEntry(fname='/home/runner/micromamba/envs/trajan/fonts/SourceCodePro-Semibold.ttf', index=0, name='Source Code Pro', style='normal', variant='normal', weight=600, stretch='normal', size='scalable')) = 10.24
2026-07-21 14:55:57 runnervm3jd5f matplotlib.font_manager[2874] DEBUG findfont: score(FontEntry(fname='/home/runner/micromamba/envs/trajan/fonts/SourceCodePro-Semibold.ttf', index=0, name='Source Code Pro Semibold', style='normal', variant='normal', weight=400, stretch='normal', size='scalable')) = 10.05
2026-07-21 14:55:57 runnervm3jd5f matplotlib.font_manager[2874] DEBUG findfont: score(FontEntry(fname='/home/runner/micromamba/envs/trajan/fonts/SourceCodePro-Bold.ttf', index=0, name='Source Code Pro', style='normal', variant='normal', weight=700, stretch='normal', size='scalable')) = 10.335
2026-07-21 14:55:57 runnervm3jd5f matplotlib.font_manager[2874] DEBUG findfont: score(FontEntry(fname='/home/runner/micromamba/envs/trajan/fonts/Ubuntu-MI.ttf', index=0, name='Ubuntu', style='italic', variant='normal', weight=500, stretch='normal', size='scalable')) = 11.145
2026-07-21 14:55:57 runnervm3jd5f matplotlib.font_manager[2874] DEBUG findfont: score(FontEntry(fname='/home/runner/micromamba/envs/trajan/fonts/Ubuntu-MI.ttf', index=0, name='Ubuntu Light', style='italic', variant='normal', weight=700, stretch='normal', size='scalable')) = 11.335
2026-07-21 14:55:57 runnervm3jd5f matplotlib.font_manager[2874] DEBUG findfont: score(FontEntry(fname='/usr/share/fonts/truetype/lato/Lato-Regular.ttf', index=0, name='Lato', style='normal', variant='normal', weight=400, stretch='normal', size='scalable')) = 10.05
2026-07-21 14:55:57 runnervm3jd5f matplotlib.font_manager[2874] DEBUG findfont: score(FontEntry(fname='/usr/share/fonts/truetype/lato/Lato-ThinItalic.ttf', index=0, name='Lato', style='italic', variant='normal', weight=275, stretch='normal', size='scalable')) = 11.16875
2026-07-21 14:55:57 runnervm3jd5f matplotlib.font_manager[2874] DEBUG findfont: score(FontEntry(fname='/usr/share/fonts/truetype/lato/Lato-ThinItalic.ttf', index=0, name='Lato Thin', style='italic', variant='normal', weight=400, stretch='normal', size='scalable')) = 11.05
2026-07-21 14:55:57 runnervm3jd5f matplotlib.font_manager[2874] DEBUG findfont: score(FontEntry(fname='/usr/share/fonts/truetype/lato/Lato-BlackItalic.ttf', index=0, name='Lato', style='italic', variant='normal', weight=900, stretch='normal', size='scalable')) = 11.525
2026-07-21 14:55:57 runnervm3jd5f matplotlib.font_manager[2874] DEBUG findfont: score(FontEntry(fname='/usr/share/fonts/truetype/lato/Lato-BlackItalic.ttf', index=0, name='Lato Black', style='italic', variant='normal', weight=400, stretch='normal', size='scalable')) = 11.05
2026-07-21 14:55:57 runnervm3jd5f matplotlib.font_manager[2874] DEBUG findfont: score(FontEntry(fname='/usr/share/fonts/truetype/dejavu/DejaVuSerifCondensed-Italic.ttf', index=0, name='DejaVu Serif', style='italic', variant='normal', weight=400, stretch='condensed', size='scalable')) = 11.25
2026-07-21 14:55:57 runnervm3jd5f matplotlib.font_manager[2874] DEBUG findfont: score(FontEntry(fname='/usr/share/fonts/truetype/dejavu/DejaVuSerifCondensed-Italic.ttf', index=0, name='DejaVu Serif Condensed', style='italic', variant='normal', weight=400, stretch='condensed', size='scalable')) = 11.25
2026-07-21 14:55:57 runnervm3jd5f matplotlib.font_manager[2874] DEBUG findfont: score(FontEntry(fname='/usr/share/fonts/truetype/dejavu/DejaVuSans-Bold.ttf', index=0, name='DejaVu Sans', style='normal', variant='normal', weight=700, stretch='normal', size='scalable')) = 10.335
2026-07-21 14:55:57 runnervm3jd5f matplotlib.font_manager[2874] DEBUG findfont: score(FontEntry(fname='/home/runner/micromamba/envs/trajan/fonts/UbuntuMono-R.ttf', index=0, name='Ubuntu Mono', style='normal', variant='normal', weight=400, stretch='normal', size='scalable')) = 10.05
2026-07-21 14:55:57 runnervm3jd5f matplotlib.font_manager[2874] DEBUG findfont: score(FontEntry(fname='/usr/share/fonts/truetype/dejavu/DejaVuSerif-BoldItalic.ttf', index=0, name='DejaVu Serif', style='italic', variant='normal', weight=700, stretch='normal', size='scalable')) = 11.335
2026-07-21 14:55:57 runnervm3jd5f matplotlib.font_manager[2874] DEBUG findfont: score(FontEntry(fname='/usr/share/fonts/truetype/lato/Lato-Hairline.ttf', index=0, name='Lato', style='normal', variant='normal', weight=250, stretch='normal', size='scalable')) = 10.1925
2026-07-21 14:55:57 runnervm3jd5f matplotlib.font_manager[2874] DEBUG findfont: score(FontEntry(fname='/usr/share/fonts/truetype/lato/Lato-Hairline.ttf', index=0, name='Lato Hairline', style='normal', variant='normal', weight=400, stretch='normal', size='scalable')) = 10.05
2026-07-21 14:55:57 runnervm3jd5f matplotlib.font_manager[2874] DEBUG findfont: score(FontEntry(fname='/usr/share/fonts/truetype/lato/Lato-LightItalic.ttf', index=0, name='Lato', style='italic', variant='normal', weight=300, stretch='normal', size='scalable')) = 11.145
2026-07-21 14:55:57 runnervm3jd5f matplotlib.font_manager[2874] DEBUG findfont: score(FontEntry(fname='/usr/share/fonts/truetype/lato/Lato-LightItalic.ttf', index=0, name='Lato Light', style='italic', variant='normal', weight=400, stretch='normal', size='scalable')) = 11.05
2026-07-21 14:55:57 runnervm3jd5f matplotlib.font_manager[2874] DEBUG findfont: score(FontEntry(fname='/usr/share/fonts/truetype/dejavu/DejaVuSansCondensed-BoldOblique.ttf', index=0, name='DejaVu Sans', style='oblique', variant='normal', weight=700, stretch='condensed', size='scalable')) = 11.535
2026-07-21 14:55:57 runnervm3jd5f matplotlib.font_manager[2874] DEBUG findfont: score(FontEntry(fname='/usr/share/fonts/truetype/dejavu/DejaVuSansCondensed-BoldOblique.ttf', index=0, name='DejaVu Sans Condensed', style='oblique', variant='normal', weight=700, stretch='condensed', size='scalable')) = 11.535
2026-07-21 14:55:57 runnervm3jd5f matplotlib.font_manager[2874] DEBUG findfont: score(FontEntry(fname='/home/runner/micromamba/envs/trajan/fonts/SourceCodePro-It.ttf', index=0, name='Source Code Pro', style='italic', variant='normal', weight=400, stretch='normal', size='scalable')) = 11.05
2026-07-21 14:55:57 runnervm3jd5f matplotlib.font_manager[2874] DEBUG findfont: score(FontEntry(fname='/home/runner/micromamba/envs/trajan/fonts/SourceCodePro-ExtraLightIt.ttf', index=0, name='Source Code Pro', style='italic', variant='normal', weight=200, stretch='normal', size='scalable')) = 11.24
2026-07-21 14:55:57 runnervm3jd5f matplotlib.font_manager[2874] DEBUG findfont: score(FontEntry(fname='/home/runner/micromamba/envs/trajan/fonts/SourceCodePro-ExtraLightIt.ttf', index=0, name='Source Code Pro ExtraLight', style='italic', variant='normal', weight=400, stretch='normal', size='scalable')) = 11.05
2026-07-21 14:55:57 runnervm3jd5f matplotlib.font_manager[2874] DEBUG findfont: score(FontEntry(fname='/usr/share/fonts/truetype/lato/Lato-Medium.ttf', index=0, name='Lato', style='normal', variant='normal', weight=500, stretch='normal', size='scalable')) = 10.145
2026-07-21 14:55:57 runnervm3jd5f matplotlib.font_manager[2874] DEBUG findfont: score(FontEntry(fname='/usr/share/fonts/truetype/lato/Lato-Medium.ttf', index=0, name='Lato Medium', style='normal', variant='normal', weight=400, stretch='normal', size='scalable')) = 10.05
2026-07-21 14:55:57 runnervm3jd5f matplotlib.font_manager[2874] DEBUG findfont: score(FontEntry(fname='/usr/share/fonts/truetype/lato/Lato-BoldItalic.ttf', index=0, name='Lato', style='italic', variant='normal', weight=700, stretch='normal', size='scalable')) = 11.335
2026-07-21 14:55:57 runnervm3jd5f matplotlib.font_manager[2874] DEBUG findfont: score(FontEntry(fname='/home/runner/micromamba/envs/trajan/fonts/DejaVuSans.ttf', index=0, name='DejaVu Sans', style='normal', variant='normal', weight=400, stretch='normal', size='scalable')) = 10.05
2026-07-21 14:55:57 runnervm3jd5f matplotlib.font_manager[2874] DEBUG findfont: score(FontEntry(fname='/home/runner/micromamba/envs/trajan/fonts/UbuntuMono-B.ttf', index=0, name='Ubuntu Mono', style='normal', variant='normal', weight=700, stretch='normal', size='scalable')) = 10.335
2026-07-21 14:55:57 runnervm3jd5f matplotlib.font_manager[2874] DEBUG findfont: score(FontEntry(fname='/home/runner/micromamba/envs/trajan/fonts/SourceCodePro-LightIt.ttf', index=0, name='Source Code Pro', style='italic', variant='normal', weight=300, stretch='normal', size='scalable')) = 11.145
2026-07-21 14:55:57 runnervm3jd5f matplotlib.font_manager[2874] DEBUG findfont: score(FontEntry(fname='/home/runner/micromamba/envs/trajan/fonts/SourceCodePro-LightIt.ttf', index=0, name='Source Code Pro Light', style='italic', variant='normal', weight=400, stretch='normal', size='scalable')) = 11.05
2026-07-21 14:55:57 runnervm3jd5f matplotlib.font_manager[2874] DEBUG findfont: score(FontEntry(fname='/usr/share/fonts/truetype/liberation/LiberationSans-BoldItalic.ttf', index=0, name='Liberation Sans', style='italic', variant='normal', weight=700, stretch='normal', size='scalable')) = 11.335
2026-07-21 14:55:57 runnervm3jd5f matplotlib.font_manager[2874] DEBUG findfont: score(FontEntry(fname='/usr/share/fonts/truetype/liberation/LiberationSans-Regular.ttf', index=0, name='Liberation Sans', style='normal', variant='normal', weight=400, stretch='normal', size='scalable')) = 10.05
2026-07-21 14:55:57 runnervm3jd5f matplotlib.font_manager[2874] DEBUG findfont: score(FontEntry(fname='/usr/share/fonts/truetype/dejavu/DejaVuSansMono-Bold.ttf', index=0, name='DejaVu Sans Mono', style='normal', variant='normal', weight=700, stretch='normal', size='scalable')) = 10.335
2026-07-21 14:55:57 runnervm3jd5f matplotlib.font_manager[2874] DEBUG findfont: score(FontEntry(fname='/home/runner/micromamba/envs/trajan/fonts/SourceCodePro-BoldIt.ttf', index=0, name='Source Code Pro', style='italic', variant='normal', weight=700, stretch='normal', size='scalable')) = 11.335
2026-07-21 14:55:57 runnervm3jd5f matplotlib.font_manager[2874] DEBUG findfont: score(FontEntry(fname='/usr/share/fonts/truetype/lato/Lato-Bold.ttf', index=0, name='Lato', style='normal', variant='normal', weight=700, stretch='normal', size='scalable')) = 10.335
2026-07-21 14:55:57 runnervm3jd5f matplotlib.font_manager[2874] DEBUG findfont: score(FontEntry(fname='/usr/share/fonts/truetype/dejavu/DejaVuSansCondensed.ttf', index=0, name='DejaVu Sans', style='normal', variant='normal', weight=400, stretch='condensed', size='scalable')) = 10.25
2026-07-21 14:55:57 runnervm3jd5f matplotlib.font_manager[2874] DEBUG findfont: score(FontEntry(fname='/usr/share/fonts/truetype/dejavu/DejaVuSansCondensed.ttf', index=0, name='DejaVu Sans Condensed', style='normal', variant='normal', weight=380, stretch='condensed', size='scalable')) = 10.269
2026-07-21 14:55:57 runnervm3jd5f matplotlib.font_manager[2874] DEBUG findfont: score(FontEntry(fname='/usr/share/fonts/truetype/lato/Lato-MediumItalic.ttf', index=0, name='Lato', style='italic', variant='normal', weight=500, stretch='normal', size='scalable')) = 11.145
2026-07-21 14:55:57 runnervm3jd5f matplotlib.font_manager[2874] DEBUG findfont: score(FontEntry(fname='/usr/share/fonts/truetype/lato/Lato-MediumItalic.ttf', index=0, name='Lato Medium', style='italic', variant='normal', weight=400, stretch='normal', size='scalable')) = 11.05
2026-07-21 14:55:57 runnervm3jd5f matplotlib.font_manager[2874] DEBUG findfont: score(FontEntry(fname='/usr/share/fonts/truetype/liberation/LiberationSans-Bold.ttf', index=0, name='Liberation Sans', style='normal', variant='normal', weight=700, stretch='normal', size='scalable')) = 10.335
2026-07-21 14:55:57 runnervm3jd5f matplotlib.font_manager[2874] DEBUG findfont: score(FontEntry(fname='/usr/share/fonts/truetype/dejavu/DejaVuSerifCondensed-BoldItalic.ttf', index=0, name='DejaVu Serif', style='italic', variant='normal', weight=700, stretch='condensed', size='scalable')) = 11.535
2026-07-21 14:55:57 runnervm3jd5f matplotlib.font_manager[2874] DEBUG findfont: score(FontEntry(fname='/usr/share/fonts/truetype/dejavu/DejaVuSerifCondensed-BoldItalic.ttf', index=0, name='DejaVu Serif Condensed', style='italic', variant='normal', weight=700, stretch='condensed', size='scalable')) = 11.535
2026-07-21 14:55:57 runnervm3jd5f matplotlib.font_manager[2874] DEBUG findfont: score(FontEntry(fname='/home/runner/micromamba/envs/trajan/fonts/Ubuntu-R.ttf', index=0, name='Ubuntu', style='normal', variant='normal', weight=400, stretch='normal', size='scalable')) = 10.05
2026-07-21 14:55:57 runnervm3jd5f matplotlib.font_manager[2874] DEBUG findfont: score(FontEntry(fname='/usr/share/fonts/truetype/lato/Lato-Light.ttf', index=0, name='Lato', style='normal', variant='normal', weight=300, stretch='normal', size='scalable')) = 10.145
2026-07-21 14:55:57 runnervm3jd5f matplotlib.font_manager[2874] DEBUG findfont: score(FontEntry(fname='/usr/share/fonts/truetype/lato/Lato-Light.ttf', index=0, name='Lato Light', style='normal', variant='normal', weight=400, stretch='normal', size='scalable')) = 10.05
2026-07-21 14:55:57 runnervm3jd5f matplotlib.font_manager[2874] DEBUG findfont: score(FontEntry(fname='/usr/share/fonts/truetype/liberation/LiberationSerif-BoldItalic.ttf', index=0, name='Liberation Serif', style='italic', variant='normal', weight=700, stretch='normal', size='scalable')) = 11.335
2026-07-21 14:55:57 runnervm3jd5f matplotlib.font_manager[2874] DEBUG findfont: score(FontEntry(fname='/home/runner/micromamba/envs/trajan/fonts/Ubuntu-Th.ttf', index=0, name='Ubuntu', style='normal', variant='normal', weight=250, stretch='normal', size='scalable')) = 10.1925
2026-07-21 14:55:57 runnervm3jd5f matplotlib.font_manager[2874] DEBUG findfont: score(FontEntry(fname='/home/runner/micromamba/envs/trajan/fonts/Ubuntu-Th.ttf', index=0, name='Ubuntu Thin', style='normal', variant='normal', weight=400, stretch='normal', size='scalable')) = 10.05
2026-07-21 14:55:57 runnervm3jd5f matplotlib.font_manager[2874] DEBUG findfont: score(FontEntry(fname='/home/runner/micromamba/envs/trajan/fonts/SourceCodePro-ExtraLight.ttf', index=0, name='Source Code Pro', style='normal', variant='normal', weight=200, stretch='normal', size='scalable')) = 10.24
2026-07-21 14:55:57 runnervm3jd5f matplotlib.font_manager[2874] DEBUG findfont: score(FontEntry(fname='/home/runner/micromamba/envs/trajan/fonts/SourceCodePro-ExtraLight.ttf', index=0, name='Source Code Pro ExtraLight', style='normal', variant='normal', weight=400, stretch='normal', size='scalable')) = 10.05
2026-07-21 14:55:57 runnervm3jd5f matplotlib.font_manager[2874] DEBUG findfont: score(FontEntry(fname='/usr/share/fonts/truetype/lato/Lato-Thin.ttf', index=0, name='Lato', style='normal', variant='normal', weight=275, stretch='normal', size='scalable')) = 10.16875
2026-07-21 14:55:57 runnervm3jd5f matplotlib.font_manager[2874] DEBUG findfont: score(FontEntry(fname='/usr/share/fonts/truetype/lato/Lato-Thin.ttf', index=0, name='Lato Thin', style='normal', variant='normal', weight=400, stretch='normal', size='scalable')) = 10.05
2026-07-21 14:55:57 runnervm3jd5f matplotlib.font_manager[2874] DEBUG findfont: score(FontEntry(fname='/usr/share/fonts/truetype/liberation/LiberationSerif-Bold.ttf', index=0, name='Liberation Serif', style='normal', variant='normal', weight=700, stretch='normal', size='scalable')) = 10.335
2026-07-21 14:55:57 runnervm3jd5f matplotlib.font_manager[2874] DEBUG findfont: score(FontEntry(fname='/home/runner/micromamba/envs/trajan/fonts/Inconsolata-Regular.ttf', index=0, name='Inconsolata', style='normal', variant='normal', weight=400, stretch='normal', size='scalable')) = 10.05
2026-07-21 14:55:57 runnervm3jd5f matplotlib.font_manager[2874] DEBUG findfont: score(FontEntry(fname='/home/runner/micromamba/envs/trajan/fonts/Ubuntu-C.ttf', index=0, name='Ubuntu Condensed', style='normal', variant='normal', weight=400, stretch='condensed', size='scalable')) = 10.25
2026-07-21 14:55:57 runnervm3jd5f matplotlib.font_manager[2874] DEBUG findfont: score(FontEntry(fname='/usr/share/fonts/truetype/dejavu/DejaVuSansCondensed-Bold.ttf', index=0, name='DejaVu Sans', style='normal', variant='normal', weight=700, stretch='condensed', size='scalable')) = 10.535
2026-07-21 14:55:57 runnervm3jd5f matplotlib.font_manager[2874] DEBUG findfont: score(FontEntry(fname='/usr/share/fonts/truetype/dejavu/DejaVuSansCondensed-Bold.ttf', index=0, name='DejaVu Sans Condensed', style='normal', variant='normal', weight=700, stretch='condensed', size='scalable')) = 10.535
2026-07-21 14:55:57 runnervm3jd5f matplotlib.font_manager[2874] DEBUG findfont: score(FontEntry(fname='/usr/share/fonts/truetype/liberation/LiberationMono-Bold.ttf', index=0, name='Liberation Mono', style='normal', variant='normal', weight=700, stretch='normal', size='scalable')) = 10.335
2026-07-21 14:55:57 runnervm3jd5f matplotlib.font_manager[2874] DEBUG findfont: score(FontEntry(fname='/home/runner/micromamba/envs/trajan/fonts/SourceCodePro-Black.ttf', index=0, name='Source Code Pro', style='normal', variant='normal', weight=900, stretch='normal', size='scalable')) = 10.525
2026-07-21 14:55:57 runnervm3jd5f matplotlib.font_manager[2874] DEBUG findfont: score(FontEntry(fname='/home/runner/micromamba/envs/trajan/fonts/SourceCodePro-Black.ttf', index=0, name='Source Code Pro Black', style='normal', variant='normal', weight=400, stretch='normal', size='scalable')) = 10.05
2026-07-21 14:55:57 runnervm3jd5f matplotlib.font_manager[2874] DEBUG findfont: score(FontEntry(fname='/home/runner/micromamba/envs/trajan/fonts/SourceCodePro-BlackIt.ttf', index=0, name='Source Code Pro', style='italic', variant='normal', weight=900, stretch='normal', size='scalable')) = 11.525
2026-07-21 14:55:57 runnervm3jd5f matplotlib.font_manager[2874] DEBUG findfont: score(FontEntry(fname='/home/runner/micromamba/envs/trajan/fonts/SourceCodePro-BlackIt.ttf', index=0, name='Source Code Pro Black', style='italic', variant='normal', weight=400, stretch='normal', size='scalable')) = 11.05
2026-07-21 14:55:57 runnervm3jd5f matplotlib.font_manager[2874] DEBUG findfont: score(FontEntry(fname='/home/runner/micromamba/envs/trajan/fonts/Ubuntu-LI.ttf', index=0, name='Ubuntu', style='italic', variant='normal', weight=300, stretch='normal', size='scalable')) = 11.145
2026-07-21 14:55:57 runnervm3jd5f matplotlib.font_manager[2874] DEBUG findfont: score(FontEntry(fname='/home/runner/micromamba/envs/trajan/fonts/Ubuntu-LI.ttf', index=0, name='Ubuntu Light', style='italic', variant='normal', weight=400, stretch='normal', size='scalable')) = 11.05
2026-07-21 14:55:57 runnervm3jd5f matplotlib.font_manager[2874] DEBUG findfont: score(FontEntry(fname='/usr/share/fonts/truetype/liberation/LiberationMono-Regular.ttf', index=0, name='Liberation Mono', style='normal', variant='normal', weight=400, stretch='normal', size='scalable')) = 10.05
2026-07-21 14:55:57 runnervm3jd5f matplotlib.font_manager[2874] DEBUG findfont: score(FontEntry(fname='/home/runner/micromamba/envs/trajan/fonts/UbuntuMono-RI.ttf', index=0, name='Ubuntu Mono', style='italic', variant='normal', weight=400, stretch='normal', size='scalable')) = 11.05
2026-07-21 14:55:57 runnervm3jd5f matplotlib.font_manager[2874] DEBUG findfont: score(FontEntry(fname='/usr/share/fonts/truetype/lato/Lato-Heavy.ttf', index=0, name='Lato', style='normal', variant='normal', weight=800, stretch='normal', size='scalable')) = 10.43
2026-07-21 14:55:57 runnervm3jd5f matplotlib.font_manager[2874] DEBUG findfont: score(FontEntry(fname='/usr/share/fonts/truetype/lato/Lato-Heavy.ttf', index=0, name='Lato Heavy', style='normal', variant='normal', weight=400, stretch='normal', size='scalable')) = 10.05
2026-07-21 14:55:57 runnervm3jd5f matplotlib.font_manager[2874] DEBUG findfont: score(FontEntry(fname='/usr/share/fonts/truetype/lato/Lato-HairlineItalic.ttf', index=0, name='Lato', style='italic', variant='normal', weight=250, stretch='normal', size='scalable')) = 11.1925
2026-07-21 14:55:57 runnervm3jd5f matplotlib.font_manager[2874] DEBUG findfont: score(FontEntry(fname='/usr/share/fonts/truetype/lato/Lato-HairlineItalic.ttf', index=0, name='Lato Hairline', style='italic', variant='normal', weight=400, stretch='normal', size='scalable')) = 11.05
2026-07-21 14:55:57 runnervm3jd5f matplotlib.font_manager[2874] DEBUG findfont: score(FontEntry(fname='/usr/share/fonts/truetype/dejavu/DejaVuSerifCondensed-Bold.ttf', index=0, name='DejaVu Serif', style='normal', variant='normal', weight=700, stretch='condensed', size='scalable')) = 10.535
2026-07-21 14:55:57 runnervm3jd5f matplotlib.font_manager[2874] DEBUG findfont: score(FontEntry(fname='/usr/share/fonts/truetype/dejavu/DejaVuSerifCondensed-Bold.ttf', index=0, name='DejaVu Serif Condensed', style='normal', variant='normal', weight=700, stretch='condensed', size='scalable')) = 10.535
2026-07-21 14:55:57 runnervm3jd5f matplotlib.font_manager[2874] DEBUG findfont: score(FontEntry(fname='/usr/share/fonts/truetype/dejavu/DejaVuSansCondensed-Oblique.ttf', index=0, name='DejaVu Sans', style='oblique', variant='normal', weight=400, stretch='condensed', size='scalable')) = 11.25
2026-07-21 14:55:57 runnervm3jd5f matplotlib.font_manager[2874] DEBUG findfont: score(FontEntry(fname='/usr/share/fonts/truetype/dejavu/DejaVuSansCondensed-Oblique.ttf', index=0, name='DejaVu Sans Condensed', style='oblique', variant='normal', weight=400, stretch='condensed', size='scalable')) = 11.25
2026-07-21 14:55:57 runnervm3jd5f matplotlib.font_manager[2874] DEBUG findfont: score(FontEntry(fname='/usr/share/fonts/truetype/lato/Lato-SemiboldItalic.ttf', index=0, name='Lato', style='italic', variant='normal', weight=600, stretch='normal', size='scalable')) = 11.24
2026-07-21 14:55:57 runnervm3jd5f matplotlib.font_manager[2874] DEBUG findfont: score(FontEntry(fname='/usr/share/fonts/truetype/lato/Lato-SemiboldItalic.ttf', index=0, name='Lato Semibold', style='italic', variant='normal', weight=400, stretch='normal', size='scalable')) = 11.05
2026-07-21 14:55:57 runnervm3jd5f matplotlib.font_manager[2874] DEBUG findfont: score(FontEntry(fname='/usr/share/fonts/truetype/lato/Lato-Semibold.ttf', index=0, name='Lato', style='normal', variant='normal', weight=600, stretch='normal', size='scalable')) = 10.24
2026-07-21 14:55:57 runnervm3jd5f matplotlib.font_manager[2874] DEBUG findfont: score(FontEntry(fname='/usr/share/fonts/truetype/lato/Lato-Semibold.ttf', index=0, name='Lato Semibold', style='normal', variant='normal', weight=400, stretch='normal', size='scalable')) = 10.05
2026-07-21 14:55:57 runnervm3jd5f matplotlib.font_manager[2874] DEBUG findfont: score(FontEntry(fname='/home/runner/micromamba/envs/trajan/fonts/Inconsolata-Bold.ttf', index=0, name='Inconsolata', style='normal', variant='normal', weight=700, stretch='normal', size='scalable')) = 10.335
2026-07-21 14:55:57 runnervm3jd5f matplotlib.font_manager[2874] DEBUG findfont: score(FontEntry(fname='/usr/share/fonts/truetype/dejavu/DejaVuSans-ExtraLight.ttf', index=0, name='DejaVu Sans', style='normal', variant='normal', weight=200, stretch='normal', size='scalable')) = 10.24
2026-07-21 14:55:57 runnervm3jd5f matplotlib.font_manager[2874] DEBUG findfont: score(FontEntry(fname='/usr/share/fonts/truetype/dejavu/DejaVuSans-ExtraLight.ttf', index=0, name='DejaVu Sans Light', style='normal', variant='normal', weight=200, stretch='normal', size='scalable')) = 10.24
2026-07-21 14:55:57 runnervm3jd5f matplotlib.font_manager[2874] DEBUG findfont: score(FontEntry(fname='/home/runner/micromamba/envs/trajan/fonts/Ubuntu-BI.ttf', index=0, name='Ubuntu', style='italic', variant='normal', weight=700, stretch='normal', size='scalable')) = 11.335
2026-07-21 14:55:57 runnervm3jd5f matplotlib.font_manager[2874] DEBUG findfont: score(FontEntry(fname='/usr/share/fonts/truetype/dejavu/DejaVuSans-BoldOblique.ttf', index=0, name='DejaVu Sans', style='oblique', variant='normal', weight=700, stretch='normal', size='scalable')) = 11.335
2026-07-21 14:55:57 runnervm3jd5f matplotlib.font_manager[2874] DEBUG findfont: score(FontEntry(fname='/home/runner/micromamba/envs/trajan/fonts/Ubuntu-RI.ttf', index=0, name='Ubuntu', style='italic', variant='normal', weight=400, stretch='normal', size='scalable')) = 11.05
2026-07-21 14:55:57 runnervm3jd5f matplotlib.font_manager[2874] DEBUG findfont: score(FontEntry(fname='/usr/share/fonts/truetype/dejavu/DejaVuSerif-Italic.ttf', index=0, name='DejaVu Serif', style='italic', variant='normal', weight=400, stretch='normal', size='scalable')) = 11.05
2026-07-21 14:55:57 runnervm3jd5f matplotlib.font_manager[2874] DEBUG findfont: score(FontEntry(fname='/home/runner/micromamba/envs/trajan/fonts/SourceCodePro-Medium.ttf', index=0, name='Source Code Pro', style='normal', variant='normal', weight=500, stretch='normal', size='scalable')) = 10.145
2026-07-21 14:55:57 runnervm3jd5f matplotlib.font_manager[2874] DEBUG findfont: score(FontEntry(fname='/home/runner/micromamba/envs/trajan/fonts/SourceCodePro-Medium.ttf', index=0, name='Source Code Pro Medium', style='normal', variant='normal', weight=400, stretch='normal', size='scalable')) = 10.05
2026-07-21 14:55:57 runnervm3jd5f matplotlib.font_manager[2874] DEBUG findfont: score(FontEntry(fname='/usr/share/fonts/truetype/lato/Lato-HeavyItalic.ttf', index=0, name='Lato', style='italic', variant='normal', weight=800, stretch='normal', size='scalable')) = 11.43
2026-07-21 14:55:57 runnervm3jd5f matplotlib.font_manager[2874] DEBUG findfont: score(FontEntry(fname='/usr/share/fonts/truetype/lato/Lato-HeavyItalic.ttf', index=0, name='Lato Heavy', style='italic', variant='normal', weight=400, stretch='normal', size='scalable')) = 11.05
2026-07-21 14:55:57 runnervm3jd5f matplotlib.font_manager[2874] DEBUG findfont: score(FontEntry(fname='/usr/share/fonts/truetype/dejavu/DejaVuSans-Oblique.ttf', index=0, name='DejaVu Sans', style='oblique', variant='normal', weight=400, stretch='normal', size='scalable')) = 11.05
2026-07-21 14:55:57 runnervm3jd5f matplotlib.font_manager[2874] DEBUG findfont: score(FontEntry(fname='/home/runner/micromamba/envs/trajan/fonts/Ubuntu-M.ttf', index=0, name='Ubuntu', style='normal', variant='normal', weight=500, stretch='normal', size='scalable')) = 10.145
2026-07-21 14:55:57 runnervm3jd5f matplotlib.font_manager[2874] DEBUG findfont: score(FontEntry(fname='/home/runner/micromamba/envs/trajan/fonts/Ubuntu-M.ttf', index=0, name='Ubuntu Light', style='normal', variant='normal', weight=700, stretch='normal', size='scalable')) = 10.335
2026-07-21 14:55:57 runnervm3jd5f matplotlib.font_manager[2874] DEBUG findfont: score(FontEntry(fname='/usr/share/fonts/truetype/liberation/LiberationMono-BoldItalic.ttf', index=0, name='Liberation Mono', style='italic', variant='normal', weight=700, stretch='normal', size='scalable')) = 11.335
2026-07-21 14:55:57 runnervm3jd5f matplotlib.font_manager[2874] DEBUG findfont: score(FontEntry(fname='/usr/share/fonts/truetype/dejavu/DejaVuSansMono.ttf', index=0, name='DejaVu Sans Mono', style='normal', variant='normal', weight=400, stretch='normal', size='scalable')) = 10.05
2026-07-21 14:55:57 runnervm3jd5f matplotlib.font_manager[2874] DEBUG findfont: score(FontEntry(fname='/usr/share/fonts/truetype/dejavu/DejaVuMathTeXGyre.ttf', index=0, name='DejaVu Math TeX Gyre', style='normal', variant='normal', weight=400, stretch='normal', size='scalable')) = 10.05
2026-07-21 14:55:57 runnervm3jd5f matplotlib.font_manager[2874] DEBUG findfont: score(FontEntry(fname='/usr/share/fonts/truetype/dejavu/DejaVuSansMono-Oblique.ttf', index=0, name='DejaVu Sans Mono', style='oblique', variant='normal', weight=400, stretch='normal', size='scalable')) = 11.05
2026-07-21 14:55:57 runnervm3jd5f matplotlib.font_manager[2874] DEBUG findfont: score(FontEntry(fname='/home/runner/micromamba/envs/trajan/fonts/Ubuntu-L.ttf', index=0, name='Ubuntu', style='normal', variant='normal', weight=300, stretch='normal', size='scalable')) = 10.145
2026-07-21 14:55:57 runnervm3jd5f matplotlib.font_manager[2874] DEBUG findfont: score(FontEntry(fname='/home/runner/micromamba/envs/trajan/fonts/Ubuntu-L.ttf', index=0, name='Ubuntu Light', style='normal', variant='normal', weight=400, stretch='normal', size='scalable')) = 10.05
2026-07-21 14:55:57 runnervm3jd5f matplotlib.font_manager[2874] DEBUG findfont: score(FontEntry(fname='/home/runner/micromamba/envs/trajan/fonts/SourceCodePro-MediumIt.ttf', index=0, name='Source Code Pro', style='italic', variant='normal', weight=500, stretch='normal', size='scalable')) = 11.145
2026-07-21 14:55:57 runnervm3jd5f matplotlib.font_manager[2874] DEBUG findfont: score(FontEntry(fname='/home/runner/micromamba/envs/trajan/fonts/SourceCodePro-MediumIt.ttf', index=0, name='Source Code Pro Medium', style='italic', variant='normal', weight=400, stretch='normal', size='scalable')) = 11.05
2026-07-21 14:55:57 runnervm3jd5f matplotlib.font_manager[2874] DEBUG findfont: score(FontEntry(fname='/home/runner/micromamba/envs/trajan/fonts/SourceCodePro-Regular.ttf', index=0, name='Source Code Pro', style='normal', variant='normal', weight=400, stretch='normal', size='scalable')) = 10.05
2026-07-21 14:55:57 runnervm3jd5f matplotlib.font_manager[2874] DEBUG findfont: score(FontEntry(fname='/home/runner/micromamba/envs/trajan/fonts/SourceCodePro-SemiboldIt.ttf', index=0, name='Source Code Pro', style='italic', variant='normal', weight=600, stretch='normal', size='scalable')) = 11.24
2026-07-21 14:55:57 runnervm3jd5f matplotlib.font_manager[2874] DEBUG findfont: score(FontEntry(fname='/home/runner/micromamba/envs/trajan/fonts/SourceCodePro-SemiboldIt.ttf', index=0, name='Source Code Pro Semibold', style='italic', variant='normal', weight=400, stretch='normal', size='scalable')) = 11.05
2026-07-21 14:55:57 runnervm3jd5f matplotlib.font_manager[2874] DEBUG findfont: score(FontEntry(fname='/usr/share/fonts/truetype/dejavu/DejaVuSerif.ttf', index=0, name='DejaVu Serif', style='normal', variant='normal', weight=400, stretch='normal', size='scalable')) = 10.05
2026-07-21 14:55:57 runnervm3jd5f matplotlib.font_manager[2874] DEBUG findfont: score(FontEntry(fname='/usr/share/fonts/truetype/dejavu/DejaVuSerif-Bold.ttf', index=0, name='DejaVu Serif', style='normal', variant='normal', weight=700, stretch='normal', size='scalable')) = 10.335
2026-07-21 14:55:57 runnervm3jd5f matplotlib.font_manager[2874] DEBUG findfont: score(FontEntry(fname='/usr/share/fonts/truetype/liberation/LiberationSerif-Italic.ttf', index=0, name='Liberation Serif', style='italic', variant='normal', weight=400, stretch='normal', size='scalable')) = 11.05
2026-07-21 14:55:57 runnervm3jd5f matplotlib.font_manager[2874] DEBUG findfont: score(FontEntry(fname='/usr/share/fonts/truetype/dejavu/DejaVuSansMono-BoldOblique.ttf', index=0, name='DejaVu Sans Mono', style='oblique', variant='normal', weight=700, stretch='normal', size='scalable')) = 11.335
2026-07-21 14:55:57 runnervm3jd5f matplotlib.font_manager[2874] DEBUG findfont: score(FontEntry(fname='/home/runner/micromamba/envs/trajan/fonts/SourceCodePro-Light.ttf', index=0, name='Source Code Pro', style='normal', variant='normal', weight=300, stretch='normal', size='scalable')) = 10.145
2026-07-21 14:55:57 runnervm3jd5f matplotlib.font_manager[2874] DEBUG findfont: score(FontEntry(fname='/home/runner/micromamba/envs/trajan/fonts/SourceCodePro-Light.ttf', index=0, name='Source Code Pro Light', style='normal', variant='normal', weight=400, stretch='normal', size='scalable')) = 10.05
2026-07-21 14:55:57 runnervm3jd5f matplotlib.font_manager[2874] DEBUG findfont: score(FontEntry(fname='/usr/share/fonts/truetype/liberation/LiberationMono-Italic.ttf', index=0, name='Liberation Mono', style='italic', variant='normal', weight=400, stretch='normal', size='scalable')) = 11.05
2026-07-21 14:55:57 runnervm3jd5f matplotlib.font_manager[2874] DEBUG findfont: Matching cmb10:style=normal:variant=normal:weight=normal:stretch=normal:size=10.0 to cmb10 ('/home/runner/micromamba/envs/trajan/lib/python3.14/site-packages/matplotlib/mpl-data/fonts/ttf/cmb10.ttf') with score of 0.050000.
2026-07-21 14:55:57 runnervm3jd5f matplotlib.font_manager[2874] DEBUG findfont: Matching cmss10:style=normal:variant=normal:weight=normal:stretch=normal:size=10.0.
2026-07-21 14:55:57 runnervm3jd5f matplotlib.font_manager[2874] DEBUG findfont: score(FontEntry(fname='/home/runner/micromamba/envs/trajan/lib/python3.14/site-packages/matplotlib/mpl-data/fonts/ttf/cmmi10.ttf', index=0, name='cmmi10', style='normal', variant='normal', weight=400, stretch='normal', size='scalable')) = 10.05
2026-07-21 14:55:57 runnervm3jd5f matplotlib.font_manager[2874] DEBUG findfont: score(FontEntry(fname='/home/runner/micromamba/envs/trajan/lib/python3.14/site-packages/matplotlib/mpl-data/fonts/ttf/DejaVuSerif-Bold.ttf', index=0, name='DejaVu Serif', style='normal', variant='normal', weight=700, stretch='normal', size='scalable')) = 10.335
2026-07-21 14:55:57 runnervm3jd5f matplotlib.font_manager[2874] DEBUG findfont: score(FontEntry(fname='/home/runner/micromamba/envs/trajan/lib/python3.14/site-packages/matplotlib/mpl-data/fonts/ttf/DejaVuSans-Oblique.ttf', index=0, name='DejaVu Sans', style='oblique', variant='normal', weight=400, stretch='normal', size='scalable')) = 11.05
2026-07-21 14:55:57 runnervm3jd5f matplotlib.font_manager[2874] DEBUG findfont: score(FontEntry(fname='/home/runner/micromamba/envs/trajan/lib/python3.14/site-packages/matplotlib/mpl-data/fonts/ttf/STIXSizThreeSymReg.ttf', index=0, name='STIXSizeThreeSym', style='normal', variant='normal', weight=400, stretch='normal', size='scalable')) = 10.05
2026-07-21 14:55:57 runnervm3jd5f matplotlib.font_manager[2874] DEBUG findfont: score(FontEntry(fname='/home/runner/micromamba/envs/trajan/lib/python3.14/site-packages/matplotlib/mpl-data/fonts/ttf/STIXNonUniBolIta.ttf', index=0, name='STIXNonUnicode', style='italic', variant='normal', weight=700, stretch='normal', size='scalable')) = 11.335
2026-07-21 14:55:57 runnervm3jd5f matplotlib.font_manager[2874] DEBUG findfont: score(FontEntry(fname='/home/runner/micromamba/envs/trajan/lib/python3.14/site-packages/matplotlib/mpl-data/fonts/ttf/DejaVuSerifDisplay.ttf', index=0, name='DejaVu Serif Display', style='normal', variant='normal', weight=400, stretch='normal', size='scalable')) = 10.05
2026-07-21 14:55:57 runnervm3jd5f matplotlib.font_manager[2874] DEBUG findfont: score(FontEntry(fname='/home/runner/micromamba/envs/trajan/lib/python3.14/site-packages/matplotlib/mpl-data/fonts/ttf/cmss10.ttf', index=0, name='cmss10', style='normal', variant='normal', weight=400, stretch='normal', size='scalable')) = 0.05
2026-07-21 14:55:57 runnervm3jd5f matplotlib.font_manager[2874] DEBUG findfont: score(FontEntry(fname='/home/runner/micromamba/envs/trajan/lib/python3.14/site-packages/matplotlib/mpl-data/fonts/ttf/STIXGeneralBolIta.ttf', index=0, name='STIXGeneral', style='italic', variant='normal', weight=700, stretch='normal', size='scalable')) = 11.335
2026-07-21 14:55:57 runnervm3jd5f matplotlib.font_manager[2874] DEBUG findfont: score(FontEntry(fname='/home/runner/micromamba/envs/trajan/lib/python3.14/site-packages/matplotlib/mpl-data/fonts/ttf/cmtt10.ttf', index=0, name='cmtt10', style='normal', variant='normal', weight=400, stretch='normal', size='scalable')) = 10.05
2026-07-21 14:55:57 runnervm3jd5f matplotlib.font_manager[2874] DEBUG findfont: score(FontEntry(fname='/home/runner/micromamba/envs/trajan/lib/python3.14/site-packages/matplotlib/mpl-data/fonts/ttf/cmsy10.ttf', index=0, name='cmsy10', style='normal', variant='normal', weight=400, stretch='normal', size='scalable')) = 10.05
2026-07-21 14:55:57 runnervm3jd5f matplotlib.font_manager[2874] DEBUG findfont: score(FontEntry(fname='/home/runner/micromamba/envs/trajan/lib/python3.14/site-packages/matplotlib/mpl-data/fonts/ttf/DejaVuSansMono-Oblique.ttf', index=0, name='DejaVu Sans Mono', style='oblique', variant='normal', weight=400, stretch='normal', size='scalable')) = 11.05
2026-07-21 14:55:57 runnervm3jd5f matplotlib.font_manager[2874] DEBUG findfont: score(FontEntry(fname='/home/runner/micromamba/envs/trajan/lib/python3.14/site-packages/matplotlib/mpl-data/fonts/ttf/STIXNonUniIta.ttf', index=0, name='STIXNonUnicode', style='italic', variant='normal', weight=400, stretch='normal', size='scalable')) = 11.05
2026-07-21 14:55:57 runnervm3jd5f matplotlib.font_manager[2874] DEBUG findfont: score(FontEntry(fname='/home/runner/micromamba/envs/trajan/lib/python3.14/site-packages/matplotlib/mpl-data/fonts/ttf/STIXGeneral.ttf', index=0, name='STIXGeneral', style='normal', variant='normal', weight=400, stretch='normal', size='scalable')) = 10.05
2026-07-21 14:55:57 runnervm3jd5f matplotlib.font_manager[2874] DEBUG findfont: score(FontEntry(fname='/home/runner/micromamba/envs/trajan/lib/python3.14/site-packages/matplotlib/mpl-data/fonts/ttf/cmti10.ttf', index=0, name='cmti10', style='normal', variant='normal', weight=400, stretch='normal', size='scalable')) = 10.05
2026-07-21 14:55:57 runnervm3jd5f matplotlib.font_manager[2874] DEBUG findfont: score(FontEntry(fname='/home/runner/micromamba/envs/trajan/lib/python3.14/site-packages/matplotlib/mpl-data/fonts/ttf/DejaVuSansMono-BoldOblique.ttf', index=0, name='DejaVu Sans Mono', style='oblique', variant='normal', weight=700, stretch='normal', size='scalable')) = 11.335
2026-07-21 14:55:57 runnervm3jd5f matplotlib.font_manager[2874] DEBUG findfont: score(FontEntry(fname='/home/runner/micromamba/envs/trajan/lib/python3.14/site-packages/matplotlib/mpl-data/fonts/ttf/DejaVuSerif.ttf', index=0, name='DejaVu Serif', style='normal', variant='normal', weight=400, stretch='normal', size='scalable')) = 10.05
2026-07-21 14:55:57 runnervm3jd5f matplotlib.font_manager[2874] DEBUG findfont: score(FontEntry(fname='/home/runner/micromamba/envs/trajan/lib/python3.14/site-packages/matplotlib/mpl-data/fonts/ttf/LastResortHE-Regular.ttf', index=0, name='Last Resort High-Efficiency', style='normal', variant='normal', weight=400, stretch='normal', size='scalable')) = 10.05
2026-07-21 14:55:57 runnervm3jd5f matplotlib.font_manager[2874] DEBUG findfont: score(FontEntry(fname='/home/runner/micromamba/envs/trajan/lib/python3.14/site-packages/matplotlib/mpl-data/fonts/ttf/cmex10.ttf', index=0, name='cmex10', style='normal', variant='normal', weight=400, stretch='normal', size='scalable')) = 10.05
2026-07-21 14:55:57 runnervm3jd5f matplotlib.font_manager[2874] DEBUG findfont: score(FontEntry(fname='/home/runner/micromamba/envs/trajan/lib/python3.14/site-packages/matplotlib/mpl-data/fonts/ttf/STIXSizFiveSymReg.ttf', index=0, name='STIXSizeFiveSym', style='normal', variant='normal', weight=400, stretch='normal', size='scalable')) = 10.05
2026-07-21 14:55:57 runnervm3jd5f matplotlib.font_manager[2874] DEBUG findfont: score(FontEntry(fname='/home/runner/micromamba/envs/trajan/lib/python3.14/site-packages/matplotlib/mpl-data/fonts/ttf/STIXNonUniBol.ttf', index=0, name='STIXNonUnicode', style='normal', variant='normal', weight=700, stretch='normal', size='scalable')) = 10.335
2026-07-21 14:55:57 runnervm3jd5f matplotlib.font_manager[2874] DEBUG findfont: score(FontEntry(fname='/home/runner/micromamba/envs/trajan/lib/python3.14/site-packages/matplotlib/mpl-data/fonts/ttf/DejaVuSansDisplay.ttf', index=0, name='DejaVu Sans Display', style='normal', variant='normal', weight=400, stretch='normal', size='scalable')) = 10.05
2026-07-21 14:55:57 runnervm3jd5f matplotlib.font_manager[2874] DEBUG findfont: score(FontEntry(fname='/home/runner/micromamba/envs/trajan/lib/python3.14/site-packages/matplotlib/mpl-data/fonts/ttf/DejaVuSansMono.ttf', index=0, name='DejaVu Sans Mono', style='normal', variant='normal', weight=400, stretch='normal', size='scalable')) = 10.05
2026-07-21 14:55:57 runnervm3jd5f matplotlib.font_manager[2874] DEBUG findfont: score(FontEntry(fname='/home/runner/micromamba/envs/trajan/lib/python3.14/site-packages/matplotlib/mpl-data/fonts/ttf/cmb10.ttf', index=0, name='cmb10', style='normal', variant='normal', weight=400, stretch='normal', size='scalable')) = 10.05
2026-07-21 14:55:57 runnervm3jd5f matplotlib.font_manager[2874] DEBUG findfont: score(FontEntry(fname='/home/runner/micromamba/envs/trajan/lib/python3.14/site-packages/matplotlib/mpl-data/fonts/ttf/STIXSizTwoSymReg.ttf', index=0, name='STIXSizeTwoSym', style='normal', variant='normal', weight=400, stretch='normal', size='scalable')) = 10.05
2026-07-21 14:55:57 runnervm3jd5f matplotlib.font_manager[2874] DEBUG findfont: score(FontEntry(fname='/home/runner/micromamba/envs/trajan/lib/python3.14/site-packages/matplotlib/mpl-data/fonts/ttf/DejaVuSans.ttf', index=0, name='DejaVu Sans', style='normal', variant='normal', weight=400, stretch='normal', size='scalable')) = 10.05
2026-07-21 14:55:57 runnervm3jd5f matplotlib.font_manager[2874] DEBUG findfont: score(FontEntry(fname='/home/runner/micromamba/envs/trajan/lib/python3.14/site-packages/matplotlib/mpl-data/fonts/ttf/STIXNonUni.ttf', index=0, name='STIXNonUnicode', style='normal', variant='normal', weight=400, stretch='normal', size='scalable')) = 10.05
2026-07-21 14:55:57 runnervm3jd5f matplotlib.font_manager[2874] DEBUG findfont: score(FontEntry(fname='/home/runner/micromamba/envs/trajan/lib/python3.14/site-packages/matplotlib/mpl-data/fonts/ttf/STIXGeneralItalic.ttf', index=0, name='STIXGeneral', style='italic', variant='normal', weight=400, stretch='normal', size='scalable')) = 11.05
2026-07-21 14:55:57 runnervm3jd5f matplotlib.font_manager[2874] DEBUG findfont: score(FontEntry(fname='/home/runner/micromamba/envs/trajan/lib/python3.14/site-packages/matplotlib/mpl-data/fonts/ttf/STIXSizOneSymBol.ttf', index=0, name='STIXSizeOneSym', style='normal', variant='normal', weight=700, stretch='normal', size='scalable')) = 10.335
2026-07-21 14:55:57 runnervm3jd5f matplotlib.font_manager[2874] DEBUG findfont: score(FontEntry(fname='/home/runner/micromamba/envs/trajan/lib/python3.14/site-packages/matplotlib/mpl-data/fonts/ttf/DejaVuSansMono-Bold.ttf', index=0, name='DejaVu Sans Mono', style='normal', variant='normal', weight=700, stretch='normal', size='scalable')) = 10.335
2026-07-21 14:55:57 runnervm3jd5f matplotlib.font_manager[2874] DEBUG findfont: score(FontEntry(fname='/home/runner/micromamba/envs/trajan/lib/python3.14/site-packages/matplotlib/mpl-data/fonts/ttf/STIXSizTwoSymBol.ttf', index=0, name='STIXSizeTwoSym', style='normal', variant='normal', weight=700, stretch='normal', size='scalable')) = 10.335
2026-07-21 14:55:57 runnervm3jd5f matplotlib.font_manager[2874] DEBUG findfont: score(FontEntry(fname='/home/runner/micromamba/envs/trajan/lib/python3.14/site-packages/matplotlib/mpl-data/fonts/ttf/STIXSizThreeSymBol.ttf', index=0, name='STIXSizeThreeSym', style='normal', variant='normal', weight=700, stretch='normal', size='scalable')) = 10.335
2026-07-21 14:55:57 runnervm3jd5f matplotlib.font_manager[2874] DEBUG findfont: score(FontEntry(fname='/home/runner/micromamba/envs/trajan/lib/python3.14/site-packages/matplotlib/mpl-data/fonts/ttf/DejaVuSerif-BoldItalic.ttf', index=0, name='DejaVu Serif', style='italic', variant='normal', weight=700, stretch='normal', size='scalable')) = 11.335
2026-07-21 14:55:57 runnervm3jd5f matplotlib.font_manager[2874] DEBUG findfont: score(FontEntry(fname='/home/runner/micromamba/envs/trajan/lib/python3.14/site-packages/matplotlib/mpl-data/fonts/ttf/DejaVuSerif-Italic.ttf', index=0, name='DejaVu Serif', style='italic', variant='normal', weight=400, stretch='normal', size='scalable')) = 11.05
2026-07-21 14:55:57 runnervm3jd5f matplotlib.font_manager[2874] DEBUG findfont: score(FontEntry(fname='/home/runner/micromamba/envs/trajan/lib/python3.14/site-packages/matplotlib/mpl-data/fonts/ttf/DejaVuSans-Bold.ttf', index=0, name='DejaVu Sans', style='normal', variant='normal', weight=700, stretch='normal', size='scalable')) = 10.335
2026-07-21 14:55:57 runnervm3jd5f matplotlib.font_manager[2874] DEBUG findfont: score(FontEntry(fname='/home/runner/micromamba/envs/trajan/lib/python3.14/site-packages/matplotlib/mpl-data/fonts/ttf/STIXSizFourSymBol.ttf', index=0, name='STIXSizeFourSym', style='normal', variant='normal', weight=700, stretch='normal', size='scalable')) = 10.335
2026-07-21 14:55:57 runnervm3jd5f matplotlib.font_manager[2874] DEBUG findfont: score(FontEntry(fname='/home/runner/micromamba/envs/trajan/lib/python3.14/site-packages/matplotlib/mpl-data/fonts/ttf/STIXSizOneSymReg.ttf', index=0, name='STIXSizeOneSym', style='normal', variant='normal', weight=400, stretch='normal', size='scalable')) = 10.05
2026-07-21 14:55:57 runnervm3jd5f matplotlib.font_manager[2874] DEBUG findfont: score(FontEntry(fname='/home/runner/micromamba/envs/trajan/lib/python3.14/site-packages/matplotlib/mpl-data/fonts/ttf/cmr10.ttf', index=0, name='cmr10', style='normal', variant='normal', weight=400, stretch='normal', size='scalable')) = 10.05
2026-07-21 14:55:57 runnervm3jd5f matplotlib.font_manager[2874] DEBUG findfont: score(FontEntry(fname='/home/runner/micromamba/envs/trajan/lib/python3.14/site-packages/matplotlib/mpl-data/fonts/ttf/STIXGeneralBol.ttf', index=0, name='STIXGeneral', style='normal', variant='normal', weight=700, stretch='normal', size='scalable')) = 10.335
2026-07-21 14:55:57 runnervm3jd5f matplotlib.font_manager[2874] DEBUG findfont: score(FontEntry(fname='/home/runner/micromamba/envs/trajan/lib/python3.14/site-packages/matplotlib/mpl-data/fonts/ttf/DejaVuSans-BoldOblique.ttf', index=0, name='DejaVu Sans', style='oblique', variant='normal', weight=700, stretch='normal', size='scalable')) = 11.335
2026-07-21 14:55:57 runnervm3jd5f matplotlib.font_manager[2874] DEBUG findfont: score(FontEntry(fname='/home/runner/micromamba/envs/trajan/lib/python3.14/site-packages/matplotlib/mpl-data/fonts/ttf/STIXSizFourSymReg.ttf', index=0, name='STIXSizeFourSym', style='normal', variant='normal', weight=400, stretch='normal', size='scalable')) = 10.05
2026-07-21 14:55:57 runnervm3jd5f matplotlib.font_manager[2874] DEBUG findfont: score(FontEntry(fname='/usr/share/fonts/truetype/lato/Lato-Black.ttf', index=0, name='Lato', style='normal', variant='normal', weight=900, stretch='normal', size='scalable')) = 10.525
2026-07-21 14:55:57 runnervm3jd5f matplotlib.font_manager[2874] DEBUG findfont: score(FontEntry(fname='/usr/share/fonts/truetype/lato/Lato-Black.ttf', index=0, name='Lato Black', style='normal', variant='normal', weight=400, stretch='normal', size='scalable')) = 10.05
2026-07-21 14:55:57 runnervm3jd5f matplotlib.font_manager[2874] DEBUG findfont: score(FontEntry(fname='/usr/share/fonts/truetype/liberation/LiberationSerif-Regular.ttf', index=0, name='Liberation Serif', style='normal', variant='normal', weight=400, stretch='normal', size='scalable')) = 10.05
2026-07-21 14:55:57 runnervm3jd5f matplotlib.font_manager[2874] DEBUG findfont: score(FontEntry(fname='/usr/share/fonts/truetype/dejavu/DejaVuSerifCondensed.ttf', index=0, name='DejaVu Serif', style='normal', variant='normal', weight=400, stretch='condensed', size='scalable')) = 10.25
2026-07-21 14:55:57 runnervm3jd5f matplotlib.font_manager[2874] DEBUG findfont: score(FontEntry(fname='/usr/share/fonts/truetype/dejavu/DejaVuSerifCondensed.ttf', index=0, name='DejaVu Serif Condensed', style='normal', variant='normal', weight=380, stretch='condensed', size='scalable')) = 10.269
2026-07-21 14:55:57 runnervm3jd5f matplotlib.font_manager[2874] DEBUG findfont: score(FontEntry(fname='/home/runner/micromamba/envs/trajan/fonts/UbuntuMono-BI.ttf', index=0, name='Ubuntu Mono', style='italic', variant='normal', weight=700, stretch='normal', size='scalable')) = 11.335
2026-07-21 14:55:57 runnervm3jd5f matplotlib.font_manager[2874] DEBUG findfont: score(FontEntry(fname='/usr/share/fonts/truetype/dejavu/DejaVuSans.ttf', index=0, name='DejaVu Sans', style='normal', variant='normal', weight=400, stretch='normal', size='scalable')) = 10.05
2026-07-21 14:55:57 runnervm3jd5f matplotlib.font_manager[2874] DEBUG findfont: score(FontEntry(fname='/usr/share/fonts/truetype/lato/Lato-Italic.ttf', index=0, name='Lato', style='italic', variant='normal', weight=400, stretch='normal', size='scalable')) = 11.05
2026-07-21 14:55:57 runnervm3jd5f matplotlib.font_manager[2874] DEBUG findfont: score(FontEntry(fname='/usr/share/fonts/truetype/liberation/LiberationSans-Italic.ttf', index=0, name='Liberation Sans', style='italic', variant='normal', weight=400, stretch='normal', size='scalable')) = 11.05
2026-07-21 14:55:57 runnervm3jd5f matplotlib.font_manager[2874] DEBUG findfont: score(FontEntry(fname='/home/runner/micromamba/envs/trajan/fonts/Ubuntu-B.ttf', index=0, name='Ubuntu', style='normal', variant='normal', weight=700, stretch='normal', size='scalable')) = 10.335
2026-07-21 14:55:57 runnervm3jd5f matplotlib.font_manager[2874] DEBUG findfont: score(FontEntry(fname='/home/runner/micromamba/envs/trajan/fonts/SourceCodePro-Semibold.ttf', index=0, name='Source Code Pro', style='normal', variant='normal', weight=600, stretch='normal', size='scalable')) = 10.24
2026-07-21 14:55:57 runnervm3jd5f matplotlib.font_manager[2874] DEBUG findfont: score(FontEntry(fname='/home/runner/micromamba/envs/trajan/fonts/SourceCodePro-Semibold.ttf', index=0, name='Source Code Pro Semibold', style='normal', variant='normal', weight=400, stretch='normal', size='scalable')) = 10.05
2026-07-21 14:55:57 runnervm3jd5f matplotlib.font_manager[2874] DEBUG findfont: score(FontEntry(fname='/home/runner/micromamba/envs/trajan/fonts/SourceCodePro-Bold.ttf', index=0, name='Source Code Pro', style='normal', variant='normal', weight=700, stretch='normal', size='scalable')) = 10.335
2026-07-21 14:55:57 runnervm3jd5f matplotlib.font_manager[2874] DEBUG findfont: score(FontEntry(fname='/home/runner/micromamba/envs/trajan/fonts/Ubuntu-MI.ttf', index=0, name='Ubuntu', style='italic', variant='normal', weight=500, stretch='normal', size='scalable')) = 11.145
2026-07-21 14:55:57 runnervm3jd5f matplotlib.font_manager[2874] DEBUG findfont: score(FontEntry(fname='/home/runner/micromamba/envs/trajan/fonts/Ubuntu-MI.ttf', index=0, name='Ubuntu Light', style='italic', variant='normal', weight=700, stretch='normal', size='scalable')) = 11.335
2026-07-21 14:55:57 runnervm3jd5f matplotlib.font_manager[2874] DEBUG findfont: score(FontEntry(fname='/usr/share/fonts/truetype/lato/Lato-Regular.ttf', index=0, name='Lato', style='normal', variant='normal', weight=400, stretch='normal', size='scalable')) = 10.05
2026-07-21 14:55:57 runnervm3jd5f matplotlib.font_manager[2874] DEBUG findfont: score(FontEntry(fname='/usr/share/fonts/truetype/lato/Lato-ThinItalic.ttf', index=0, name='Lato', style='italic', variant='normal', weight=275, stretch='normal', size='scalable')) = 11.16875
2026-07-21 14:55:57 runnervm3jd5f matplotlib.font_manager[2874] DEBUG findfont: score(FontEntry(fname='/usr/share/fonts/truetype/lato/Lato-ThinItalic.ttf', index=0, name='Lato Thin', style='italic', variant='normal', weight=400, stretch='normal', size='scalable')) = 11.05
2026-07-21 14:55:57 runnervm3jd5f matplotlib.font_manager[2874] DEBUG findfont: score(FontEntry(fname='/usr/share/fonts/truetype/lato/Lato-BlackItalic.ttf', index=0, name='Lato', style='italic', variant='normal', weight=900, stretch='normal', size='scalable')) = 11.525
2026-07-21 14:55:57 runnervm3jd5f matplotlib.font_manager[2874] DEBUG findfont: score(FontEntry(fname='/usr/share/fonts/truetype/lato/Lato-BlackItalic.ttf', index=0, name='Lato Black', style='italic', variant='normal', weight=400, stretch='normal', size='scalable')) = 11.05
2026-07-21 14:55:57 runnervm3jd5f matplotlib.font_manager[2874] DEBUG findfont: score(FontEntry(fname='/usr/share/fonts/truetype/dejavu/DejaVuSerifCondensed-Italic.ttf', index=0, name='DejaVu Serif', style='italic', variant='normal', weight=400, stretch='condensed', size='scalable')) = 11.25
2026-07-21 14:55:57 runnervm3jd5f matplotlib.font_manager[2874] DEBUG findfont: score(FontEntry(fname='/usr/share/fonts/truetype/dejavu/DejaVuSerifCondensed-Italic.ttf', index=0, name='DejaVu Serif Condensed', style='italic', variant='normal', weight=400, stretch='condensed', size='scalable')) = 11.25
2026-07-21 14:55:57 runnervm3jd5f matplotlib.font_manager[2874] DEBUG findfont: score(FontEntry(fname='/usr/share/fonts/truetype/dejavu/DejaVuSans-Bold.ttf', index=0, name='DejaVu Sans', style='normal', variant='normal', weight=700, stretch='normal', size='scalable')) = 10.335
2026-07-21 14:55:57 runnervm3jd5f matplotlib.font_manager[2874] DEBUG findfont: score(FontEntry(fname='/home/runner/micromamba/envs/trajan/fonts/UbuntuMono-R.ttf', index=0, name='Ubuntu Mono', style='normal', variant='normal', weight=400, stretch='normal', size='scalable')) = 10.05
2026-07-21 14:55:57 runnervm3jd5f matplotlib.font_manager[2874] DEBUG findfont: score(FontEntry(fname='/usr/share/fonts/truetype/dejavu/DejaVuSerif-BoldItalic.ttf', index=0, name='DejaVu Serif', style='italic', variant='normal', weight=700, stretch='normal', size='scalable')) = 11.335
2026-07-21 14:55:57 runnervm3jd5f matplotlib.font_manager[2874] DEBUG findfont: score(FontEntry(fname='/usr/share/fonts/truetype/lato/Lato-Hairline.ttf', index=0, name='Lato', style='normal', variant='normal', weight=250, stretch='normal', size='scalable')) = 10.1925
2026-07-21 14:55:57 runnervm3jd5f matplotlib.font_manager[2874] DEBUG findfont: score(FontEntry(fname='/usr/share/fonts/truetype/lato/Lato-Hairline.ttf', index=0, name='Lato Hairline', style='normal', variant='normal', weight=400, stretch='normal', size='scalable')) = 10.05
2026-07-21 14:55:57 runnervm3jd5f matplotlib.font_manager[2874] DEBUG findfont: score(FontEntry(fname='/usr/share/fonts/truetype/lato/Lato-LightItalic.ttf', index=0, name='Lato', style='italic', variant='normal', weight=300, stretch='normal', size='scalable')) = 11.145
2026-07-21 14:55:57 runnervm3jd5f matplotlib.font_manager[2874] DEBUG findfont: score(FontEntry(fname='/usr/share/fonts/truetype/lato/Lato-LightItalic.ttf', index=0, name='Lato Light', style='italic', variant='normal', weight=400, stretch='normal', size='scalable')) = 11.05
2026-07-21 14:55:57 runnervm3jd5f matplotlib.font_manager[2874] DEBUG findfont: score(FontEntry(fname='/usr/share/fonts/truetype/dejavu/DejaVuSansCondensed-BoldOblique.ttf', index=0, name='DejaVu Sans', style='oblique', variant='normal', weight=700, stretch='condensed', size='scalable')) = 11.535
2026-07-21 14:55:57 runnervm3jd5f matplotlib.font_manager[2874] DEBUG findfont: score(FontEntry(fname='/usr/share/fonts/truetype/dejavu/DejaVuSansCondensed-BoldOblique.ttf', index=0, name='DejaVu Sans Condensed', style='oblique', variant='normal', weight=700, stretch='condensed', size='scalable')) = 11.535
2026-07-21 14:55:57 runnervm3jd5f matplotlib.font_manager[2874] DEBUG findfont: score(FontEntry(fname='/home/runner/micromamba/envs/trajan/fonts/SourceCodePro-It.ttf', index=0, name='Source Code Pro', style='italic', variant='normal', weight=400, stretch='normal', size='scalable')) = 11.05
2026-07-21 14:55:57 runnervm3jd5f matplotlib.font_manager[2874] DEBUG findfont: score(FontEntry(fname='/home/runner/micromamba/envs/trajan/fonts/SourceCodePro-ExtraLightIt.ttf', index=0, name='Source Code Pro', style='italic', variant='normal', weight=200, stretch='normal', size='scalable')) = 11.24
2026-07-21 14:55:57 runnervm3jd5f matplotlib.font_manager[2874] DEBUG findfont: score(FontEntry(fname='/home/runner/micromamba/envs/trajan/fonts/SourceCodePro-ExtraLightIt.ttf', index=0, name='Source Code Pro ExtraLight', style='italic', variant='normal', weight=400, stretch='normal', size='scalable')) = 11.05
2026-07-21 14:55:57 runnervm3jd5f matplotlib.font_manager[2874] DEBUG findfont: score(FontEntry(fname='/usr/share/fonts/truetype/lato/Lato-Medium.ttf', index=0, name='Lato', style='normal', variant='normal', weight=500, stretch='normal', size='scalable')) = 10.145
2026-07-21 14:55:57 runnervm3jd5f matplotlib.font_manager[2874] DEBUG findfont: score(FontEntry(fname='/usr/share/fonts/truetype/lato/Lato-Medium.ttf', index=0, name='Lato Medium', style='normal', variant='normal', weight=400, stretch='normal', size='scalable')) = 10.05
2026-07-21 14:55:57 runnervm3jd5f matplotlib.font_manager[2874] DEBUG findfont: score(FontEntry(fname='/usr/share/fonts/truetype/lato/Lato-BoldItalic.ttf', index=0, name='Lato', style='italic', variant='normal', weight=700, stretch='normal', size='scalable')) = 11.335
2026-07-21 14:55:57 runnervm3jd5f matplotlib.font_manager[2874] DEBUG findfont: score(FontEntry(fname='/home/runner/micromamba/envs/trajan/fonts/DejaVuSans.ttf', index=0, name='DejaVu Sans', style='normal', variant='normal', weight=400, stretch='normal', size='scalable')) = 10.05
2026-07-21 14:55:57 runnervm3jd5f matplotlib.font_manager[2874] DEBUG findfont: score(FontEntry(fname='/home/runner/micromamba/envs/trajan/fonts/UbuntuMono-B.ttf', index=0, name='Ubuntu Mono', style='normal', variant='normal', weight=700, stretch='normal', size='scalable')) = 10.335
2026-07-21 14:55:57 runnervm3jd5f matplotlib.font_manager[2874] DEBUG findfont: score(FontEntry(fname='/home/runner/micromamba/envs/trajan/fonts/SourceCodePro-LightIt.ttf', index=0, name='Source Code Pro', style='italic', variant='normal', weight=300, stretch='normal', size='scalable')) = 11.145
2026-07-21 14:55:57 runnervm3jd5f matplotlib.font_manager[2874] DEBUG findfont: score(FontEntry(fname='/home/runner/micromamba/envs/trajan/fonts/SourceCodePro-LightIt.ttf', index=0, name='Source Code Pro Light', style='italic', variant='normal', weight=400, stretch='normal', size='scalable')) = 11.05
2026-07-21 14:55:57 runnervm3jd5f matplotlib.font_manager[2874] DEBUG findfont: score(FontEntry(fname='/usr/share/fonts/truetype/liberation/LiberationSans-BoldItalic.ttf', index=0, name='Liberation Sans', style='italic', variant='normal', weight=700, stretch='normal', size='scalable')) = 11.335
2026-07-21 14:55:57 runnervm3jd5f matplotlib.font_manager[2874] DEBUG findfont: score(FontEntry(fname='/usr/share/fonts/truetype/liberation/LiberationSans-Regular.ttf', index=0, name='Liberation Sans', style='normal', variant='normal', weight=400, stretch='normal', size='scalable')) = 10.05
2026-07-21 14:55:57 runnervm3jd5f matplotlib.font_manager[2874] DEBUG findfont: score(FontEntry(fname='/usr/share/fonts/truetype/dejavu/DejaVuSansMono-Bold.ttf', index=0, name='DejaVu Sans Mono', style='normal', variant='normal', weight=700, stretch='normal', size='scalable')) = 10.335
2026-07-21 14:55:57 runnervm3jd5f matplotlib.font_manager[2874] DEBUG findfont: score(FontEntry(fname='/home/runner/micromamba/envs/trajan/fonts/SourceCodePro-BoldIt.ttf', index=0, name='Source Code Pro', style='italic', variant='normal', weight=700, stretch='normal', size='scalable')) = 11.335
2026-07-21 14:55:57 runnervm3jd5f matplotlib.font_manager[2874] DEBUG findfont: score(FontEntry(fname='/usr/share/fonts/truetype/lato/Lato-Bold.ttf', index=0, name='Lato', style='normal', variant='normal', weight=700, stretch='normal', size='scalable')) = 10.335
2026-07-21 14:55:57 runnervm3jd5f matplotlib.font_manager[2874] DEBUG findfont: score(FontEntry(fname='/usr/share/fonts/truetype/dejavu/DejaVuSansCondensed.ttf', index=0, name='DejaVu Sans', style='normal', variant='normal', weight=400, stretch='condensed', size='scalable')) = 10.25
2026-07-21 14:55:57 runnervm3jd5f matplotlib.font_manager[2874] DEBUG findfont: score(FontEntry(fname='/usr/share/fonts/truetype/dejavu/DejaVuSansCondensed.ttf', index=0, name='DejaVu Sans Condensed', style='normal', variant='normal', weight=380, stretch='condensed', size='scalable')) = 10.269
2026-07-21 14:55:57 runnervm3jd5f matplotlib.font_manager[2874] DEBUG findfont: score(FontEntry(fname='/usr/share/fonts/truetype/lato/Lato-MediumItalic.ttf', index=0, name='Lato', style='italic', variant='normal', weight=500, stretch='normal', size='scalable')) = 11.145
2026-07-21 14:55:57 runnervm3jd5f matplotlib.font_manager[2874] DEBUG findfont: score(FontEntry(fname='/usr/share/fonts/truetype/lato/Lato-MediumItalic.ttf', index=0, name='Lato Medium', style='italic', variant='normal', weight=400, stretch='normal', size='scalable')) = 11.05
2026-07-21 14:55:57 runnervm3jd5f matplotlib.font_manager[2874] DEBUG findfont: score(FontEntry(fname='/usr/share/fonts/truetype/liberation/LiberationSans-Bold.ttf', index=0, name='Liberation Sans', style='normal', variant='normal', weight=700, stretch='normal', size='scalable')) = 10.335
2026-07-21 14:55:57 runnervm3jd5f matplotlib.font_manager[2874] DEBUG findfont: score(FontEntry(fname='/usr/share/fonts/truetype/dejavu/DejaVuSerifCondensed-BoldItalic.ttf', index=0, name='DejaVu Serif', style='italic', variant='normal', weight=700, stretch='condensed', size='scalable')) = 11.535
2026-07-21 14:55:57 runnervm3jd5f matplotlib.font_manager[2874] DEBUG findfont: score(FontEntry(fname='/usr/share/fonts/truetype/dejavu/DejaVuSerifCondensed-BoldItalic.ttf', index=0, name='DejaVu Serif Condensed', style='italic', variant='normal', weight=700, stretch='condensed', size='scalable')) = 11.535
2026-07-21 14:55:57 runnervm3jd5f matplotlib.font_manager[2874] DEBUG findfont: score(FontEntry(fname='/home/runner/micromamba/envs/trajan/fonts/Ubuntu-R.ttf', index=0, name='Ubuntu', style='normal', variant='normal', weight=400, stretch='normal', size='scalable')) = 10.05
2026-07-21 14:55:57 runnervm3jd5f matplotlib.font_manager[2874] DEBUG findfont: score(FontEntry(fname='/usr/share/fonts/truetype/lato/Lato-Light.ttf', index=0, name='Lato', style='normal', variant='normal', weight=300, stretch='normal', size='scalable')) = 10.145
2026-07-21 14:55:57 runnervm3jd5f matplotlib.font_manager[2874] DEBUG findfont: score(FontEntry(fname='/usr/share/fonts/truetype/lato/Lato-Light.ttf', index=0, name='Lato Light', style='normal', variant='normal', weight=400, stretch='normal', size='scalable')) = 10.05
2026-07-21 14:55:57 runnervm3jd5f matplotlib.font_manager[2874] DEBUG findfont: score(FontEntry(fname='/usr/share/fonts/truetype/liberation/LiberationSerif-BoldItalic.ttf', index=0, name='Liberation Serif', style='italic', variant='normal', weight=700, stretch='normal', size='scalable')) = 11.335
2026-07-21 14:55:57 runnervm3jd5f matplotlib.font_manager[2874] DEBUG findfont: score(FontEntry(fname='/home/runner/micromamba/envs/trajan/fonts/Ubuntu-Th.ttf', index=0, name='Ubuntu', style='normal', variant='normal', weight=250, stretch='normal', size='scalable')) = 10.1925
2026-07-21 14:55:57 runnervm3jd5f matplotlib.font_manager[2874] DEBUG findfont: score(FontEntry(fname='/home/runner/micromamba/envs/trajan/fonts/Ubuntu-Th.ttf', index=0, name='Ubuntu Thin', style='normal', variant='normal', weight=400, stretch='normal', size='scalable')) = 10.05
2026-07-21 14:55:57 runnervm3jd5f matplotlib.font_manager[2874] DEBUG findfont: score(FontEntry(fname='/home/runner/micromamba/envs/trajan/fonts/SourceCodePro-ExtraLight.ttf', index=0, name='Source Code Pro', style='normal', variant='normal', weight=200, stretch='normal', size='scalable')) = 10.24
2026-07-21 14:55:57 runnervm3jd5f matplotlib.font_manager[2874] DEBUG findfont: score(FontEntry(fname='/home/runner/micromamba/envs/trajan/fonts/SourceCodePro-ExtraLight.ttf', index=0, name='Source Code Pro ExtraLight', style='normal', variant='normal', weight=400, stretch='normal', size='scalable')) = 10.05
2026-07-21 14:55:57 runnervm3jd5f matplotlib.font_manager[2874] DEBUG findfont: score(FontEntry(fname='/usr/share/fonts/truetype/lato/Lato-Thin.ttf', index=0, name='Lato', style='normal', variant='normal', weight=275, stretch='normal', size='scalable')) = 10.16875
2026-07-21 14:55:57 runnervm3jd5f matplotlib.font_manager[2874] DEBUG findfont: score(FontEntry(fname='/usr/share/fonts/truetype/lato/Lato-Thin.ttf', index=0, name='Lato Thin', style='normal', variant='normal', weight=400, stretch='normal', size='scalable')) = 10.05
2026-07-21 14:55:57 runnervm3jd5f matplotlib.font_manager[2874] DEBUG findfont: score(FontEntry(fname='/usr/share/fonts/truetype/liberation/LiberationSerif-Bold.ttf', index=0, name='Liberation Serif', style='normal', variant='normal', weight=700, stretch='normal', size='scalable')) = 10.335
2026-07-21 14:55:57 runnervm3jd5f matplotlib.font_manager[2874] DEBUG findfont: score(FontEntry(fname='/home/runner/micromamba/envs/trajan/fonts/Inconsolata-Regular.ttf', index=0, name='Inconsolata', style='normal', variant='normal', weight=400, stretch='normal', size='scalable')) = 10.05
2026-07-21 14:55:57 runnervm3jd5f matplotlib.font_manager[2874] DEBUG findfont: score(FontEntry(fname='/home/runner/micromamba/envs/trajan/fonts/Ubuntu-C.ttf', index=0, name='Ubuntu Condensed', style='normal', variant='normal', weight=400, stretch='condensed', size='scalable')) = 10.25
2026-07-21 14:55:57 runnervm3jd5f matplotlib.font_manager[2874] DEBUG findfont: score(FontEntry(fname='/usr/share/fonts/truetype/dejavu/DejaVuSansCondensed-Bold.ttf', index=0, name='DejaVu Sans', style='normal', variant='normal', weight=700, stretch='condensed', size='scalable')) = 10.535
2026-07-21 14:55:57 runnervm3jd5f matplotlib.font_manager[2874] DEBUG findfont: score(FontEntry(fname='/usr/share/fonts/truetype/dejavu/DejaVuSansCondensed-Bold.ttf', index=0, name='DejaVu Sans Condensed', style='normal', variant='normal', weight=700, stretch='condensed', size='scalable')) = 10.535
2026-07-21 14:55:57 runnervm3jd5f matplotlib.font_manager[2874] DEBUG findfont: score(FontEntry(fname='/usr/share/fonts/truetype/liberation/LiberationMono-Bold.ttf', index=0, name='Liberation Mono', style='normal', variant='normal', weight=700, stretch='normal', size='scalable')) = 10.335
2026-07-21 14:55:57 runnervm3jd5f matplotlib.font_manager[2874] DEBUG findfont: score(FontEntry(fname='/home/runner/micromamba/envs/trajan/fonts/SourceCodePro-Black.ttf', index=0, name='Source Code Pro', style='normal', variant='normal', weight=900, stretch='normal', size='scalable')) = 10.525
2026-07-21 14:55:57 runnervm3jd5f matplotlib.font_manager[2874] DEBUG findfont: score(FontEntry(fname='/home/runner/micromamba/envs/trajan/fonts/SourceCodePro-Black.ttf', index=0, name='Source Code Pro Black', style='normal', variant='normal', weight=400, stretch='normal', size='scalable')) = 10.05
2026-07-21 14:55:57 runnervm3jd5f matplotlib.font_manager[2874] DEBUG findfont: score(FontEntry(fname='/home/runner/micromamba/envs/trajan/fonts/SourceCodePro-BlackIt.ttf', index=0, name='Source Code Pro', style='italic', variant='normal', weight=900, stretch='normal', size='scalable')) = 11.525
2026-07-21 14:55:57 runnervm3jd5f matplotlib.font_manager[2874] DEBUG findfont: score(FontEntry(fname='/home/runner/micromamba/envs/trajan/fonts/SourceCodePro-BlackIt.ttf', index=0, name='Source Code Pro Black', style='italic', variant='normal', weight=400, stretch='normal', size='scalable')) = 11.05
2026-07-21 14:55:57 runnervm3jd5f matplotlib.font_manager[2874] DEBUG findfont: score(FontEntry(fname='/home/runner/micromamba/envs/trajan/fonts/Ubuntu-LI.ttf', index=0, name='Ubuntu', style='italic', variant='normal', weight=300, stretch='normal', size='scalable')) = 11.145
2026-07-21 14:55:57 runnervm3jd5f matplotlib.font_manager[2874] DEBUG findfont: score(FontEntry(fname='/home/runner/micromamba/envs/trajan/fonts/Ubuntu-LI.ttf', index=0, name='Ubuntu Light', style='italic', variant='normal', weight=400, stretch='normal', size='scalable')) = 11.05
2026-07-21 14:55:57 runnervm3jd5f matplotlib.font_manager[2874] DEBUG findfont: score(FontEntry(fname='/usr/share/fonts/truetype/liberation/LiberationMono-Regular.ttf', index=0, name='Liberation Mono', style='normal', variant='normal', weight=400, stretch='normal', size='scalable')) = 10.05
2026-07-21 14:55:57 runnervm3jd5f matplotlib.font_manager[2874] DEBUG findfont: score(FontEntry(fname='/home/runner/micromamba/envs/trajan/fonts/UbuntuMono-RI.ttf', index=0, name='Ubuntu Mono', style='italic', variant='normal', weight=400, stretch='normal', size='scalable')) = 11.05
2026-07-21 14:55:57 runnervm3jd5f matplotlib.font_manager[2874] DEBUG findfont: score(FontEntry(fname='/usr/share/fonts/truetype/lato/Lato-Heavy.ttf', index=0, name='Lato', style='normal', variant='normal', weight=800, stretch='normal', size='scalable')) = 10.43
2026-07-21 14:55:57 runnervm3jd5f matplotlib.font_manager[2874] DEBUG findfont: score(FontEntry(fname='/usr/share/fonts/truetype/lato/Lato-Heavy.ttf', index=0, name='Lato Heavy', style='normal', variant='normal', weight=400, stretch='normal', size='scalable')) = 10.05
2026-07-21 14:55:57 runnervm3jd5f matplotlib.font_manager[2874] DEBUG findfont: score(FontEntry(fname='/usr/share/fonts/truetype/lato/Lato-HairlineItalic.ttf', index=0, name='Lato', style='italic', variant='normal', weight=250, stretch='normal', size='scalable')) = 11.1925
2026-07-21 14:55:57 runnervm3jd5f matplotlib.font_manager[2874] DEBUG findfont: score(FontEntry(fname='/usr/share/fonts/truetype/lato/Lato-HairlineItalic.ttf', index=0, name='Lato Hairline', style='italic', variant='normal', weight=400, stretch='normal', size='scalable')) = 11.05
2026-07-21 14:55:57 runnervm3jd5f matplotlib.font_manager[2874] DEBUG findfont: score(FontEntry(fname='/usr/share/fonts/truetype/dejavu/DejaVuSerifCondensed-Bold.ttf', index=0, name='DejaVu Serif', style='normal', variant='normal', weight=700, stretch='condensed', size='scalable')) = 10.535
2026-07-21 14:55:57 runnervm3jd5f matplotlib.font_manager[2874] DEBUG findfont: score(FontEntry(fname='/usr/share/fonts/truetype/dejavu/DejaVuSerifCondensed-Bold.ttf', index=0, name='DejaVu Serif Condensed', style='normal', variant='normal', weight=700, stretch='condensed', size='scalable')) = 10.535
2026-07-21 14:55:57 runnervm3jd5f matplotlib.font_manager[2874] DEBUG findfont: score(FontEntry(fname='/usr/share/fonts/truetype/dejavu/DejaVuSansCondensed-Oblique.ttf', index=0, name='DejaVu Sans', style='oblique', variant='normal', weight=400, stretch='condensed', size='scalable')) = 11.25
2026-07-21 14:55:57 runnervm3jd5f matplotlib.font_manager[2874] DEBUG findfont: score(FontEntry(fname='/usr/share/fonts/truetype/dejavu/DejaVuSansCondensed-Oblique.ttf', index=0, name='DejaVu Sans Condensed', style='oblique', variant='normal', weight=400, stretch='condensed', size='scalable')) = 11.25
2026-07-21 14:55:57 runnervm3jd5f matplotlib.font_manager[2874] DEBUG findfont: score(FontEntry(fname='/usr/share/fonts/truetype/lato/Lato-SemiboldItalic.ttf', index=0, name='Lato', style='italic', variant='normal', weight=600, stretch='normal', size='scalable')) = 11.24
2026-07-21 14:55:57 runnervm3jd5f matplotlib.font_manager[2874] DEBUG findfont: score(FontEntry(fname='/usr/share/fonts/truetype/lato/Lato-SemiboldItalic.ttf', index=0, name='Lato Semibold', style='italic', variant='normal', weight=400, stretch='normal', size='scalable')) = 11.05
2026-07-21 14:55:57 runnervm3jd5f matplotlib.font_manager[2874] DEBUG findfont: score(FontEntry(fname='/usr/share/fonts/truetype/lato/Lato-Semibold.ttf', index=0, name='Lato', style='normal', variant='normal', weight=600, stretch='normal', size='scalable')) = 10.24
2026-07-21 14:55:57 runnervm3jd5f matplotlib.font_manager[2874] DEBUG findfont: score(FontEntry(fname='/usr/share/fonts/truetype/lato/Lato-Semibold.ttf', index=0, name='Lato Semibold', style='normal', variant='normal', weight=400, stretch='normal', size='scalable')) = 10.05
2026-07-21 14:55:57 runnervm3jd5f matplotlib.font_manager[2874] DEBUG findfont: score(FontEntry(fname='/home/runner/micromamba/envs/trajan/fonts/Inconsolata-Bold.ttf', index=0, name='Inconsolata', style='normal', variant='normal', weight=700, stretch='normal', size='scalable')) = 10.335
2026-07-21 14:55:57 runnervm3jd5f matplotlib.font_manager[2874] DEBUG findfont: score(FontEntry(fname='/usr/share/fonts/truetype/dejavu/DejaVuSans-ExtraLight.ttf', index=0, name='DejaVu Sans', style='normal', variant='normal', weight=200, stretch='normal', size='scalable')) = 10.24
2026-07-21 14:55:57 runnervm3jd5f matplotlib.font_manager[2874] DEBUG findfont: score(FontEntry(fname='/usr/share/fonts/truetype/dejavu/DejaVuSans-ExtraLight.ttf', index=0, name='DejaVu Sans Light', style='normal', variant='normal', weight=200, stretch='normal', size='scalable')) = 10.24
2026-07-21 14:55:57 runnervm3jd5f matplotlib.font_manager[2874] DEBUG findfont: score(FontEntry(fname='/home/runner/micromamba/envs/trajan/fonts/Ubuntu-BI.ttf', index=0, name='Ubuntu', style='italic', variant='normal', weight=700, stretch='normal', size='scalable')) = 11.335
2026-07-21 14:55:57 runnervm3jd5f matplotlib.font_manager[2874] DEBUG findfont: score(FontEntry(fname='/usr/share/fonts/truetype/dejavu/DejaVuSans-BoldOblique.ttf', index=0, name='DejaVu Sans', style='oblique', variant='normal', weight=700, stretch='normal', size='scalable')) = 11.335
2026-07-21 14:55:57 runnervm3jd5f matplotlib.font_manager[2874] DEBUG findfont: score(FontEntry(fname='/home/runner/micromamba/envs/trajan/fonts/Ubuntu-RI.ttf', index=0, name='Ubuntu', style='italic', variant='normal', weight=400, stretch='normal', size='scalable')) = 11.05
2026-07-21 14:55:57 runnervm3jd5f matplotlib.font_manager[2874] DEBUG findfont: score(FontEntry(fname='/usr/share/fonts/truetype/dejavu/DejaVuSerif-Italic.ttf', index=0, name='DejaVu Serif', style='italic', variant='normal', weight=400, stretch='normal', size='scalable')) = 11.05
2026-07-21 14:55:57 runnervm3jd5f matplotlib.font_manager[2874] DEBUG findfont: score(FontEntry(fname='/home/runner/micromamba/envs/trajan/fonts/SourceCodePro-Medium.ttf', index=0, name='Source Code Pro', style='normal', variant='normal', weight=500, stretch='normal', size='scalable')) = 10.145
2026-07-21 14:55:57 runnervm3jd5f matplotlib.font_manager[2874] DEBUG findfont: score(FontEntry(fname='/home/runner/micromamba/envs/trajan/fonts/SourceCodePro-Medium.ttf', index=0, name='Source Code Pro Medium', style='normal', variant='normal', weight=400, stretch='normal', size='scalable')) = 10.05
2026-07-21 14:55:57 runnervm3jd5f matplotlib.font_manager[2874] DEBUG findfont: score(FontEntry(fname='/usr/share/fonts/truetype/lato/Lato-HeavyItalic.ttf', index=0, name='Lato', style='italic', variant='normal', weight=800, stretch='normal', size='scalable')) = 11.43
2026-07-21 14:55:57 runnervm3jd5f matplotlib.font_manager[2874] DEBUG findfont: score(FontEntry(fname='/usr/share/fonts/truetype/lato/Lato-HeavyItalic.ttf', index=0, name='Lato Heavy', style='italic', variant='normal', weight=400, stretch='normal', size='scalable')) = 11.05
2026-07-21 14:55:57 runnervm3jd5f matplotlib.font_manager[2874] DEBUG findfont: score(FontEntry(fname='/usr/share/fonts/truetype/dejavu/DejaVuSans-Oblique.ttf', index=0, name='DejaVu Sans', style='oblique', variant='normal', weight=400, stretch='normal', size='scalable')) = 11.05
2026-07-21 14:55:57 runnervm3jd5f matplotlib.font_manager[2874] DEBUG findfont: score(FontEntry(fname='/home/runner/micromamba/envs/trajan/fonts/Ubuntu-M.ttf', index=0, name='Ubuntu', style='normal', variant='normal', weight=500, stretch='normal', size='scalable')) = 10.145
2026-07-21 14:55:57 runnervm3jd5f matplotlib.font_manager[2874] DEBUG findfont: score(FontEntry(fname='/home/runner/micromamba/envs/trajan/fonts/Ubuntu-M.ttf', index=0, name='Ubuntu Light', style='normal', variant='normal', weight=700, stretch='normal', size='scalable')) = 10.335
2026-07-21 14:55:57 runnervm3jd5f matplotlib.font_manager[2874] DEBUG findfont: score(FontEntry(fname='/usr/share/fonts/truetype/liberation/LiberationMono-BoldItalic.ttf', index=0, name='Liberation Mono', style='italic', variant='normal', weight=700, stretch='normal', size='scalable')) = 11.335
2026-07-21 14:55:57 runnervm3jd5f matplotlib.font_manager[2874] DEBUG findfont: score(FontEntry(fname='/usr/share/fonts/truetype/dejavu/DejaVuSansMono.ttf', index=0, name='DejaVu Sans Mono', style='normal', variant='normal', weight=400, stretch='normal', size='scalable')) = 10.05
2026-07-21 14:55:57 runnervm3jd5f matplotlib.font_manager[2874] DEBUG findfont: score(FontEntry(fname='/usr/share/fonts/truetype/dejavu/DejaVuMathTeXGyre.ttf', index=0, name='DejaVu Math TeX Gyre', style='normal', variant='normal', weight=400, stretch='normal', size='scalable')) = 10.05
2026-07-21 14:55:57 runnervm3jd5f matplotlib.font_manager[2874] DEBUG findfont: score(FontEntry(fname='/usr/share/fonts/truetype/dejavu/DejaVuSansMono-Oblique.ttf', index=0, name='DejaVu Sans Mono', style='oblique', variant='normal', weight=400, stretch='normal', size='scalable')) = 11.05
2026-07-21 14:55:57 runnervm3jd5f matplotlib.font_manager[2874] DEBUG findfont: score(FontEntry(fname='/home/runner/micromamba/envs/trajan/fonts/Ubuntu-L.ttf', index=0, name='Ubuntu', style='normal', variant='normal', weight=300, stretch='normal', size='scalable')) = 10.145
2026-07-21 14:55:57 runnervm3jd5f matplotlib.font_manager[2874] DEBUG findfont: score(FontEntry(fname='/home/runner/micromamba/envs/trajan/fonts/Ubuntu-L.ttf', index=0, name='Ubuntu Light', style='normal', variant='normal', weight=400, stretch='normal', size='scalable')) = 10.05
2026-07-21 14:55:57 runnervm3jd5f matplotlib.font_manager[2874] DEBUG findfont: score(FontEntry(fname='/home/runner/micromamba/envs/trajan/fonts/SourceCodePro-MediumIt.ttf', index=0, name='Source Code Pro', style='italic', variant='normal', weight=500, stretch='normal', size='scalable')) = 11.145
2026-07-21 14:55:57 runnervm3jd5f matplotlib.font_manager[2874] DEBUG findfont: score(FontEntry(fname='/home/runner/micromamba/envs/trajan/fonts/SourceCodePro-MediumIt.ttf', index=0, name='Source Code Pro Medium', style='italic', variant='normal', weight=400, stretch='normal', size='scalable')) = 11.05
2026-07-21 14:55:57 runnervm3jd5f matplotlib.font_manager[2874] DEBUG findfont: score(FontEntry(fname='/home/runner/micromamba/envs/trajan/fonts/SourceCodePro-Regular.ttf', index=0, name='Source Code Pro', style='normal', variant='normal', weight=400, stretch='normal', size='scalable')) = 10.05
2026-07-21 14:55:57 runnervm3jd5f matplotlib.font_manager[2874] DEBUG findfont: score(FontEntry(fname='/home/runner/micromamba/envs/trajan/fonts/SourceCodePro-SemiboldIt.ttf', index=0, name='Source Code Pro', style='italic', variant='normal', weight=600, stretch='normal', size='scalable')) = 11.24
2026-07-21 14:55:57 runnervm3jd5f matplotlib.font_manager[2874] DEBUG findfont: score(FontEntry(fname='/home/runner/micromamba/envs/trajan/fonts/SourceCodePro-SemiboldIt.ttf', index=0, name='Source Code Pro Semibold', style='italic', variant='normal', weight=400, stretch='normal', size='scalable')) = 11.05
2026-07-21 14:55:57 runnervm3jd5f matplotlib.font_manager[2874] DEBUG findfont: score(FontEntry(fname='/usr/share/fonts/truetype/dejavu/DejaVuSerif.ttf', index=0, name='DejaVu Serif', style='normal', variant='normal', weight=400, stretch='normal', size='scalable')) = 10.05
2026-07-21 14:55:57 runnervm3jd5f matplotlib.font_manager[2874] DEBUG findfont: score(FontEntry(fname='/usr/share/fonts/truetype/dejavu/DejaVuSerif-Bold.ttf', index=0, name='DejaVu Serif', style='normal', variant='normal', weight=700, stretch='normal', size='scalable')) = 10.335
2026-07-21 14:55:57 runnervm3jd5f matplotlib.font_manager[2874] DEBUG findfont: score(FontEntry(fname='/usr/share/fonts/truetype/liberation/LiberationSerif-Italic.ttf', index=0, name='Liberation Serif', style='italic', variant='normal', weight=400, stretch='normal', size='scalable')) = 11.05
2026-07-21 14:55:57 runnervm3jd5f matplotlib.font_manager[2874] DEBUG findfont: score(FontEntry(fname='/usr/share/fonts/truetype/dejavu/DejaVuSansMono-BoldOblique.ttf', index=0, name='DejaVu Sans Mono', style='oblique', variant='normal', weight=700, stretch='normal', size='scalable')) = 11.335
2026-07-21 14:55:57 runnervm3jd5f matplotlib.font_manager[2874] DEBUG findfont: score(FontEntry(fname='/home/runner/micromamba/envs/trajan/fonts/SourceCodePro-Light.ttf', index=0, name='Source Code Pro', style='normal', variant='normal', weight=300, stretch='normal', size='scalable')) = 10.145
2026-07-21 14:55:57 runnervm3jd5f matplotlib.font_manager[2874] DEBUG findfont: score(FontEntry(fname='/home/runner/micromamba/envs/trajan/fonts/SourceCodePro-Light.ttf', index=0, name='Source Code Pro Light', style='normal', variant='normal', weight=400, stretch='normal', size='scalable')) = 10.05
2026-07-21 14:55:57 runnervm3jd5f matplotlib.font_manager[2874] DEBUG findfont: score(FontEntry(fname='/usr/share/fonts/truetype/liberation/LiberationMono-Italic.ttf', index=0, name='Liberation Mono', style='italic', variant='normal', weight=400, stretch='normal', size='scalable')) = 11.05
2026-07-21 14:55:57 runnervm3jd5f matplotlib.font_manager[2874] DEBUG findfont: Matching cmss10:style=normal:variant=normal:weight=normal:stretch=normal:size=10.0 to cmss10 ('/home/runner/micromamba/envs/trajan/lib/python3.14/site-packages/matplotlib/mpl-data/fonts/ttf/cmss10.ttf') with score of 0.050000.
2026-07-21 14:55:57 runnervm3jd5f matplotlib.font_manager[2874] DEBUG findfont: Matching cmex10:style=normal:variant=normal:weight=normal:stretch=normal:size=10.0.
2026-07-21 14:55:57 runnervm3jd5f matplotlib.font_manager[2874] DEBUG findfont: score(FontEntry(fname='/home/runner/micromamba/envs/trajan/lib/python3.14/site-packages/matplotlib/mpl-data/fonts/ttf/cmmi10.ttf', index=0, name='cmmi10', style='normal', variant='normal', weight=400, stretch='normal', size='scalable')) = 10.05
2026-07-21 14:55:57 runnervm3jd5f matplotlib.font_manager[2874] DEBUG findfont: score(FontEntry(fname='/home/runner/micromamba/envs/trajan/lib/python3.14/site-packages/matplotlib/mpl-data/fonts/ttf/DejaVuSerif-Bold.ttf', index=0, name='DejaVu Serif', style='normal', variant='normal', weight=700, stretch='normal', size='scalable')) = 10.335
2026-07-21 14:55:57 runnervm3jd5f matplotlib.font_manager[2874] DEBUG findfont: score(FontEntry(fname='/home/runner/micromamba/envs/trajan/lib/python3.14/site-packages/matplotlib/mpl-data/fonts/ttf/DejaVuSans-Oblique.ttf', index=0, name='DejaVu Sans', style='oblique', variant='normal', weight=400, stretch='normal', size='scalable')) = 11.05
2026-07-21 14:55:57 runnervm3jd5f matplotlib.font_manager[2874] DEBUG findfont: score(FontEntry(fname='/home/runner/micromamba/envs/trajan/lib/python3.14/site-packages/matplotlib/mpl-data/fonts/ttf/STIXSizThreeSymReg.ttf', index=0, name='STIXSizeThreeSym', style='normal', variant='normal', weight=400, stretch='normal', size='scalable')) = 10.05
2026-07-21 14:55:57 runnervm3jd5f matplotlib.font_manager[2874] DEBUG findfont: score(FontEntry(fname='/home/runner/micromamba/envs/trajan/lib/python3.14/site-packages/matplotlib/mpl-data/fonts/ttf/STIXNonUniBolIta.ttf', index=0, name='STIXNonUnicode', style='italic', variant='normal', weight=700, stretch='normal', size='scalable')) = 11.335
2026-07-21 14:55:57 runnervm3jd5f matplotlib.font_manager[2874] DEBUG findfont: score(FontEntry(fname='/home/runner/micromamba/envs/trajan/lib/python3.14/site-packages/matplotlib/mpl-data/fonts/ttf/DejaVuSerifDisplay.ttf', index=0, name='DejaVu Serif Display', style='normal', variant='normal', weight=400, stretch='normal', size='scalable')) = 10.05
2026-07-21 14:55:57 runnervm3jd5f matplotlib.font_manager[2874] DEBUG findfont: score(FontEntry(fname='/home/runner/micromamba/envs/trajan/lib/python3.14/site-packages/matplotlib/mpl-data/fonts/ttf/cmss10.ttf', index=0, name='cmss10', style='normal', variant='normal', weight=400, stretch='normal', size='scalable')) = 10.05
2026-07-21 14:55:57 runnervm3jd5f matplotlib.font_manager[2874] DEBUG findfont: score(FontEntry(fname='/home/runner/micromamba/envs/trajan/lib/python3.14/site-packages/matplotlib/mpl-data/fonts/ttf/STIXGeneralBolIta.ttf', index=0, name='STIXGeneral', style='italic', variant='normal', weight=700, stretch='normal', size='scalable')) = 11.335
2026-07-21 14:55:57 runnervm3jd5f matplotlib.font_manager[2874] DEBUG findfont: score(FontEntry(fname='/home/runner/micromamba/envs/trajan/lib/python3.14/site-packages/matplotlib/mpl-data/fonts/ttf/cmtt10.ttf', index=0, name='cmtt10', style='normal', variant='normal', weight=400, stretch='normal', size='scalable')) = 10.05
2026-07-21 14:55:57 runnervm3jd5f matplotlib.font_manager[2874] DEBUG findfont: score(FontEntry(fname='/home/runner/micromamba/envs/trajan/lib/python3.14/site-packages/matplotlib/mpl-data/fonts/ttf/cmsy10.ttf', index=0, name='cmsy10', style='normal', variant='normal', weight=400, stretch='normal', size='scalable')) = 10.05
2026-07-21 14:55:57 runnervm3jd5f matplotlib.font_manager[2874] DEBUG findfont: score(FontEntry(fname='/home/runner/micromamba/envs/trajan/lib/python3.14/site-packages/matplotlib/mpl-data/fonts/ttf/DejaVuSansMono-Oblique.ttf', index=0, name='DejaVu Sans Mono', style='oblique', variant='normal', weight=400, stretch='normal', size='scalable')) = 11.05
2026-07-21 14:55:57 runnervm3jd5f matplotlib.font_manager[2874] DEBUG findfont: score(FontEntry(fname='/home/runner/micromamba/envs/trajan/lib/python3.14/site-packages/matplotlib/mpl-data/fonts/ttf/STIXNonUniIta.ttf', index=0, name='STIXNonUnicode', style='italic', variant='normal', weight=400, stretch='normal', size='scalable')) = 11.05
2026-07-21 14:55:57 runnervm3jd5f matplotlib.font_manager[2874] DEBUG findfont: score(FontEntry(fname='/home/runner/micromamba/envs/trajan/lib/python3.14/site-packages/matplotlib/mpl-data/fonts/ttf/STIXGeneral.ttf', index=0, name='STIXGeneral', style='normal', variant='normal', weight=400, stretch='normal', size='scalable')) = 10.05
2026-07-21 14:55:57 runnervm3jd5f matplotlib.font_manager[2874] DEBUG findfont: score(FontEntry(fname='/home/runner/micromamba/envs/trajan/lib/python3.14/site-packages/matplotlib/mpl-data/fonts/ttf/cmti10.ttf', index=0, name='cmti10', style='normal', variant='normal', weight=400, stretch='normal', size='scalable')) = 10.05
2026-07-21 14:55:57 runnervm3jd5f matplotlib.font_manager[2874] DEBUG findfont: score(FontEntry(fname='/home/runner/micromamba/envs/trajan/lib/python3.14/site-packages/matplotlib/mpl-data/fonts/ttf/DejaVuSansMono-BoldOblique.ttf', index=0, name='DejaVu Sans Mono', style='oblique', variant='normal', weight=700, stretch='normal', size='scalable')) = 11.335
2026-07-21 14:55:57 runnervm3jd5f matplotlib.font_manager[2874] DEBUG findfont: score(FontEntry(fname='/home/runner/micromamba/envs/trajan/lib/python3.14/site-packages/matplotlib/mpl-data/fonts/ttf/DejaVuSerif.ttf', index=0, name='DejaVu Serif', style='normal', variant='normal', weight=400, stretch='normal', size='scalable')) = 10.05
2026-07-21 14:55:57 runnervm3jd5f matplotlib.font_manager[2874] DEBUG findfont: score(FontEntry(fname='/home/runner/micromamba/envs/trajan/lib/python3.14/site-packages/matplotlib/mpl-data/fonts/ttf/LastResortHE-Regular.ttf', index=0, name='Last Resort High-Efficiency', style='normal', variant='normal', weight=400, stretch='normal', size='scalable')) = 10.05
2026-07-21 14:55:57 runnervm3jd5f matplotlib.font_manager[2874] DEBUG findfont: score(FontEntry(fname='/home/runner/micromamba/envs/trajan/lib/python3.14/site-packages/matplotlib/mpl-data/fonts/ttf/cmex10.ttf', index=0, name='cmex10', style='normal', variant='normal', weight=400, stretch='normal', size='scalable')) = 0.05
2026-07-21 14:55:57 runnervm3jd5f matplotlib.font_manager[2874] DEBUG findfont: score(FontEntry(fname='/home/runner/micromamba/envs/trajan/lib/python3.14/site-packages/matplotlib/mpl-data/fonts/ttf/STIXSizFiveSymReg.ttf', index=0, name='STIXSizeFiveSym', style='normal', variant='normal', weight=400, stretch='normal', size='scalable')) = 10.05
2026-07-21 14:55:57 runnervm3jd5f matplotlib.font_manager[2874] DEBUG findfont: score(FontEntry(fname='/home/runner/micromamba/envs/trajan/lib/python3.14/site-packages/matplotlib/mpl-data/fonts/ttf/STIXNonUniBol.ttf', index=0, name='STIXNonUnicode', style='normal', variant='normal', weight=700, stretch='normal', size='scalable')) = 10.335
2026-07-21 14:55:57 runnervm3jd5f matplotlib.font_manager[2874] DEBUG findfont: score(FontEntry(fname='/home/runner/micromamba/envs/trajan/lib/python3.14/site-packages/matplotlib/mpl-data/fonts/ttf/DejaVuSansDisplay.ttf', index=0, name='DejaVu Sans Display', style='normal', variant='normal', weight=400, stretch='normal', size='scalable')) = 10.05
2026-07-21 14:55:57 runnervm3jd5f matplotlib.font_manager[2874] DEBUG findfont: score(FontEntry(fname='/home/runner/micromamba/envs/trajan/lib/python3.14/site-packages/matplotlib/mpl-data/fonts/ttf/DejaVuSansMono.ttf', index=0, name='DejaVu Sans Mono', style='normal', variant='normal', weight=400, stretch='normal', size='scalable')) = 10.05
2026-07-21 14:55:57 runnervm3jd5f matplotlib.font_manager[2874] DEBUG findfont: score(FontEntry(fname='/home/runner/micromamba/envs/trajan/lib/python3.14/site-packages/matplotlib/mpl-data/fonts/ttf/cmb10.ttf', index=0, name='cmb10', style='normal', variant='normal', weight=400, stretch='normal', size='scalable')) = 10.05
2026-07-21 14:55:57 runnervm3jd5f matplotlib.font_manager[2874] DEBUG findfont: score(FontEntry(fname='/home/runner/micromamba/envs/trajan/lib/python3.14/site-packages/matplotlib/mpl-data/fonts/ttf/STIXSizTwoSymReg.ttf', index=0, name='STIXSizeTwoSym', style='normal', variant='normal', weight=400, stretch='normal', size='scalable')) = 10.05
2026-07-21 14:55:57 runnervm3jd5f matplotlib.font_manager[2874] DEBUG findfont: score(FontEntry(fname='/home/runner/micromamba/envs/trajan/lib/python3.14/site-packages/matplotlib/mpl-data/fonts/ttf/DejaVuSans.ttf', index=0, name='DejaVu Sans', style='normal', variant='normal', weight=400, stretch='normal', size='scalable')) = 10.05
2026-07-21 14:55:57 runnervm3jd5f matplotlib.font_manager[2874] DEBUG findfont: score(FontEntry(fname='/home/runner/micromamba/envs/trajan/lib/python3.14/site-packages/matplotlib/mpl-data/fonts/ttf/STIXNonUni.ttf', index=0, name='STIXNonUnicode', style='normal', variant='normal', weight=400, stretch='normal', size='scalable')) = 10.05
2026-07-21 14:55:57 runnervm3jd5f matplotlib.font_manager[2874] DEBUG findfont: score(FontEntry(fname='/home/runner/micromamba/envs/trajan/lib/python3.14/site-packages/matplotlib/mpl-data/fonts/ttf/STIXGeneralItalic.ttf', index=0, name='STIXGeneral', style='italic', variant='normal', weight=400, stretch='normal', size='scalable')) = 11.05
2026-07-21 14:55:57 runnervm3jd5f matplotlib.font_manager[2874] DEBUG findfont: score(FontEntry(fname='/home/runner/micromamba/envs/trajan/lib/python3.14/site-packages/matplotlib/mpl-data/fonts/ttf/STIXSizOneSymBol.ttf', index=0, name='STIXSizeOneSym', style='normal', variant='normal', weight=700, stretch='normal', size='scalable')) = 10.335
2026-07-21 14:55:57 runnervm3jd5f matplotlib.font_manager[2874] DEBUG findfont: score(FontEntry(fname='/home/runner/micromamba/envs/trajan/lib/python3.14/site-packages/matplotlib/mpl-data/fonts/ttf/DejaVuSansMono-Bold.ttf', index=0, name='DejaVu Sans Mono', style='normal', variant='normal', weight=700, stretch='normal', size='scalable')) = 10.335
2026-07-21 14:55:57 runnervm3jd5f matplotlib.font_manager[2874] DEBUG findfont: score(FontEntry(fname='/home/runner/micromamba/envs/trajan/lib/python3.14/site-packages/matplotlib/mpl-data/fonts/ttf/STIXSizTwoSymBol.ttf', index=0, name='STIXSizeTwoSym', style='normal', variant='normal', weight=700, stretch='normal', size='scalable')) = 10.335
2026-07-21 14:55:57 runnervm3jd5f matplotlib.font_manager[2874] DEBUG findfont: score(FontEntry(fname='/home/runner/micromamba/envs/trajan/lib/python3.14/site-packages/matplotlib/mpl-data/fonts/ttf/STIXSizThreeSymBol.ttf', index=0, name='STIXSizeThreeSym', style='normal', variant='normal', weight=700, stretch='normal', size='scalable')) = 10.335
2026-07-21 14:55:57 runnervm3jd5f matplotlib.font_manager[2874] DEBUG findfont: score(FontEntry(fname='/home/runner/micromamba/envs/trajan/lib/python3.14/site-packages/matplotlib/mpl-data/fonts/ttf/DejaVuSerif-BoldItalic.ttf', index=0, name='DejaVu Serif', style='italic', variant='normal', weight=700, stretch='normal', size='scalable')) = 11.335
2026-07-21 14:55:57 runnervm3jd5f matplotlib.font_manager[2874] DEBUG findfont: score(FontEntry(fname='/home/runner/micromamba/envs/trajan/lib/python3.14/site-packages/matplotlib/mpl-data/fonts/ttf/DejaVuSerif-Italic.ttf', index=0, name='DejaVu Serif', style='italic', variant='normal', weight=400, stretch='normal', size='scalable')) = 11.05
2026-07-21 14:55:57 runnervm3jd5f matplotlib.font_manager[2874] DEBUG findfont: score(FontEntry(fname='/home/runner/micromamba/envs/trajan/lib/python3.14/site-packages/matplotlib/mpl-data/fonts/ttf/DejaVuSans-Bold.ttf', index=0, name='DejaVu Sans', style='normal', variant='normal', weight=700, stretch='normal', size='scalable')) = 10.335
2026-07-21 14:55:57 runnervm3jd5f matplotlib.font_manager[2874] DEBUG findfont: score(FontEntry(fname='/home/runner/micromamba/envs/trajan/lib/python3.14/site-packages/matplotlib/mpl-data/fonts/ttf/STIXSizFourSymBol.ttf', index=0, name='STIXSizeFourSym', style='normal', variant='normal', weight=700, stretch='normal', size='scalable')) = 10.335
2026-07-21 14:55:57 runnervm3jd5f matplotlib.font_manager[2874] DEBUG findfont: score(FontEntry(fname='/home/runner/micromamba/envs/trajan/lib/python3.14/site-packages/matplotlib/mpl-data/fonts/ttf/STIXSizOneSymReg.ttf', index=0, name='STIXSizeOneSym', style='normal', variant='normal', weight=400, stretch='normal', size='scalable')) = 10.05
2026-07-21 14:55:57 runnervm3jd5f matplotlib.font_manager[2874] DEBUG findfont: score(FontEntry(fname='/home/runner/micromamba/envs/trajan/lib/python3.14/site-packages/matplotlib/mpl-data/fonts/ttf/cmr10.ttf', index=0, name='cmr10', style='normal', variant='normal', weight=400, stretch='normal', size='scalable')) = 10.05
2026-07-21 14:55:57 runnervm3jd5f matplotlib.font_manager[2874] DEBUG findfont: score(FontEntry(fname='/home/runner/micromamba/envs/trajan/lib/python3.14/site-packages/matplotlib/mpl-data/fonts/ttf/STIXGeneralBol.ttf', index=0, name='STIXGeneral', style='normal', variant='normal', weight=700, stretch='normal', size='scalable')) = 10.335
2026-07-21 14:55:57 runnervm3jd5f matplotlib.font_manager[2874] DEBUG findfont: score(FontEntry(fname='/home/runner/micromamba/envs/trajan/lib/python3.14/site-packages/matplotlib/mpl-data/fonts/ttf/DejaVuSans-BoldOblique.ttf', index=0, name='DejaVu Sans', style='oblique', variant='normal', weight=700, stretch='normal', size='scalable')) = 11.335
2026-07-21 14:55:57 runnervm3jd5f matplotlib.font_manager[2874] DEBUG findfont: score(FontEntry(fname='/home/runner/micromamba/envs/trajan/lib/python3.14/site-packages/matplotlib/mpl-data/fonts/ttf/STIXSizFourSymReg.ttf', index=0, name='STIXSizeFourSym', style='normal', variant='normal', weight=400, stretch='normal', size='scalable')) = 10.05
2026-07-21 14:55:57 runnervm3jd5f matplotlib.font_manager[2874] DEBUG findfont: score(FontEntry(fname='/usr/share/fonts/truetype/lato/Lato-Black.ttf', index=0, name='Lato', style='normal', variant='normal', weight=900, stretch='normal', size='scalable')) = 10.525
2026-07-21 14:55:57 runnervm3jd5f matplotlib.font_manager[2874] DEBUG findfont: score(FontEntry(fname='/usr/share/fonts/truetype/lato/Lato-Black.ttf', index=0, name='Lato Black', style='normal', variant='normal', weight=400, stretch='normal', size='scalable')) = 10.05
2026-07-21 14:55:57 runnervm3jd5f matplotlib.font_manager[2874] DEBUG findfont: score(FontEntry(fname='/usr/share/fonts/truetype/liberation/LiberationSerif-Regular.ttf', index=0, name='Liberation Serif', style='normal', variant='normal', weight=400, stretch='normal', size='scalable')) = 10.05
2026-07-21 14:55:57 runnervm3jd5f matplotlib.font_manager[2874] DEBUG findfont: score(FontEntry(fname='/usr/share/fonts/truetype/dejavu/DejaVuSerifCondensed.ttf', index=0, name='DejaVu Serif', style='normal', variant='normal', weight=400, stretch='condensed', size='scalable')) = 10.25
2026-07-21 14:55:57 runnervm3jd5f matplotlib.font_manager[2874] DEBUG findfont: score(FontEntry(fname='/usr/share/fonts/truetype/dejavu/DejaVuSerifCondensed.ttf', index=0, name='DejaVu Serif Condensed', style='normal', variant='normal', weight=380, stretch='condensed', size='scalable')) = 10.269
2026-07-21 14:55:57 runnervm3jd5f matplotlib.font_manager[2874] DEBUG findfont: score(FontEntry(fname='/home/runner/micromamba/envs/trajan/fonts/UbuntuMono-BI.ttf', index=0, name='Ubuntu Mono', style='italic', variant='normal', weight=700, stretch='normal', size='scalable')) = 11.335
2026-07-21 14:55:57 runnervm3jd5f matplotlib.font_manager[2874] DEBUG findfont: score(FontEntry(fname='/usr/share/fonts/truetype/dejavu/DejaVuSans.ttf', index=0, name='DejaVu Sans', style='normal', variant='normal', weight=400, stretch='normal', size='scalable')) = 10.05
2026-07-21 14:55:57 runnervm3jd5f matplotlib.font_manager[2874] DEBUG findfont: score(FontEntry(fname='/usr/share/fonts/truetype/lato/Lato-Italic.ttf', index=0, name='Lato', style='italic', variant='normal', weight=400, stretch='normal', size='scalable')) = 11.05
2026-07-21 14:55:57 runnervm3jd5f matplotlib.font_manager[2874] DEBUG findfont: score(FontEntry(fname='/usr/share/fonts/truetype/liberation/LiberationSans-Italic.ttf', index=0, name='Liberation Sans', style='italic', variant='normal', weight=400, stretch='normal', size='scalable')) = 11.05
2026-07-21 14:55:57 runnervm3jd5f matplotlib.font_manager[2874] DEBUG findfont: score(FontEntry(fname='/home/runner/micromamba/envs/trajan/fonts/Ubuntu-B.ttf', index=0, name='Ubuntu', style='normal', variant='normal', weight=700, stretch='normal', size='scalable')) = 10.335
2026-07-21 14:55:57 runnervm3jd5f matplotlib.font_manager[2874] DEBUG findfont: score(FontEntry(fname='/home/runner/micromamba/envs/trajan/fonts/SourceCodePro-Semibold.ttf', index=0, name='Source Code Pro', style='normal', variant='normal', weight=600, stretch='normal', size='scalable')) = 10.24
2026-07-21 14:55:57 runnervm3jd5f matplotlib.font_manager[2874] DEBUG findfont: score(FontEntry(fname='/home/runner/micromamba/envs/trajan/fonts/SourceCodePro-Semibold.ttf', index=0, name='Source Code Pro Semibold', style='normal', variant='normal', weight=400, stretch='normal', size='scalable')) = 10.05
2026-07-21 14:55:57 runnervm3jd5f matplotlib.font_manager[2874] DEBUG findfont: score(FontEntry(fname='/home/runner/micromamba/envs/trajan/fonts/SourceCodePro-Bold.ttf', index=0, name='Source Code Pro', style='normal', variant='normal', weight=700, stretch='normal', size='scalable')) = 10.335
2026-07-21 14:55:57 runnervm3jd5f matplotlib.font_manager[2874] DEBUG findfont: score(FontEntry(fname='/home/runner/micromamba/envs/trajan/fonts/Ubuntu-MI.ttf', index=0, name='Ubuntu', style='italic', variant='normal', weight=500, stretch='normal', size='scalable')) = 11.145
2026-07-21 14:55:57 runnervm3jd5f matplotlib.font_manager[2874] DEBUG findfont: score(FontEntry(fname='/home/runner/micromamba/envs/trajan/fonts/Ubuntu-MI.ttf', index=0, name='Ubuntu Light', style='italic', variant='normal', weight=700, stretch='normal', size='scalable')) = 11.335
2026-07-21 14:55:57 runnervm3jd5f matplotlib.font_manager[2874] DEBUG findfont: score(FontEntry(fname='/usr/share/fonts/truetype/lato/Lato-Regular.ttf', index=0, name='Lato', style='normal', variant='normal', weight=400, stretch='normal', size='scalable')) = 10.05
2026-07-21 14:55:57 runnervm3jd5f matplotlib.font_manager[2874] DEBUG findfont: score(FontEntry(fname='/usr/share/fonts/truetype/lato/Lato-ThinItalic.ttf', index=0, name='Lato', style='italic', variant='normal', weight=275, stretch='normal', size='scalable')) = 11.16875
2026-07-21 14:55:57 runnervm3jd5f matplotlib.font_manager[2874] DEBUG findfont: score(FontEntry(fname='/usr/share/fonts/truetype/lato/Lato-ThinItalic.ttf', index=0, name='Lato Thin', style='italic', variant='normal', weight=400, stretch='normal', size='scalable')) = 11.05
2026-07-21 14:55:57 runnervm3jd5f matplotlib.font_manager[2874] DEBUG findfont: score(FontEntry(fname='/usr/share/fonts/truetype/lato/Lato-BlackItalic.ttf', index=0, name='Lato', style='italic', variant='normal', weight=900, stretch='normal', size='scalable')) = 11.525
2026-07-21 14:55:57 runnervm3jd5f matplotlib.font_manager[2874] DEBUG findfont: score(FontEntry(fname='/usr/share/fonts/truetype/lato/Lato-BlackItalic.ttf', index=0, name='Lato Black', style='italic', variant='normal', weight=400, stretch='normal', size='scalable')) = 11.05
2026-07-21 14:55:57 runnervm3jd5f matplotlib.font_manager[2874] DEBUG findfont: score(FontEntry(fname='/usr/share/fonts/truetype/dejavu/DejaVuSerifCondensed-Italic.ttf', index=0, name='DejaVu Serif', style='italic', variant='normal', weight=400, stretch='condensed', size='scalable')) = 11.25
2026-07-21 14:55:57 runnervm3jd5f matplotlib.font_manager[2874] DEBUG findfont: score(FontEntry(fname='/usr/share/fonts/truetype/dejavu/DejaVuSerifCondensed-Italic.ttf', index=0, name='DejaVu Serif Condensed', style='italic', variant='normal', weight=400, stretch='condensed', size='scalable')) = 11.25
2026-07-21 14:55:57 runnervm3jd5f matplotlib.font_manager[2874] DEBUG findfont: score(FontEntry(fname='/usr/share/fonts/truetype/dejavu/DejaVuSans-Bold.ttf', index=0, name='DejaVu Sans', style='normal', variant='normal', weight=700, stretch='normal', size='scalable')) = 10.335
2026-07-21 14:55:57 runnervm3jd5f matplotlib.font_manager[2874] DEBUG findfont: score(FontEntry(fname='/home/runner/micromamba/envs/trajan/fonts/UbuntuMono-R.ttf', index=0, name='Ubuntu Mono', style='normal', variant='normal', weight=400, stretch='normal', size='scalable')) = 10.05
2026-07-21 14:55:57 runnervm3jd5f matplotlib.font_manager[2874] DEBUG findfont: score(FontEntry(fname='/usr/share/fonts/truetype/dejavu/DejaVuSerif-BoldItalic.ttf', index=0, name='DejaVu Serif', style='italic', variant='normal', weight=700, stretch='normal', size='scalable')) = 11.335
2026-07-21 14:55:57 runnervm3jd5f matplotlib.font_manager[2874] DEBUG findfont: score(FontEntry(fname='/usr/share/fonts/truetype/lato/Lato-Hairline.ttf', index=0, name='Lato', style='normal', variant='normal', weight=250, stretch='normal', size='scalable')) = 10.1925
2026-07-21 14:55:57 runnervm3jd5f matplotlib.font_manager[2874] DEBUG findfont: score(FontEntry(fname='/usr/share/fonts/truetype/lato/Lato-Hairline.ttf', index=0, name='Lato Hairline', style='normal', variant='normal', weight=400, stretch='normal', size='scalable')) = 10.05
2026-07-21 14:55:57 runnervm3jd5f matplotlib.font_manager[2874] DEBUG findfont: score(FontEntry(fname='/usr/share/fonts/truetype/lato/Lato-LightItalic.ttf', index=0, name='Lato', style='italic', variant='normal', weight=300, stretch='normal', size='scalable')) = 11.145
2026-07-21 14:55:57 runnervm3jd5f matplotlib.font_manager[2874] DEBUG findfont: score(FontEntry(fname='/usr/share/fonts/truetype/lato/Lato-LightItalic.ttf', index=0, name='Lato Light', style='italic', variant='normal', weight=400, stretch='normal', size='scalable')) = 11.05
2026-07-21 14:55:57 runnervm3jd5f matplotlib.font_manager[2874] DEBUG findfont: score(FontEntry(fname='/usr/share/fonts/truetype/dejavu/DejaVuSansCondensed-BoldOblique.ttf', index=0, name='DejaVu Sans', style='oblique', variant='normal', weight=700, stretch='condensed', size='scalable')) = 11.535
2026-07-21 14:55:57 runnervm3jd5f matplotlib.font_manager[2874] DEBUG findfont: score(FontEntry(fname='/usr/share/fonts/truetype/dejavu/DejaVuSansCondensed-BoldOblique.ttf', index=0, name='DejaVu Sans Condensed', style='oblique', variant='normal', weight=700, stretch='condensed', size='scalable')) = 11.535
2026-07-21 14:55:57 runnervm3jd5f matplotlib.font_manager[2874] DEBUG findfont: score(FontEntry(fname='/home/runner/micromamba/envs/trajan/fonts/SourceCodePro-It.ttf', index=0, name='Source Code Pro', style='italic', variant='normal', weight=400, stretch='normal', size='scalable')) = 11.05
2026-07-21 14:55:57 runnervm3jd5f matplotlib.font_manager[2874] DEBUG findfont: score(FontEntry(fname='/home/runner/micromamba/envs/trajan/fonts/SourceCodePro-ExtraLightIt.ttf', index=0, name='Source Code Pro', style='italic', variant='normal', weight=200, stretch='normal', size='scalable')) = 11.24
2026-07-21 14:55:57 runnervm3jd5f matplotlib.font_manager[2874] DEBUG findfont: score(FontEntry(fname='/home/runner/micromamba/envs/trajan/fonts/SourceCodePro-ExtraLightIt.ttf', index=0, name='Source Code Pro ExtraLight', style='italic', variant='normal', weight=400, stretch='normal', size='scalable')) = 11.05
2026-07-21 14:55:57 runnervm3jd5f matplotlib.font_manager[2874] DEBUG findfont: score(FontEntry(fname='/usr/share/fonts/truetype/lato/Lato-Medium.ttf', index=0, name='Lato', style='normal', variant='normal', weight=500, stretch='normal', size='scalable')) = 10.145
2026-07-21 14:55:57 runnervm3jd5f matplotlib.font_manager[2874] DEBUG findfont: score(FontEntry(fname='/usr/share/fonts/truetype/lato/Lato-Medium.ttf', index=0, name='Lato Medium', style='normal', variant='normal', weight=400, stretch='normal', size='scalable')) = 10.05
2026-07-21 14:55:57 runnervm3jd5f matplotlib.font_manager[2874] DEBUG findfont: score(FontEntry(fname='/usr/share/fonts/truetype/lato/Lato-BoldItalic.ttf', index=0, name='Lato', style='italic', variant='normal', weight=700, stretch='normal', size='scalable')) = 11.335
2026-07-21 14:55:57 runnervm3jd5f matplotlib.font_manager[2874] DEBUG findfont: score(FontEntry(fname='/home/runner/micromamba/envs/trajan/fonts/DejaVuSans.ttf', index=0, name='DejaVu Sans', style='normal', variant='normal', weight=400, stretch='normal', size='scalable')) = 10.05
2026-07-21 14:55:57 runnervm3jd5f matplotlib.font_manager[2874] DEBUG findfont: score(FontEntry(fname='/home/runner/micromamba/envs/trajan/fonts/UbuntuMono-B.ttf', index=0, name='Ubuntu Mono', style='normal', variant='normal', weight=700, stretch='normal', size='scalable')) = 10.335
2026-07-21 14:55:57 runnervm3jd5f matplotlib.font_manager[2874] DEBUG findfont: score(FontEntry(fname='/home/runner/micromamba/envs/trajan/fonts/SourceCodePro-LightIt.ttf', index=0, name='Source Code Pro', style='italic', variant='normal', weight=300, stretch='normal', size='scalable')) = 11.145
2026-07-21 14:55:57 runnervm3jd5f matplotlib.font_manager[2874] DEBUG findfont: score(FontEntry(fname='/home/runner/micromamba/envs/trajan/fonts/SourceCodePro-LightIt.ttf', index=0, name='Source Code Pro Light', style='italic', variant='normal', weight=400, stretch='normal', size='scalable')) = 11.05
2026-07-21 14:55:57 runnervm3jd5f matplotlib.font_manager[2874] DEBUG findfont: score(FontEntry(fname='/usr/share/fonts/truetype/liberation/LiberationSans-BoldItalic.ttf', index=0, name='Liberation Sans', style='italic', variant='normal', weight=700, stretch='normal', size='scalable')) = 11.335
2026-07-21 14:55:57 runnervm3jd5f matplotlib.font_manager[2874] DEBUG findfont: score(FontEntry(fname='/usr/share/fonts/truetype/liberation/LiberationSans-Regular.ttf', index=0, name='Liberation Sans', style='normal', variant='normal', weight=400, stretch='normal', size='scalable')) = 10.05
2026-07-21 14:55:57 runnervm3jd5f matplotlib.font_manager[2874] DEBUG findfont: score(FontEntry(fname='/usr/share/fonts/truetype/dejavu/DejaVuSansMono-Bold.ttf', index=0, name='DejaVu Sans Mono', style='normal', variant='normal', weight=700, stretch='normal', size='scalable')) = 10.335
2026-07-21 14:55:57 runnervm3jd5f matplotlib.font_manager[2874] DEBUG findfont: score(FontEntry(fname='/home/runner/micromamba/envs/trajan/fonts/SourceCodePro-BoldIt.ttf', index=0, name='Source Code Pro', style='italic', variant='normal', weight=700, stretch='normal', size='scalable')) = 11.335
2026-07-21 14:55:57 runnervm3jd5f matplotlib.font_manager[2874] DEBUG findfont: score(FontEntry(fname='/usr/share/fonts/truetype/lato/Lato-Bold.ttf', index=0, name='Lato', style='normal', variant='normal', weight=700, stretch='normal', size='scalable')) = 10.335
2026-07-21 14:55:57 runnervm3jd5f matplotlib.font_manager[2874] DEBUG findfont: score(FontEntry(fname='/usr/share/fonts/truetype/dejavu/DejaVuSansCondensed.ttf', index=0, name='DejaVu Sans', style='normal', variant='normal', weight=400, stretch='condensed', size='scalable')) = 10.25
2026-07-21 14:55:57 runnervm3jd5f matplotlib.font_manager[2874] DEBUG findfont: score(FontEntry(fname='/usr/share/fonts/truetype/dejavu/DejaVuSansCondensed.ttf', index=0, name='DejaVu Sans Condensed', style='normal', variant='normal', weight=380, stretch='condensed', size='scalable')) = 10.269
2026-07-21 14:55:57 runnervm3jd5f matplotlib.font_manager[2874] DEBUG findfont: score(FontEntry(fname='/usr/share/fonts/truetype/lato/Lato-MediumItalic.ttf', index=0, name='Lato', style='italic', variant='normal', weight=500, stretch='normal', size='scalable')) = 11.145
2026-07-21 14:55:57 runnervm3jd5f matplotlib.font_manager[2874] DEBUG findfont: score(FontEntry(fname='/usr/share/fonts/truetype/lato/Lato-MediumItalic.ttf', index=0, name='Lato Medium', style='italic', variant='normal', weight=400, stretch='normal', size='scalable')) = 11.05
2026-07-21 14:55:57 runnervm3jd5f matplotlib.font_manager[2874] DEBUG findfont: score(FontEntry(fname='/usr/share/fonts/truetype/liberation/LiberationSans-Bold.ttf', index=0, name='Liberation Sans', style='normal', variant='normal', weight=700, stretch='normal', size='scalable')) = 10.335
2026-07-21 14:55:57 runnervm3jd5f matplotlib.font_manager[2874] DEBUG findfont: score(FontEntry(fname='/usr/share/fonts/truetype/dejavu/DejaVuSerifCondensed-BoldItalic.ttf', index=0, name='DejaVu Serif', style='italic', variant='normal', weight=700, stretch='condensed', size='scalable')) = 11.535
2026-07-21 14:55:57 runnervm3jd5f matplotlib.font_manager[2874] DEBUG findfont: score(FontEntry(fname='/usr/share/fonts/truetype/dejavu/DejaVuSerifCondensed-BoldItalic.ttf', index=0, name='DejaVu Serif Condensed', style='italic', variant='normal', weight=700, stretch='condensed', size='scalable')) = 11.535
2026-07-21 14:55:57 runnervm3jd5f matplotlib.font_manager[2874] DEBUG findfont: score(FontEntry(fname='/home/runner/micromamba/envs/trajan/fonts/Ubuntu-R.ttf', index=0, name='Ubuntu', style='normal', variant='normal', weight=400, stretch='normal', size='scalable')) = 10.05
2026-07-21 14:55:57 runnervm3jd5f matplotlib.font_manager[2874] DEBUG findfont: score(FontEntry(fname='/usr/share/fonts/truetype/lato/Lato-Light.ttf', index=0, name='Lato', style='normal', variant='normal', weight=300, stretch='normal', size='scalable')) = 10.145
2026-07-21 14:55:57 runnervm3jd5f matplotlib.font_manager[2874] DEBUG findfont: score(FontEntry(fname='/usr/share/fonts/truetype/lato/Lato-Light.ttf', index=0, name='Lato Light', style='normal', variant='normal', weight=400, stretch='normal', size='scalable')) = 10.05
2026-07-21 14:55:57 runnervm3jd5f matplotlib.font_manager[2874] DEBUG findfont: score(FontEntry(fname='/usr/share/fonts/truetype/liberation/LiberationSerif-BoldItalic.ttf', index=0, name='Liberation Serif', style='italic', variant='normal', weight=700, stretch='normal', size='scalable')) = 11.335
2026-07-21 14:55:57 runnervm3jd5f matplotlib.font_manager[2874] DEBUG findfont: score(FontEntry(fname='/home/runner/micromamba/envs/trajan/fonts/Ubuntu-Th.ttf', index=0, name='Ubuntu', style='normal', variant='normal', weight=250, stretch='normal', size='scalable')) = 10.1925
2026-07-21 14:55:57 runnervm3jd5f matplotlib.font_manager[2874] DEBUG findfont: score(FontEntry(fname='/home/runner/micromamba/envs/trajan/fonts/Ubuntu-Th.ttf', index=0, name='Ubuntu Thin', style='normal', variant='normal', weight=400, stretch='normal', size='scalable')) = 10.05
2026-07-21 14:55:57 runnervm3jd5f matplotlib.font_manager[2874] DEBUG findfont: score(FontEntry(fname='/home/runner/micromamba/envs/trajan/fonts/SourceCodePro-ExtraLight.ttf', index=0, name='Source Code Pro', style='normal', variant='normal', weight=200, stretch='normal', size='scalable')) = 10.24
2026-07-21 14:55:57 runnervm3jd5f matplotlib.font_manager[2874] DEBUG findfont: score(FontEntry(fname='/home/runner/micromamba/envs/trajan/fonts/SourceCodePro-ExtraLight.ttf', index=0, name='Source Code Pro ExtraLight', style='normal', variant='normal', weight=400, stretch='normal', size='scalable')) = 10.05
2026-07-21 14:55:57 runnervm3jd5f matplotlib.font_manager[2874] DEBUG findfont: score(FontEntry(fname='/usr/share/fonts/truetype/lato/Lato-Thin.ttf', index=0, name='Lato', style='normal', variant='normal', weight=275, stretch='normal', size='scalable')) = 10.16875
2026-07-21 14:55:57 runnervm3jd5f matplotlib.font_manager[2874] DEBUG findfont: score(FontEntry(fname='/usr/share/fonts/truetype/lato/Lato-Thin.ttf', index=0, name='Lato Thin', style='normal', variant='normal', weight=400, stretch='normal', size='scalable')) = 10.05
2026-07-21 14:55:57 runnervm3jd5f matplotlib.font_manager[2874] DEBUG findfont: score(FontEntry(fname='/usr/share/fonts/truetype/liberation/LiberationSerif-Bold.ttf', index=0, name='Liberation Serif', style='normal', variant='normal', weight=700, stretch='normal', size='scalable')) = 10.335
2026-07-21 14:55:57 runnervm3jd5f matplotlib.font_manager[2874] DEBUG findfont: score(FontEntry(fname='/home/runner/micromamba/envs/trajan/fonts/Inconsolata-Regular.ttf', index=0, name='Inconsolata', style='normal', variant='normal', weight=400, stretch='normal', size='scalable')) = 10.05
2026-07-21 14:55:57 runnervm3jd5f matplotlib.font_manager[2874] DEBUG findfont: score(FontEntry(fname='/home/runner/micromamba/envs/trajan/fonts/Ubuntu-C.ttf', index=0, name='Ubuntu Condensed', style='normal', variant='normal', weight=400, stretch='condensed', size='scalable')) = 10.25
2026-07-21 14:55:57 runnervm3jd5f matplotlib.font_manager[2874] DEBUG findfont: score(FontEntry(fname='/usr/share/fonts/truetype/dejavu/DejaVuSansCondensed-Bold.ttf', index=0, name='DejaVu Sans', style='normal', variant='normal', weight=700, stretch='condensed', size='scalable')) = 10.535
2026-07-21 14:55:57 runnervm3jd5f matplotlib.font_manager[2874] DEBUG findfont: score(FontEntry(fname='/usr/share/fonts/truetype/dejavu/DejaVuSansCondensed-Bold.ttf', index=0, name='DejaVu Sans Condensed', style='normal', variant='normal', weight=700, stretch='condensed', size='scalable')) = 10.535
2026-07-21 14:55:57 runnervm3jd5f matplotlib.font_manager[2874] DEBUG findfont: score(FontEntry(fname='/usr/share/fonts/truetype/liberation/LiberationMono-Bold.ttf', index=0, name='Liberation Mono', style='normal', variant='normal', weight=700, stretch='normal', size='scalable')) = 10.335
2026-07-21 14:55:57 runnervm3jd5f matplotlib.font_manager[2874] DEBUG findfont: score(FontEntry(fname='/home/runner/micromamba/envs/trajan/fonts/SourceCodePro-Black.ttf', index=0, name='Source Code Pro', style='normal', variant='normal', weight=900, stretch='normal', size='scalable')) = 10.525
2026-07-21 14:55:57 runnervm3jd5f matplotlib.font_manager[2874] DEBUG findfont: score(FontEntry(fname='/home/runner/micromamba/envs/trajan/fonts/SourceCodePro-Black.ttf', index=0, name='Source Code Pro Black', style='normal', variant='normal', weight=400, stretch='normal', size='scalable')) = 10.05
2026-07-21 14:55:57 runnervm3jd5f matplotlib.font_manager[2874] DEBUG findfont: score(FontEntry(fname='/home/runner/micromamba/envs/trajan/fonts/SourceCodePro-BlackIt.ttf', index=0, name='Source Code Pro', style='italic', variant='normal', weight=900, stretch='normal', size='scalable')) = 11.525
2026-07-21 14:55:57 runnervm3jd5f matplotlib.font_manager[2874] DEBUG findfont: score(FontEntry(fname='/home/runner/micromamba/envs/trajan/fonts/SourceCodePro-BlackIt.ttf', index=0, name='Source Code Pro Black', style='italic', variant='normal', weight=400, stretch='normal', size='scalable')) = 11.05
2026-07-21 14:55:57 runnervm3jd5f matplotlib.font_manager[2874] DEBUG findfont: score(FontEntry(fname='/home/runner/micromamba/envs/trajan/fonts/Ubuntu-LI.ttf', index=0, name='Ubuntu', style='italic', variant='normal', weight=300, stretch='normal', size='scalable')) = 11.145
2026-07-21 14:55:57 runnervm3jd5f matplotlib.font_manager[2874] DEBUG findfont: score(FontEntry(fname='/home/runner/micromamba/envs/trajan/fonts/Ubuntu-LI.ttf', index=0, name='Ubuntu Light', style='italic', variant='normal', weight=400, stretch='normal', size='scalable')) = 11.05
2026-07-21 14:55:57 runnervm3jd5f matplotlib.font_manager[2874] DEBUG findfont: score(FontEntry(fname='/usr/share/fonts/truetype/liberation/LiberationMono-Regular.ttf', index=0, name='Liberation Mono', style='normal', variant='normal', weight=400, stretch='normal', size='scalable')) = 10.05
2026-07-21 14:55:57 runnervm3jd5f matplotlib.font_manager[2874] DEBUG findfont: score(FontEntry(fname='/home/runner/micromamba/envs/trajan/fonts/UbuntuMono-RI.ttf', index=0, name='Ubuntu Mono', style='italic', variant='normal', weight=400, stretch='normal', size='scalable')) = 11.05
2026-07-21 14:55:57 runnervm3jd5f matplotlib.font_manager[2874] DEBUG findfont: score(FontEntry(fname='/usr/share/fonts/truetype/lato/Lato-Heavy.ttf', index=0, name='Lato', style='normal', variant='normal', weight=800, stretch='normal', size='scalable')) = 10.43
2026-07-21 14:55:57 runnervm3jd5f matplotlib.font_manager[2874] DEBUG findfont: score(FontEntry(fname='/usr/share/fonts/truetype/lato/Lato-Heavy.ttf', index=0, name='Lato Heavy', style='normal', variant='normal', weight=400, stretch='normal', size='scalable')) = 10.05
2026-07-21 14:55:57 runnervm3jd5f matplotlib.font_manager[2874] DEBUG findfont: score(FontEntry(fname='/usr/share/fonts/truetype/lato/Lato-HairlineItalic.ttf', index=0, name='Lato', style='italic', variant='normal', weight=250, stretch='normal', size='scalable')) = 11.1925
2026-07-21 14:55:57 runnervm3jd5f matplotlib.font_manager[2874] DEBUG findfont: score(FontEntry(fname='/usr/share/fonts/truetype/lato/Lato-HairlineItalic.ttf', index=0, name='Lato Hairline', style='italic', variant='normal', weight=400, stretch='normal', size='scalable')) = 11.05
2026-07-21 14:55:57 runnervm3jd5f matplotlib.font_manager[2874] DEBUG findfont: score(FontEntry(fname='/usr/share/fonts/truetype/dejavu/DejaVuSerifCondensed-Bold.ttf', index=0, name='DejaVu Serif', style='normal', variant='normal', weight=700, stretch='condensed', size='scalable')) = 10.535
2026-07-21 14:55:57 runnervm3jd5f matplotlib.font_manager[2874] DEBUG findfont: score(FontEntry(fname='/usr/share/fonts/truetype/dejavu/DejaVuSerifCondensed-Bold.ttf', index=0, name='DejaVu Serif Condensed', style='normal', variant='normal', weight=700, stretch='condensed', size='scalable')) = 10.535
2026-07-21 14:55:57 runnervm3jd5f matplotlib.font_manager[2874] DEBUG findfont: score(FontEntry(fname='/usr/share/fonts/truetype/dejavu/DejaVuSansCondensed-Oblique.ttf', index=0, name='DejaVu Sans', style='oblique', variant='normal', weight=400, stretch='condensed', size='scalable')) = 11.25
2026-07-21 14:55:57 runnervm3jd5f matplotlib.font_manager[2874] DEBUG findfont: score(FontEntry(fname='/usr/share/fonts/truetype/dejavu/DejaVuSansCondensed-Oblique.ttf', index=0, name='DejaVu Sans Condensed', style='oblique', variant='normal', weight=400, stretch='condensed', size='scalable')) = 11.25
2026-07-21 14:55:57 runnervm3jd5f matplotlib.font_manager[2874] DEBUG findfont: score(FontEntry(fname='/usr/share/fonts/truetype/lato/Lato-SemiboldItalic.ttf', index=0, name='Lato', style='italic', variant='normal', weight=600, stretch='normal', size='scalable')) = 11.24
2026-07-21 14:55:57 runnervm3jd5f matplotlib.font_manager[2874] DEBUG findfont: score(FontEntry(fname='/usr/share/fonts/truetype/lato/Lato-SemiboldItalic.ttf', index=0, name='Lato Semibold', style='italic', variant='normal', weight=400, stretch='normal', size='scalable')) = 11.05
2026-07-21 14:55:57 runnervm3jd5f matplotlib.font_manager[2874] DEBUG findfont: score(FontEntry(fname='/usr/share/fonts/truetype/lato/Lato-Semibold.ttf', index=0, name='Lato', style='normal', variant='normal', weight=600, stretch='normal', size='scalable')) = 10.24
2026-07-21 14:55:57 runnervm3jd5f matplotlib.font_manager[2874] DEBUG findfont: score(FontEntry(fname='/usr/share/fonts/truetype/lato/Lato-Semibold.ttf', index=0, name='Lato Semibold', style='normal', variant='normal', weight=400, stretch='normal', size='scalable')) = 10.05
2026-07-21 14:55:57 runnervm3jd5f matplotlib.font_manager[2874] DEBUG findfont: score(FontEntry(fname='/home/runner/micromamba/envs/trajan/fonts/Inconsolata-Bold.ttf', index=0, name='Inconsolata', style='normal', variant='normal', weight=700, stretch='normal', size='scalable')) = 10.335
2026-07-21 14:55:57 runnervm3jd5f matplotlib.font_manager[2874] DEBUG findfont: score(FontEntry(fname='/usr/share/fonts/truetype/dejavu/DejaVuSans-ExtraLight.ttf', index=0, name='DejaVu Sans', style='normal', variant='normal', weight=200, stretch='normal', size='scalable')) = 10.24
2026-07-21 14:55:57 runnervm3jd5f matplotlib.font_manager[2874] DEBUG findfont: score(FontEntry(fname='/usr/share/fonts/truetype/dejavu/DejaVuSans-ExtraLight.ttf', index=0, name='DejaVu Sans Light', style='normal', variant='normal', weight=200, stretch='normal', size='scalable')) = 10.24
2026-07-21 14:55:57 runnervm3jd5f matplotlib.font_manager[2874] DEBUG findfont: score(FontEntry(fname='/home/runner/micromamba/envs/trajan/fonts/Ubuntu-BI.ttf', index=0, name='Ubuntu', style='italic', variant='normal', weight=700, stretch='normal', size='scalable')) = 11.335
2026-07-21 14:55:57 runnervm3jd5f matplotlib.font_manager[2874] DEBUG findfont: score(FontEntry(fname='/usr/share/fonts/truetype/dejavu/DejaVuSans-BoldOblique.ttf', index=0, name='DejaVu Sans', style='oblique', variant='normal', weight=700, stretch='normal', size='scalable')) = 11.335
2026-07-21 14:55:57 runnervm3jd5f matplotlib.font_manager[2874] DEBUG findfont: score(FontEntry(fname='/home/runner/micromamba/envs/trajan/fonts/Ubuntu-RI.ttf', index=0, name='Ubuntu', style='italic', variant='normal', weight=400, stretch='normal', size='scalable')) = 11.05
2026-07-21 14:55:57 runnervm3jd5f matplotlib.font_manager[2874] DEBUG findfont: score(FontEntry(fname='/usr/share/fonts/truetype/dejavu/DejaVuSerif-Italic.ttf', index=0, name='DejaVu Serif', style='italic', variant='normal', weight=400, stretch='normal', size='scalable')) = 11.05
2026-07-21 14:55:57 runnervm3jd5f matplotlib.font_manager[2874] DEBUG findfont: score(FontEntry(fname='/home/runner/micromamba/envs/trajan/fonts/SourceCodePro-Medium.ttf', index=0, name='Source Code Pro', style='normal', variant='normal', weight=500, stretch='normal', size='scalable')) = 10.145
2026-07-21 14:55:57 runnervm3jd5f matplotlib.font_manager[2874] DEBUG findfont: score(FontEntry(fname='/home/runner/micromamba/envs/trajan/fonts/SourceCodePro-Medium.ttf', index=0, name='Source Code Pro Medium', style='normal', variant='normal', weight=400, stretch='normal', size='scalable')) = 10.05
2026-07-21 14:55:57 runnervm3jd5f matplotlib.font_manager[2874] DEBUG findfont: score(FontEntry(fname='/usr/share/fonts/truetype/lato/Lato-HeavyItalic.ttf', index=0, name='Lato', style='italic', variant='normal', weight=800, stretch='normal', size='scalable')) = 11.43
2026-07-21 14:55:57 runnervm3jd5f matplotlib.font_manager[2874] DEBUG findfont: score(FontEntry(fname='/usr/share/fonts/truetype/lato/Lato-HeavyItalic.ttf', index=0, name='Lato Heavy', style='italic', variant='normal', weight=400, stretch='normal', size='scalable')) = 11.05
2026-07-21 14:55:57 runnervm3jd5f matplotlib.font_manager[2874] DEBUG findfont: score(FontEntry(fname='/usr/share/fonts/truetype/dejavu/DejaVuSans-Oblique.ttf', index=0, name='DejaVu Sans', style='oblique', variant='normal', weight=400, stretch='normal', size='scalable')) = 11.05
2026-07-21 14:55:57 runnervm3jd5f matplotlib.font_manager[2874] DEBUG findfont: score(FontEntry(fname='/home/runner/micromamba/envs/trajan/fonts/Ubuntu-M.ttf', index=0, name='Ubuntu', style='normal', variant='normal', weight=500, stretch='normal', size='scalable')) = 10.145
2026-07-21 14:55:57 runnervm3jd5f matplotlib.font_manager[2874] DEBUG findfont: score(FontEntry(fname='/home/runner/micromamba/envs/trajan/fonts/Ubuntu-M.ttf', index=0, name='Ubuntu Light', style='normal', variant='normal', weight=700, stretch='normal', size='scalable')) = 10.335
2026-07-21 14:55:57 runnervm3jd5f matplotlib.font_manager[2874] DEBUG findfont: score(FontEntry(fname='/usr/share/fonts/truetype/liberation/LiberationMono-BoldItalic.ttf', index=0, name='Liberation Mono', style='italic', variant='normal', weight=700, stretch='normal', size='scalable')) = 11.335
2026-07-21 14:55:57 runnervm3jd5f matplotlib.font_manager[2874] DEBUG findfont: score(FontEntry(fname='/usr/share/fonts/truetype/dejavu/DejaVuSansMono.ttf', index=0, name='DejaVu Sans Mono', style='normal', variant='normal', weight=400, stretch='normal', size='scalable')) = 10.05
2026-07-21 14:55:57 runnervm3jd5f matplotlib.font_manager[2874] DEBUG findfont: score(FontEntry(fname='/usr/share/fonts/truetype/dejavu/DejaVuMathTeXGyre.ttf', index=0, name='DejaVu Math TeX Gyre', style='normal', variant='normal', weight=400, stretch='normal', size='scalable')) = 10.05
2026-07-21 14:55:57 runnervm3jd5f matplotlib.font_manager[2874] DEBUG findfont: score(FontEntry(fname='/usr/share/fonts/truetype/dejavu/DejaVuSansMono-Oblique.ttf', index=0, name='DejaVu Sans Mono', style='oblique', variant='normal', weight=400, stretch='normal', size='scalable')) = 11.05
2026-07-21 14:55:57 runnervm3jd5f matplotlib.font_manager[2874] DEBUG findfont: score(FontEntry(fname='/home/runner/micromamba/envs/trajan/fonts/Ubuntu-L.ttf', index=0, name='Ubuntu', style='normal', variant='normal', weight=300, stretch='normal', size='scalable')) = 10.145
2026-07-21 14:55:57 runnervm3jd5f matplotlib.font_manager[2874] DEBUG findfont: score(FontEntry(fname='/home/runner/micromamba/envs/trajan/fonts/Ubuntu-L.ttf', index=0, name='Ubuntu Light', style='normal', variant='normal', weight=400, stretch='normal', size='scalable')) = 10.05
2026-07-21 14:55:57 runnervm3jd5f matplotlib.font_manager[2874] DEBUG findfont: score(FontEntry(fname='/home/runner/micromamba/envs/trajan/fonts/SourceCodePro-MediumIt.ttf', index=0, name='Source Code Pro', style='italic', variant='normal', weight=500, stretch='normal', size='scalable')) = 11.145
2026-07-21 14:55:57 runnervm3jd5f matplotlib.font_manager[2874] DEBUG findfont: score(FontEntry(fname='/home/runner/micromamba/envs/trajan/fonts/SourceCodePro-MediumIt.ttf', index=0, name='Source Code Pro Medium', style='italic', variant='normal', weight=400, stretch='normal', size='scalable')) = 11.05
2026-07-21 14:55:57 runnervm3jd5f matplotlib.font_manager[2874] DEBUG findfont: score(FontEntry(fname='/home/runner/micromamba/envs/trajan/fonts/SourceCodePro-Regular.ttf', index=0, name='Source Code Pro', style='normal', variant='normal', weight=400, stretch='normal', size='scalable')) = 10.05
2026-07-21 14:55:57 runnervm3jd5f matplotlib.font_manager[2874] DEBUG findfont: score(FontEntry(fname='/home/runner/micromamba/envs/trajan/fonts/SourceCodePro-SemiboldIt.ttf', index=0, name='Source Code Pro', style='italic', variant='normal', weight=600, stretch='normal', size='scalable')) = 11.24
2026-07-21 14:55:57 runnervm3jd5f matplotlib.font_manager[2874] DEBUG findfont: score(FontEntry(fname='/home/runner/micromamba/envs/trajan/fonts/SourceCodePro-SemiboldIt.ttf', index=0, name='Source Code Pro Semibold', style='italic', variant='normal', weight=400, stretch='normal', size='scalable')) = 11.05
2026-07-21 14:55:57 runnervm3jd5f matplotlib.font_manager[2874] DEBUG findfont: score(FontEntry(fname='/usr/share/fonts/truetype/dejavu/DejaVuSerif.ttf', index=0, name='DejaVu Serif', style='normal', variant='normal', weight=400, stretch='normal', size='scalable')) = 10.05
2026-07-21 14:55:57 runnervm3jd5f matplotlib.font_manager[2874] DEBUG findfont: score(FontEntry(fname='/usr/share/fonts/truetype/dejavu/DejaVuSerif-Bold.ttf', index=0, name='DejaVu Serif', style='normal', variant='normal', weight=700, stretch='normal', size='scalable')) = 10.335
2026-07-21 14:55:57 runnervm3jd5f matplotlib.font_manager[2874] DEBUG findfont: score(FontEntry(fname='/usr/share/fonts/truetype/liberation/LiberationSerif-Italic.ttf', index=0, name='Liberation Serif', style='italic', variant='normal', weight=400, stretch='normal', size='scalable')) = 11.05
2026-07-21 14:55:57 runnervm3jd5f matplotlib.font_manager[2874] DEBUG findfont: score(FontEntry(fname='/usr/share/fonts/truetype/dejavu/DejaVuSansMono-BoldOblique.ttf', index=0, name='DejaVu Sans Mono', style='oblique', variant='normal', weight=700, stretch='normal', size='scalable')) = 11.335
2026-07-21 14:55:57 runnervm3jd5f matplotlib.font_manager[2874] DEBUG findfont: score(FontEntry(fname='/home/runner/micromamba/envs/trajan/fonts/SourceCodePro-Light.ttf', index=0, name='Source Code Pro', style='normal', variant='normal', weight=300, stretch='normal', size='scalable')) = 10.145
2026-07-21 14:55:57 runnervm3jd5f matplotlib.font_manager[2874] DEBUG findfont: score(FontEntry(fname='/home/runner/micromamba/envs/trajan/fonts/SourceCodePro-Light.ttf', index=0, name='Source Code Pro Light', style='normal', variant='normal', weight=400, stretch='normal', size='scalable')) = 10.05
2026-07-21 14:55:57 runnervm3jd5f matplotlib.font_manager[2874] DEBUG findfont: score(FontEntry(fname='/usr/share/fonts/truetype/liberation/LiberationMono-Italic.ttf', index=0, name='Liberation Mono', style='italic', variant='normal', weight=400, stretch='normal', size='scalable')) = 11.05
2026-07-21 14:55:57 runnervm3jd5f matplotlib.font_manager[2874] DEBUG findfont: Matching cmex10:style=normal:variant=normal:weight=normal:stretch=normal:size=10.0 to cmex10 ('/home/runner/micromamba/envs/trajan/lib/python3.14/site-packages/matplotlib/mpl-data/fonts/ttf/cmex10.ttf') with score of 0.050000.
2026-07-21 14:55:57 runnervm3jd5f matplotlib.font_manager[2874] DEBUG findfont: Matching DejaVu Sans:style=normal:variant=normal:weight=normal:stretch=normal:size=10.0.
2026-07-21 14:55:57 runnervm3jd5f matplotlib.font_manager[2874] DEBUG findfont: score(FontEntry(fname='/home/runner/micromamba/envs/trajan/lib/python3.14/site-packages/matplotlib/mpl-data/fonts/ttf/cmmi10.ttf', index=0, name='cmmi10', style='normal', variant='normal', weight=400, stretch='normal', size='scalable')) = 10.05
2026-07-21 14:55:57 runnervm3jd5f matplotlib.font_manager[2874] DEBUG findfont: score(FontEntry(fname='/home/runner/micromamba/envs/trajan/lib/python3.14/site-packages/matplotlib/mpl-data/fonts/ttf/DejaVuSerif-Bold.ttf', index=0, name='DejaVu Serif', style='normal', variant='normal', weight=700, stretch='normal', size='scalable')) = 10.335
2026-07-21 14:55:57 runnervm3jd5f matplotlib.font_manager[2874] DEBUG findfont: score(FontEntry(fname='/home/runner/micromamba/envs/trajan/lib/python3.14/site-packages/matplotlib/mpl-data/fonts/ttf/DejaVuSans-Oblique.ttf', index=0, name='DejaVu Sans', style='oblique', variant='normal', weight=400, stretch='normal', size='scalable')) = 1.05
2026-07-21 14:55:57 runnervm3jd5f matplotlib.font_manager[2874] DEBUG findfont: score(FontEntry(fname='/home/runner/micromamba/envs/trajan/lib/python3.14/site-packages/matplotlib/mpl-data/fonts/ttf/STIXSizThreeSymReg.ttf', index=0, name='STIXSizeThreeSym', style='normal', variant='normal', weight=400, stretch='normal', size='scalable')) = 10.05
2026-07-21 14:55:57 runnervm3jd5f matplotlib.font_manager[2874] DEBUG findfont: score(FontEntry(fname='/home/runner/micromamba/envs/trajan/lib/python3.14/site-packages/matplotlib/mpl-data/fonts/ttf/STIXNonUniBolIta.ttf', index=0, name='STIXNonUnicode', style='italic', variant='normal', weight=700, stretch='normal', size='scalable')) = 11.335
2026-07-21 14:55:57 runnervm3jd5f matplotlib.font_manager[2874] DEBUG findfont: score(FontEntry(fname='/home/runner/micromamba/envs/trajan/lib/python3.14/site-packages/matplotlib/mpl-data/fonts/ttf/DejaVuSerifDisplay.ttf', index=0, name='DejaVu Serif Display', style='normal', variant='normal', weight=400, stretch='normal', size='scalable')) = 10.05
2026-07-21 14:55:57 runnervm3jd5f matplotlib.font_manager[2874] DEBUG findfont: score(FontEntry(fname='/home/runner/micromamba/envs/trajan/lib/python3.14/site-packages/matplotlib/mpl-data/fonts/ttf/cmss10.ttf', index=0, name='cmss10', style='normal', variant='normal', weight=400, stretch='normal', size='scalable')) = 10.05
2026-07-21 14:55:57 runnervm3jd5f matplotlib.font_manager[2874] DEBUG findfont: score(FontEntry(fname='/home/runner/micromamba/envs/trajan/lib/python3.14/site-packages/matplotlib/mpl-data/fonts/ttf/STIXGeneralBolIta.ttf', index=0, name='STIXGeneral', style='italic', variant='normal', weight=700, stretch='normal', size='scalable')) = 11.335
2026-07-21 14:55:57 runnervm3jd5f matplotlib.font_manager[2874] DEBUG findfont: score(FontEntry(fname='/home/runner/micromamba/envs/trajan/lib/python3.14/site-packages/matplotlib/mpl-data/fonts/ttf/cmtt10.ttf', index=0, name='cmtt10', style='normal', variant='normal', weight=400, stretch='normal', size='scalable')) = 10.05
2026-07-21 14:55:57 runnervm3jd5f matplotlib.font_manager[2874] DEBUG findfont: score(FontEntry(fname='/home/runner/micromamba/envs/trajan/lib/python3.14/site-packages/matplotlib/mpl-data/fonts/ttf/cmsy10.ttf', index=0, name='cmsy10', style='normal', variant='normal', weight=400, stretch='normal', size='scalable')) = 10.05
2026-07-21 14:55:57 runnervm3jd5f matplotlib.font_manager[2874] DEBUG findfont: score(FontEntry(fname='/home/runner/micromamba/envs/trajan/lib/python3.14/site-packages/matplotlib/mpl-data/fonts/ttf/DejaVuSansMono-Oblique.ttf', index=0, name='DejaVu Sans Mono', style='oblique', variant='normal', weight=400, stretch='normal', size='scalable')) = 11.05
2026-07-21 14:55:57 runnervm3jd5f matplotlib.font_manager[2874] DEBUG findfont: score(FontEntry(fname='/home/runner/micromamba/envs/trajan/lib/python3.14/site-packages/matplotlib/mpl-data/fonts/ttf/STIXNonUniIta.ttf', index=0, name='STIXNonUnicode', style='italic', variant='normal', weight=400, stretch='normal', size='scalable')) = 11.05
2026-07-21 14:55:57 runnervm3jd5f matplotlib.font_manager[2874] DEBUG findfont: score(FontEntry(fname='/home/runner/micromamba/envs/trajan/lib/python3.14/site-packages/matplotlib/mpl-data/fonts/ttf/STIXGeneral.ttf', index=0, name='STIXGeneral', style='normal', variant='normal', weight=400, stretch='normal', size='scalable')) = 10.05
2026-07-21 14:55:57 runnervm3jd5f matplotlib.font_manager[2874] DEBUG findfont: score(FontEntry(fname='/home/runner/micromamba/envs/trajan/lib/python3.14/site-packages/matplotlib/mpl-data/fonts/ttf/cmti10.ttf', index=0, name='cmti10', style='normal', variant='normal', weight=400, stretch='normal', size='scalable')) = 10.05
2026-07-21 14:55:57 runnervm3jd5f matplotlib.font_manager[2874] DEBUG findfont: score(FontEntry(fname='/home/runner/micromamba/envs/trajan/lib/python3.14/site-packages/matplotlib/mpl-data/fonts/ttf/DejaVuSansMono-BoldOblique.ttf', index=0, name='DejaVu Sans Mono', style='oblique', variant='normal', weight=700, stretch='normal', size='scalable')) = 11.335
2026-07-21 14:55:57 runnervm3jd5f matplotlib.font_manager[2874] DEBUG findfont: score(FontEntry(fname='/home/runner/micromamba/envs/trajan/lib/python3.14/site-packages/matplotlib/mpl-data/fonts/ttf/DejaVuSerif.ttf', index=0, name='DejaVu Serif', style='normal', variant='normal', weight=400, stretch='normal', size='scalable')) = 10.05
2026-07-21 14:55:57 runnervm3jd5f matplotlib.font_manager[2874] DEBUG findfont: score(FontEntry(fname='/home/runner/micromamba/envs/trajan/lib/python3.14/site-packages/matplotlib/mpl-data/fonts/ttf/LastResortHE-Regular.ttf', index=0, name='Last Resort High-Efficiency', style='normal', variant='normal', weight=400, stretch='normal', size='scalable')) = 10.05
2026-07-21 14:55:57 runnervm3jd5f matplotlib.font_manager[2874] DEBUG findfont: score(FontEntry(fname='/home/runner/micromamba/envs/trajan/lib/python3.14/site-packages/matplotlib/mpl-data/fonts/ttf/cmex10.ttf', index=0, name='cmex10', style='normal', variant='normal', weight=400, stretch='normal', size='scalable')) = 10.05
2026-07-21 14:55:57 runnervm3jd5f matplotlib.font_manager[2874] DEBUG findfont: score(FontEntry(fname='/home/runner/micromamba/envs/trajan/lib/python3.14/site-packages/matplotlib/mpl-data/fonts/ttf/STIXSizFiveSymReg.ttf', index=0, name='STIXSizeFiveSym', style='normal', variant='normal', weight=400, stretch='normal', size='scalable')) = 10.05
2026-07-21 14:55:57 runnervm3jd5f matplotlib.font_manager[2874] DEBUG findfont: score(FontEntry(fname='/home/runner/micromamba/envs/trajan/lib/python3.14/site-packages/matplotlib/mpl-data/fonts/ttf/STIXNonUniBol.ttf', index=0, name='STIXNonUnicode', style='normal', variant='normal', weight=700, stretch='normal', size='scalable')) = 10.335
2026-07-21 14:55:57 runnervm3jd5f matplotlib.font_manager[2874] DEBUG findfont: score(FontEntry(fname='/home/runner/micromamba/envs/trajan/lib/python3.14/site-packages/matplotlib/mpl-data/fonts/ttf/DejaVuSansDisplay.ttf', index=0, name='DejaVu Sans Display', style='normal', variant='normal', weight=400, stretch='normal', size='scalable')) = 10.05
2026-07-21 14:55:57 runnervm3jd5f matplotlib.font_manager[2874] DEBUG findfont: score(FontEntry(fname='/home/runner/micromamba/envs/trajan/lib/python3.14/site-packages/matplotlib/mpl-data/fonts/ttf/DejaVuSansMono.ttf', index=0, name='DejaVu Sans Mono', style='normal', variant='normal', weight=400, stretch='normal', size='scalable')) = 10.05
2026-07-21 14:55:57 runnervm3jd5f matplotlib.font_manager[2874] DEBUG findfont: score(FontEntry(fname='/home/runner/micromamba/envs/trajan/lib/python3.14/site-packages/matplotlib/mpl-data/fonts/ttf/cmb10.ttf', index=0, name='cmb10', style='normal', variant='normal', weight=400, stretch='normal', size='scalable')) = 10.05
2026-07-21 14:55:57 runnervm3jd5f matplotlib.font_manager[2874] DEBUG findfont: score(FontEntry(fname='/home/runner/micromamba/envs/trajan/lib/python3.14/site-packages/matplotlib/mpl-data/fonts/ttf/STIXSizTwoSymReg.ttf', index=0, name='STIXSizeTwoSym', style='normal', variant='normal', weight=400, stretch='normal', size='scalable')) = 10.05
2026-07-21 14:55:57 runnervm3jd5f matplotlib.font_manager[2874] DEBUG findfont: score(FontEntry(fname='/home/runner/micromamba/envs/trajan/lib/python3.14/site-packages/matplotlib/mpl-data/fonts/ttf/DejaVuSans.ttf', index=0, name='DejaVu Sans', style='normal', variant='normal', weight=400, stretch='normal', size='scalable')) = 0.05
2026-07-21 14:55:57 runnervm3jd5f matplotlib.font_manager[2874] DEBUG findfont: score(FontEntry(fname='/home/runner/micromamba/envs/trajan/lib/python3.14/site-packages/matplotlib/mpl-data/fonts/ttf/STIXNonUni.ttf', index=0, name='STIXNonUnicode', style='normal', variant='normal', weight=400, stretch='normal', size='scalable')) = 10.05
2026-07-21 14:55:57 runnervm3jd5f matplotlib.font_manager[2874] DEBUG findfont: score(FontEntry(fname='/home/runner/micromamba/envs/trajan/lib/python3.14/site-packages/matplotlib/mpl-data/fonts/ttf/STIXGeneralItalic.ttf', index=0, name='STIXGeneral', style='italic', variant='normal', weight=400, stretch='normal', size='scalable')) = 11.05
2026-07-21 14:55:57 runnervm3jd5f matplotlib.font_manager[2874] DEBUG findfont: score(FontEntry(fname='/home/runner/micromamba/envs/trajan/lib/python3.14/site-packages/matplotlib/mpl-data/fonts/ttf/STIXSizOneSymBol.ttf', index=0, name='STIXSizeOneSym', style='normal', variant='normal', weight=700, stretch='normal', size='scalable')) = 10.335
2026-07-21 14:55:57 runnervm3jd5f matplotlib.font_manager[2874] DEBUG findfont: score(FontEntry(fname='/home/runner/micromamba/envs/trajan/lib/python3.14/site-packages/matplotlib/mpl-data/fonts/ttf/DejaVuSansMono-Bold.ttf', index=0, name='DejaVu Sans Mono', style='normal', variant='normal', weight=700, stretch='normal', size='scalable')) = 10.335
2026-07-21 14:55:57 runnervm3jd5f matplotlib.font_manager[2874] DEBUG findfont: score(FontEntry(fname='/home/runner/micromamba/envs/trajan/lib/python3.14/site-packages/matplotlib/mpl-data/fonts/ttf/STIXSizTwoSymBol.ttf', index=0, name='STIXSizeTwoSym', style='normal', variant='normal', weight=700, stretch='normal', size='scalable')) = 10.335
2026-07-21 14:55:57 runnervm3jd5f matplotlib.font_manager[2874] DEBUG findfont: score(FontEntry(fname='/home/runner/micromamba/envs/trajan/lib/python3.14/site-packages/matplotlib/mpl-data/fonts/ttf/STIXSizThreeSymBol.ttf', index=0, name='STIXSizeThreeSym', style='normal', variant='normal', weight=700, stretch='normal', size='scalable')) = 10.335
2026-07-21 14:55:57 runnervm3jd5f matplotlib.font_manager[2874] DEBUG findfont: score(FontEntry(fname='/home/runner/micromamba/envs/trajan/lib/python3.14/site-packages/matplotlib/mpl-data/fonts/ttf/DejaVuSerif-BoldItalic.ttf', index=0, name='DejaVu Serif', style='italic', variant='normal', weight=700, stretch='normal', size='scalable')) = 11.335
2026-07-21 14:55:57 runnervm3jd5f matplotlib.font_manager[2874] DEBUG findfont: score(FontEntry(fname='/home/runner/micromamba/envs/trajan/lib/python3.14/site-packages/matplotlib/mpl-data/fonts/ttf/DejaVuSerif-Italic.ttf', index=0, name='DejaVu Serif', style='italic', variant='normal', weight=400, stretch='normal', size='scalable')) = 11.05
2026-07-21 14:55:57 runnervm3jd5f matplotlib.font_manager[2874] DEBUG findfont: score(FontEntry(fname='/home/runner/micromamba/envs/trajan/lib/python3.14/site-packages/matplotlib/mpl-data/fonts/ttf/DejaVuSans-Bold.ttf', index=0, name='DejaVu Sans', style='normal', variant='normal', weight=700, stretch='normal', size='scalable')) = 0.33499999999999996
2026-07-21 14:55:57 runnervm3jd5f matplotlib.font_manager[2874] DEBUG findfont: score(FontEntry(fname='/home/runner/micromamba/envs/trajan/lib/python3.14/site-packages/matplotlib/mpl-data/fonts/ttf/STIXSizFourSymBol.ttf', index=0, name='STIXSizeFourSym', style='normal', variant='normal', weight=700, stretch='normal', size='scalable')) = 10.335
2026-07-21 14:55:57 runnervm3jd5f matplotlib.font_manager[2874] DEBUG findfont: score(FontEntry(fname='/home/runner/micromamba/envs/trajan/lib/python3.14/site-packages/matplotlib/mpl-data/fonts/ttf/STIXSizOneSymReg.ttf', index=0, name='STIXSizeOneSym', style='normal', variant='normal', weight=400, stretch='normal', size='scalable')) = 10.05
2026-07-21 14:55:57 runnervm3jd5f matplotlib.font_manager[2874] DEBUG findfont: score(FontEntry(fname='/home/runner/micromamba/envs/trajan/lib/python3.14/site-packages/matplotlib/mpl-data/fonts/ttf/cmr10.ttf', index=0, name='cmr10', style='normal', variant='normal', weight=400, stretch='normal', size='scalable')) = 10.05
2026-07-21 14:55:57 runnervm3jd5f matplotlib.font_manager[2874] DEBUG findfont: score(FontEntry(fname='/home/runner/micromamba/envs/trajan/lib/python3.14/site-packages/matplotlib/mpl-data/fonts/ttf/STIXGeneralBol.ttf', index=0, name='STIXGeneral', style='normal', variant='normal', weight=700, stretch='normal', size='scalable')) = 10.335
2026-07-21 14:55:57 runnervm3jd5f matplotlib.font_manager[2874] DEBUG findfont: score(FontEntry(fname='/home/runner/micromamba/envs/trajan/lib/python3.14/site-packages/matplotlib/mpl-data/fonts/ttf/DejaVuSans-BoldOblique.ttf', index=0, name='DejaVu Sans', style='oblique', variant='normal', weight=700, stretch='normal', size='scalable')) = 1.335
2026-07-21 14:55:57 runnervm3jd5f matplotlib.font_manager[2874] DEBUG findfont: score(FontEntry(fname='/home/runner/micromamba/envs/trajan/lib/python3.14/site-packages/matplotlib/mpl-data/fonts/ttf/STIXSizFourSymReg.ttf', index=0, name='STIXSizeFourSym', style='normal', variant='normal', weight=400, stretch='normal', size='scalable')) = 10.05
2026-07-21 14:55:57 runnervm3jd5f matplotlib.font_manager[2874] DEBUG findfont: score(FontEntry(fname='/usr/share/fonts/truetype/lato/Lato-Black.ttf', index=0, name='Lato', style='normal', variant='normal', weight=900, stretch='normal', size='scalable')) = 10.525
2026-07-21 14:55:57 runnervm3jd5f matplotlib.font_manager[2874] DEBUG findfont: score(FontEntry(fname='/usr/share/fonts/truetype/lato/Lato-Black.ttf', index=0, name='Lato Black', style='normal', variant='normal', weight=400, stretch='normal', size='scalable')) = 10.05
2026-07-21 14:55:57 runnervm3jd5f matplotlib.font_manager[2874] DEBUG findfont: score(FontEntry(fname='/usr/share/fonts/truetype/liberation/LiberationSerif-Regular.ttf', index=0, name='Liberation Serif', style='normal', variant='normal', weight=400, stretch='normal', size='scalable')) = 10.05
2026-07-21 14:55:57 runnervm3jd5f matplotlib.font_manager[2874] DEBUG findfont: score(FontEntry(fname='/usr/share/fonts/truetype/dejavu/DejaVuSerifCondensed.ttf', index=0, name='DejaVu Serif', style='normal', variant='normal', weight=400, stretch='condensed', size='scalable')) = 10.25
2026-07-21 14:55:57 runnervm3jd5f matplotlib.font_manager[2874] DEBUG findfont: score(FontEntry(fname='/usr/share/fonts/truetype/dejavu/DejaVuSerifCondensed.ttf', index=0, name='DejaVu Serif Condensed', style='normal', variant='normal', weight=380, stretch='condensed', size='scalable')) = 10.269
2026-07-21 14:55:57 runnervm3jd5f matplotlib.font_manager[2874] DEBUG findfont: score(FontEntry(fname='/home/runner/micromamba/envs/trajan/fonts/UbuntuMono-BI.ttf', index=0, name='Ubuntu Mono', style='italic', variant='normal', weight=700, stretch='normal', size='scalable')) = 11.335
2026-07-21 14:55:57 runnervm3jd5f matplotlib.font_manager[2874] DEBUG findfont: score(FontEntry(fname='/usr/share/fonts/truetype/dejavu/DejaVuSans.ttf', index=0, name='DejaVu Sans', style='normal', variant='normal', weight=400, stretch='normal', size='scalable')) = 0.05
2026-07-21 14:55:57 runnervm3jd5f matplotlib.font_manager[2874] DEBUG findfont: score(FontEntry(fname='/usr/share/fonts/truetype/lato/Lato-Italic.ttf', index=0, name='Lato', style='italic', variant='normal', weight=400, stretch='normal', size='scalable')) = 11.05
2026-07-21 14:55:57 runnervm3jd5f matplotlib.font_manager[2874] DEBUG findfont: score(FontEntry(fname='/usr/share/fonts/truetype/liberation/LiberationSans-Italic.ttf', index=0, name='Liberation Sans', style='italic', variant='normal', weight=400, stretch='normal', size='scalable')) = 11.05
2026-07-21 14:55:57 runnervm3jd5f matplotlib.font_manager[2874] DEBUG findfont: score(FontEntry(fname='/home/runner/micromamba/envs/trajan/fonts/Ubuntu-B.ttf', index=0, name='Ubuntu', style='normal', variant='normal', weight=700, stretch='normal', size='scalable')) = 10.335
2026-07-21 14:55:57 runnervm3jd5f matplotlib.font_manager[2874] DEBUG findfont: score(FontEntry(fname='/home/runner/micromamba/envs/trajan/fonts/SourceCodePro-Semibold.ttf', index=0, name='Source Code Pro', style='normal', variant='normal', weight=600, stretch='normal', size='scalable')) = 10.24
2026-07-21 14:55:57 runnervm3jd5f matplotlib.font_manager[2874] DEBUG findfont: score(FontEntry(fname='/home/runner/micromamba/envs/trajan/fonts/SourceCodePro-Semibold.ttf', index=0, name='Source Code Pro Semibold', style='normal', variant='normal', weight=400, stretch='normal', size='scalable')) = 10.05
2026-07-21 14:55:57 runnervm3jd5f matplotlib.font_manager[2874] DEBUG findfont: score(FontEntry(fname='/home/runner/micromamba/envs/trajan/fonts/SourceCodePro-Bold.ttf', index=0, name='Source Code Pro', style='normal', variant='normal', weight=700, stretch='normal', size='scalable')) = 10.335
2026-07-21 14:55:57 runnervm3jd5f matplotlib.font_manager[2874] DEBUG findfont: score(FontEntry(fname='/home/runner/micromamba/envs/trajan/fonts/Ubuntu-MI.ttf', index=0, name='Ubuntu', style='italic', variant='normal', weight=500, stretch='normal', size='scalable')) = 11.145
2026-07-21 14:55:57 runnervm3jd5f matplotlib.font_manager[2874] DEBUG findfont: score(FontEntry(fname='/home/runner/micromamba/envs/trajan/fonts/Ubuntu-MI.ttf', index=0, name='Ubuntu Light', style='italic', variant='normal', weight=700, stretch='normal', size='scalable')) = 11.335
2026-07-21 14:55:57 runnervm3jd5f matplotlib.font_manager[2874] DEBUG findfont: score(FontEntry(fname='/usr/share/fonts/truetype/lato/Lato-Regular.ttf', index=0, name='Lato', style='normal', variant='normal', weight=400, stretch='normal', size='scalable')) = 10.05
2026-07-21 14:55:57 runnervm3jd5f matplotlib.font_manager[2874] DEBUG findfont: score(FontEntry(fname='/usr/share/fonts/truetype/lato/Lato-ThinItalic.ttf', index=0, name='Lato', style='italic', variant='normal', weight=275, stretch='normal', size='scalable')) = 11.16875
2026-07-21 14:55:57 runnervm3jd5f matplotlib.font_manager[2874] DEBUG findfont: score(FontEntry(fname='/usr/share/fonts/truetype/lato/Lato-ThinItalic.ttf', index=0, name='Lato Thin', style='italic', variant='normal', weight=400, stretch='normal', size='scalable')) = 11.05
2026-07-21 14:55:57 runnervm3jd5f matplotlib.font_manager[2874] DEBUG findfont: score(FontEntry(fname='/usr/share/fonts/truetype/lato/Lato-BlackItalic.ttf', index=0, name='Lato', style='italic', variant='normal', weight=900, stretch='normal', size='scalable')) = 11.525
2026-07-21 14:55:57 runnervm3jd5f matplotlib.font_manager[2874] DEBUG findfont: score(FontEntry(fname='/usr/share/fonts/truetype/lato/Lato-BlackItalic.ttf', index=0, name='Lato Black', style='italic', variant='normal', weight=400, stretch='normal', size='scalable')) = 11.05
2026-07-21 14:55:57 runnervm3jd5f matplotlib.font_manager[2874] DEBUG findfont: score(FontEntry(fname='/usr/share/fonts/truetype/dejavu/DejaVuSerifCondensed-Italic.ttf', index=0, name='DejaVu Serif', style='italic', variant='normal', weight=400, stretch='condensed', size='scalable')) = 11.25
2026-07-21 14:55:57 runnervm3jd5f matplotlib.font_manager[2874] DEBUG findfont: score(FontEntry(fname='/usr/share/fonts/truetype/dejavu/DejaVuSerifCondensed-Italic.ttf', index=0, name='DejaVu Serif Condensed', style='italic', variant='normal', weight=400, stretch='condensed', size='scalable')) = 11.25
2026-07-21 14:55:57 runnervm3jd5f matplotlib.font_manager[2874] DEBUG findfont: score(FontEntry(fname='/usr/share/fonts/truetype/dejavu/DejaVuSans-Bold.ttf', index=0, name='DejaVu Sans', style='normal', variant='normal', weight=700, stretch='normal', size='scalable')) = 0.33499999999999996
2026-07-21 14:55:57 runnervm3jd5f matplotlib.font_manager[2874] DEBUG findfont: score(FontEntry(fname='/home/runner/micromamba/envs/trajan/fonts/UbuntuMono-R.ttf', index=0, name='Ubuntu Mono', style='normal', variant='normal', weight=400, stretch='normal', size='scalable')) = 10.05
2026-07-21 14:55:57 runnervm3jd5f matplotlib.font_manager[2874] DEBUG findfont: score(FontEntry(fname='/usr/share/fonts/truetype/dejavu/DejaVuSerif-BoldItalic.ttf', index=0, name='DejaVu Serif', style='italic', variant='normal', weight=700, stretch='normal', size='scalable')) = 11.335
2026-07-21 14:55:57 runnervm3jd5f matplotlib.font_manager[2874] DEBUG findfont: score(FontEntry(fname='/usr/share/fonts/truetype/lato/Lato-Hairline.ttf', index=0, name='Lato', style='normal', variant='normal', weight=250, stretch='normal', size='scalable')) = 10.1925
2026-07-21 14:55:57 runnervm3jd5f matplotlib.font_manager[2874] DEBUG findfont: score(FontEntry(fname='/usr/share/fonts/truetype/lato/Lato-Hairline.ttf', index=0, name='Lato Hairline', style='normal', variant='normal', weight=400, stretch='normal', size='scalable')) = 10.05
2026-07-21 14:55:57 runnervm3jd5f matplotlib.font_manager[2874] DEBUG findfont: score(FontEntry(fname='/usr/share/fonts/truetype/lato/Lato-LightItalic.ttf', index=0, name='Lato', style='italic', variant='normal', weight=300, stretch='normal', size='scalable')) = 11.145
2026-07-21 14:55:57 runnervm3jd5f matplotlib.font_manager[2874] DEBUG findfont: score(FontEntry(fname='/usr/share/fonts/truetype/lato/Lato-LightItalic.ttf', index=0, name='Lato Light', style='italic', variant='normal', weight=400, stretch='normal', size='scalable')) = 11.05
2026-07-21 14:55:57 runnervm3jd5f matplotlib.font_manager[2874] DEBUG findfont: score(FontEntry(fname='/usr/share/fonts/truetype/dejavu/DejaVuSansCondensed-BoldOblique.ttf', index=0, name='DejaVu Sans', style='oblique', variant='normal', weight=700, stretch='condensed', size='scalable')) = 1.535
2026-07-21 14:55:57 runnervm3jd5f matplotlib.font_manager[2874] DEBUG findfont: score(FontEntry(fname='/usr/share/fonts/truetype/dejavu/DejaVuSansCondensed-BoldOblique.ttf', index=0, name='DejaVu Sans Condensed', style='oblique', variant='normal', weight=700, stretch='condensed', size='scalable')) = 11.535
2026-07-21 14:55:57 runnervm3jd5f matplotlib.font_manager[2874] DEBUG findfont: score(FontEntry(fname='/home/runner/micromamba/envs/trajan/fonts/SourceCodePro-It.ttf', index=0, name='Source Code Pro', style='italic', variant='normal', weight=400, stretch='normal', size='scalable')) = 11.05
2026-07-21 14:55:57 runnervm3jd5f matplotlib.font_manager[2874] DEBUG findfont: score(FontEntry(fname='/home/runner/micromamba/envs/trajan/fonts/SourceCodePro-ExtraLightIt.ttf', index=0, name='Source Code Pro', style='italic', variant='normal', weight=200, stretch='normal', size='scalable')) = 11.24
2026-07-21 14:55:57 runnervm3jd5f matplotlib.font_manager[2874] DEBUG findfont: score(FontEntry(fname='/home/runner/micromamba/envs/trajan/fonts/SourceCodePro-ExtraLightIt.ttf', index=0, name='Source Code Pro ExtraLight', style='italic', variant='normal', weight=400, stretch='normal', size='scalable')) = 11.05
2026-07-21 14:55:57 runnervm3jd5f matplotlib.font_manager[2874] DEBUG findfont: score(FontEntry(fname='/usr/share/fonts/truetype/lato/Lato-Medium.ttf', index=0, name='Lato', style='normal', variant='normal', weight=500, stretch='normal', size='scalable')) = 10.145
2026-07-21 14:55:57 runnervm3jd5f matplotlib.font_manager[2874] DEBUG findfont: score(FontEntry(fname='/usr/share/fonts/truetype/lato/Lato-Medium.ttf', index=0, name='Lato Medium', style='normal', variant='normal', weight=400, stretch='normal', size='scalable')) = 10.05
2026-07-21 14:55:57 runnervm3jd5f matplotlib.font_manager[2874] DEBUG findfont: score(FontEntry(fname='/usr/share/fonts/truetype/lato/Lato-BoldItalic.ttf', index=0, name='Lato', style='italic', variant='normal', weight=700, stretch='normal', size='scalable')) = 11.335
2026-07-21 14:55:57 runnervm3jd5f matplotlib.font_manager[2874] DEBUG findfont: score(FontEntry(fname='/home/runner/micromamba/envs/trajan/fonts/DejaVuSans.ttf', index=0, name='DejaVu Sans', style='normal', variant='normal', weight=400, stretch='normal', size='scalable')) = 0.05
2026-07-21 14:55:57 runnervm3jd5f matplotlib.font_manager[2874] DEBUG findfont: score(FontEntry(fname='/home/runner/micromamba/envs/trajan/fonts/UbuntuMono-B.ttf', index=0, name='Ubuntu Mono', style='normal', variant='normal', weight=700, stretch='normal', size='scalable')) = 10.335
2026-07-21 14:55:57 runnervm3jd5f matplotlib.font_manager[2874] DEBUG findfont: score(FontEntry(fname='/home/runner/micromamba/envs/trajan/fonts/SourceCodePro-LightIt.ttf', index=0, name='Source Code Pro', style='italic', variant='normal', weight=300, stretch='normal', size='scalable')) = 11.145
2026-07-21 14:55:57 runnervm3jd5f matplotlib.font_manager[2874] DEBUG findfont: score(FontEntry(fname='/home/runner/micromamba/envs/trajan/fonts/SourceCodePro-LightIt.ttf', index=0, name='Source Code Pro Light', style='italic', variant='normal', weight=400, stretch='normal', size='scalable')) = 11.05
2026-07-21 14:55:57 runnervm3jd5f matplotlib.font_manager[2874] DEBUG findfont: score(FontEntry(fname='/usr/share/fonts/truetype/liberation/LiberationSans-BoldItalic.ttf', index=0, name='Liberation Sans', style='italic', variant='normal', weight=700, stretch='normal', size='scalable')) = 11.335
2026-07-21 14:55:57 runnervm3jd5f matplotlib.font_manager[2874] DEBUG findfont: score(FontEntry(fname='/usr/share/fonts/truetype/liberation/LiberationSans-Regular.ttf', index=0, name='Liberation Sans', style='normal', variant='normal', weight=400, stretch='normal', size='scalable')) = 10.05
2026-07-21 14:55:57 runnervm3jd5f matplotlib.font_manager[2874] DEBUG findfont: score(FontEntry(fname='/usr/share/fonts/truetype/dejavu/DejaVuSansMono-Bold.ttf', index=0, name='DejaVu Sans Mono', style='normal', variant='normal', weight=700, stretch='normal', size='scalable')) = 10.335
2026-07-21 14:55:57 runnervm3jd5f matplotlib.font_manager[2874] DEBUG findfont: score(FontEntry(fname='/home/runner/micromamba/envs/trajan/fonts/SourceCodePro-BoldIt.ttf', index=0, name='Source Code Pro', style='italic', variant='normal', weight=700, stretch='normal', size='scalable')) = 11.335
2026-07-21 14:55:57 runnervm3jd5f matplotlib.font_manager[2874] DEBUG findfont: score(FontEntry(fname='/usr/share/fonts/truetype/lato/Lato-Bold.ttf', index=0, name='Lato', style='normal', variant='normal', weight=700, stretch='normal', size='scalable')) = 10.335
2026-07-21 14:55:57 runnervm3jd5f matplotlib.font_manager[2874] DEBUG findfont: score(FontEntry(fname='/usr/share/fonts/truetype/dejavu/DejaVuSansCondensed.ttf', index=0, name='DejaVu Sans', style='normal', variant='normal', weight=400, stretch='condensed', size='scalable')) = 0.25
2026-07-21 14:55:57 runnervm3jd5f matplotlib.font_manager[2874] DEBUG findfont: score(FontEntry(fname='/usr/share/fonts/truetype/dejavu/DejaVuSansCondensed.ttf', index=0, name='DejaVu Sans Condensed', style='normal', variant='normal', weight=380, stretch='condensed', size='scalable')) = 10.269
2026-07-21 14:55:57 runnervm3jd5f matplotlib.font_manager[2874] DEBUG findfont: score(FontEntry(fname='/usr/share/fonts/truetype/lato/Lato-MediumItalic.ttf', index=0, name='Lato', style='italic', variant='normal', weight=500, stretch='normal', size='scalable')) = 11.145
2026-07-21 14:55:57 runnervm3jd5f matplotlib.font_manager[2874] DEBUG findfont: score(FontEntry(fname='/usr/share/fonts/truetype/lato/Lato-MediumItalic.ttf', index=0, name='Lato Medium', style='italic', variant='normal', weight=400, stretch='normal', size='scalable')) = 11.05
2026-07-21 14:55:57 runnervm3jd5f matplotlib.font_manager[2874] DEBUG findfont: score(FontEntry(fname='/usr/share/fonts/truetype/liberation/LiberationSans-Bold.ttf', index=0, name='Liberation Sans', style='normal', variant='normal', weight=700, stretch='normal', size='scalable')) = 10.335
2026-07-21 14:55:57 runnervm3jd5f matplotlib.font_manager[2874] DEBUG findfont: score(FontEntry(fname='/usr/share/fonts/truetype/dejavu/DejaVuSerifCondensed-BoldItalic.ttf', index=0, name='DejaVu Serif', style='italic', variant='normal', weight=700, stretch='condensed', size='scalable')) = 11.535
2026-07-21 14:55:57 runnervm3jd5f matplotlib.font_manager[2874] DEBUG findfont: score(FontEntry(fname='/usr/share/fonts/truetype/dejavu/DejaVuSerifCondensed-BoldItalic.ttf', index=0, name='DejaVu Serif Condensed', style='italic', variant='normal', weight=700, stretch='condensed', size='scalable')) = 11.535
2026-07-21 14:55:57 runnervm3jd5f matplotlib.font_manager[2874] DEBUG findfont: score(FontEntry(fname='/home/runner/micromamba/envs/trajan/fonts/Ubuntu-R.ttf', index=0, name='Ubuntu', style='normal', variant='normal', weight=400, stretch='normal', size='scalable')) = 10.05
2026-07-21 14:55:57 runnervm3jd5f matplotlib.font_manager[2874] DEBUG findfont: score(FontEntry(fname='/usr/share/fonts/truetype/lato/Lato-Light.ttf', index=0, name='Lato', style='normal', variant='normal', weight=300, stretch='normal', size='scalable')) = 10.145
2026-07-21 14:55:57 runnervm3jd5f matplotlib.font_manager[2874] DEBUG findfont: score(FontEntry(fname='/usr/share/fonts/truetype/lato/Lato-Light.ttf', index=0, name='Lato Light', style='normal', variant='normal', weight=400, stretch='normal', size='scalable')) = 10.05
2026-07-21 14:55:57 runnervm3jd5f matplotlib.font_manager[2874] DEBUG findfont: score(FontEntry(fname='/usr/share/fonts/truetype/liberation/LiberationSerif-BoldItalic.ttf', index=0, name='Liberation Serif', style='italic', variant='normal', weight=700, stretch='normal', size='scalable')) = 11.335
2026-07-21 14:55:57 runnervm3jd5f matplotlib.font_manager[2874] DEBUG findfont: score(FontEntry(fname='/home/runner/micromamba/envs/trajan/fonts/Ubuntu-Th.ttf', index=0, name='Ubuntu', style='normal', variant='normal', weight=250, stretch='normal', size='scalable')) = 10.1925
2026-07-21 14:55:57 runnervm3jd5f matplotlib.font_manager[2874] DEBUG findfont: score(FontEntry(fname='/home/runner/micromamba/envs/trajan/fonts/Ubuntu-Th.ttf', index=0, name='Ubuntu Thin', style='normal', variant='normal', weight=400, stretch='normal', size='scalable')) = 10.05
2026-07-21 14:55:57 runnervm3jd5f matplotlib.font_manager[2874] DEBUG findfont: score(FontEntry(fname='/home/runner/micromamba/envs/trajan/fonts/SourceCodePro-ExtraLight.ttf', index=0, name='Source Code Pro', style='normal', variant='normal', weight=200, stretch='normal', size='scalable')) = 10.24
2026-07-21 14:55:57 runnervm3jd5f matplotlib.font_manager[2874] DEBUG findfont: score(FontEntry(fname='/home/runner/micromamba/envs/trajan/fonts/SourceCodePro-ExtraLight.ttf', index=0, name='Source Code Pro ExtraLight', style='normal', variant='normal', weight=400, stretch='normal', size='scalable')) = 10.05
2026-07-21 14:55:57 runnervm3jd5f matplotlib.font_manager[2874] DEBUG findfont: score(FontEntry(fname='/usr/share/fonts/truetype/lato/Lato-Thin.ttf', index=0, name='Lato', style='normal', variant='normal', weight=275, stretch='normal', size='scalable')) = 10.16875
2026-07-21 14:55:57 runnervm3jd5f matplotlib.font_manager[2874] DEBUG findfont: score(FontEntry(fname='/usr/share/fonts/truetype/lato/Lato-Thin.ttf', index=0, name='Lato Thin', style='normal', variant='normal', weight=400, stretch='normal', size='scalable')) = 10.05
2026-07-21 14:55:57 runnervm3jd5f matplotlib.font_manager[2874] DEBUG findfont: score(FontEntry(fname='/usr/share/fonts/truetype/liberation/LiberationSerif-Bold.ttf', index=0, name='Liberation Serif', style='normal', variant='normal', weight=700, stretch='normal', size='scalable')) = 10.335
2026-07-21 14:55:57 runnervm3jd5f matplotlib.font_manager[2874] DEBUG findfont: score(FontEntry(fname='/home/runner/micromamba/envs/trajan/fonts/Inconsolata-Regular.ttf', index=0, name='Inconsolata', style='normal', variant='normal', weight=400, stretch='normal', size='scalable')) = 10.05
2026-07-21 14:55:57 runnervm3jd5f matplotlib.font_manager[2874] DEBUG findfont: score(FontEntry(fname='/home/runner/micromamba/envs/trajan/fonts/Ubuntu-C.ttf', index=0, name='Ubuntu Condensed', style='normal', variant='normal', weight=400, stretch='condensed', size='scalable')) = 10.25
2026-07-21 14:55:57 runnervm3jd5f matplotlib.font_manager[2874] DEBUG findfont: score(FontEntry(fname='/usr/share/fonts/truetype/dejavu/DejaVuSansCondensed-Bold.ttf', index=0, name='DejaVu Sans', style='normal', variant='normal', weight=700, stretch='condensed', size='scalable')) = 0.5349999999999999
2026-07-21 14:55:57 runnervm3jd5f matplotlib.font_manager[2874] DEBUG findfont: score(FontEntry(fname='/usr/share/fonts/truetype/dejavu/DejaVuSansCondensed-Bold.ttf', index=0, name='DejaVu Sans Condensed', style='normal', variant='normal', weight=700, stretch='condensed', size='scalable')) = 10.535
2026-07-21 14:55:57 runnervm3jd5f matplotlib.font_manager[2874] DEBUG findfont: score(FontEntry(fname='/usr/share/fonts/truetype/liberation/LiberationMono-Bold.ttf', index=0, name='Liberation Mono', style='normal', variant='normal', weight=700, stretch='normal', size='scalable')) = 10.335
2026-07-21 14:55:57 runnervm3jd5f matplotlib.font_manager[2874] DEBUG findfont: score(FontEntry(fname='/home/runner/micromamba/envs/trajan/fonts/SourceCodePro-Black.ttf', index=0, name='Source Code Pro', style='normal', variant='normal', weight=900, stretch='normal', size='scalable')) = 10.525
2026-07-21 14:55:57 runnervm3jd5f matplotlib.font_manager[2874] DEBUG findfont: score(FontEntry(fname='/home/runner/micromamba/envs/trajan/fonts/SourceCodePro-Black.ttf', index=0, name='Source Code Pro Black', style='normal', variant='normal', weight=400, stretch='normal', size='scalable')) = 10.05
2026-07-21 14:55:57 runnervm3jd5f matplotlib.font_manager[2874] DEBUG findfont: score(FontEntry(fname='/home/runner/micromamba/envs/trajan/fonts/SourceCodePro-BlackIt.ttf', index=0, name='Source Code Pro', style='italic', variant='normal', weight=900, stretch='normal', size='scalable')) = 11.525
2026-07-21 14:55:57 runnervm3jd5f matplotlib.font_manager[2874] DEBUG findfont: score(FontEntry(fname='/home/runner/micromamba/envs/trajan/fonts/SourceCodePro-BlackIt.ttf', index=0, name='Source Code Pro Black', style='italic', variant='normal', weight=400, stretch='normal', size='scalable')) = 11.05
2026-07-21 14:55:57 runnervm3jd5f matplotlib.font_manager[2874] DEBUG findfont: score(FontEntry(fname='/home/runner/micromamba/envs/trajan/fonts/Ubuntu-LI.ttf', index=0, name='Ubuntu', style='italic', variant='normal', weight=300, stretch='normal', size='scalable')) = 11.145
2026-07-21 14:55:57 runnervm3jd5f matplotlib.font_manager[2874] DEBUG findfont: score(FontEntry(fname='/home/runner/micromamba/envs/trajan/fonts/Ubuntu-LI.ttf', index=0, name='Ubuntu Light', style='italic', variant='normal', weight=400, stretch='normal', size='scalable')) = 11.05
2026-07-21 14:55:57 runnervm3jd5f matplotlib.font_manager[2874] DEBUG findfont: score(FontEntry(fname='/usr/share/fonts/truetype/liberation/LiberationMono-Regular.ttf', index=0, name='Liberation Mono', style='normal', variant='normal', weight=400, stretch='normal', size='scalable')) = 10.05
2026-07-21 14:55:57 runnervm3jd5f matplotlib.font_manager[2874] DEBUG findfont: score(FontEntry(fname='/home/runner/micromamba/envs/trajan/fonts/UbuntuMono-RI.ttf', index=0, name='Ubuntu Mono', style='italic', variant='normal', weight=400, stretch='normal', size='scalable')) = 11.05
2026-07-21 14:55:57 runnervm3jd5f matplotlib.font_manager[2874] DEBUG findfont: score(FontEntry(fname='/usr/share/fonts/truetype/lato/Lato-Heavy.ttf', index=0, name='Lato', style='normal', variant='normal', weight=800, stretch='normal', size='scalable')) = 10.43
2026-07-21 14:55:57 runnervm3jd5f matplotlib.font_manager[2874] DEBUG findfont: score(FontEntry(fname='/usr/share/fonts/truetype/lato/Lato-Heavy.ttf', index=0, name='Lato Heavy', style='normal', variant='normal', weight=400, stretch='normal', size='scalable')) = 10.05
2026-07-21 14:55:57 runnervm3jd5f matplotlib.font_manager[2874] DEBUG findfont: score(FontEntry(fname='/usr/share/fonts/truetype/lato/Lato-HairlineItalic.ttf', index=0, name='Lato', style='italic', variant='normal', weight=250, stretch='normal', size='scalable')) = 11.1925
2026-07-21 14:55:57 runnervm3jd5f matplotlib.font_manager[2874] DEBUG findfont: score(FontEntry(fname='/usr/share/fonts/truetype/lato/Lato-HairlineItalic.ttf', index=0, name='Lato Hairline', style='italic', variant='normal', weight=400, stretch='normal', size='scalable')) = 11.05
2026-07-21 14:55:57 runnervm3jd5f matplotlib.font_manager[2874] DEBUG findfont: score(FontEntry(fname='/usr/share/fonts/truetype/dejavu/DejaVuSerifCondensed-Bold.ttf', index=0, name='DejaVu Serif', style='normal', variant='normal', weight=700, stretch='condensed', size='scalable')) = 10.535
2026-07-21 14:55:57 runnervm3jd5f matplotlib.font_manager[2874] DEBUG findfont: score(FontEntry(fname='/usr/share/fonts/truetype/dejavu/DejaVuSerifCondensed-Bold.ttf', index=0, name='DejaVu Serif Condensed', style='normal', variant='normal', weight=700, stretch='condensed', size='scalable')) = 10.535
2026-07-21 14:55:57 runnervm3jd5f matplotlib.font_manager[2874] DEBUG findfont: score(FontEntry(fname='/usr/share/fonts/truetype/dejavu/DejaVuSansCondensed-Oblique.ttf', index=0, name='DejaVu Sans', style='oblique', variant='normal', weight=400, stretch='condensed', size='scalable')) = 1.25
2026-07-21 14:55:57 runnervm3jd5f matplotlib.font_manager[2874] DEBUG findfont: score(FontEntry(fname='/usr/share/fonts/truetype/dejavu/DejaVuSansCondensed-Oblique.ttf', index=0, name='DejaVu Sans Condensed', style='oblique', variant='normal', weight=400, stretch='condensed', size='scalable')) = 11.25
2026-07-21 14:55:57 runnervm3jd5f matplotlib.font_manager[2874] DEBUG findfont: score(FontEntry(fname='/usr/share/fonts/truetype/lato/Lato-SemiboldItalic.ttf', index=0, name='Lato', style='italic', variant='normal', weight=600, stretch='normal', size='scalable')) = 11.24
2026-07-21 14:55:57 runnervm3jd5f matplotlib.font_manager[2874] DEBUG findfont: score(FontEntry(fname='/usr/share/fonts/truetype/lato/Lato-SemiboldItalic.ttf', index=0, name='Lato Semibold', style='italic', variant='normal', weight=400, stretch='normal', size='scalable')) = 11.05
2026-07-21 14:55:57 runnervm3jd5f matplotlib.font_manager[2874] DEBUG findfont: score(FontEntry(fname='/usr/share/fonts/truetype/lato/Lato-Semibold.ttf', index=0, name='Lato', style='normal', variant='normal', weight=600, stretch='normal', size='scalable')) = 10.24
2026-07-21 14:55:57 runnervm3jd5f matplotlib.font_manager[2874] DEBUG findfont: score(FontEntry(fname='/usr/share/fonts/truetype/lato/Lato-Semibold.ttf', index=0, name='Lato Semibold', style='normal', variant='normal', weight=400, stretch='normal', size='scalable')) = 10.05
2026-07-21 14:55:57 runnervm3jd5f matplotlib.font_manager[2874] DEBUG findfont: score(FontEntry(fname='/home/runner/micromamba/envs/trajan/fonts/Inconsolata-Bold.ttf', index=0, name='Inconsolata', style='normal', variant='normal', weight=700, stretch='normal', size='scalable')) = 10.335
2026-07-21 14:55:57 runnervm3jd5f matplotlib.font_manager[2874] DEBUG findfont: score(FontEntry(fname='/usr/share/fonts/truetype/dejavu/DejaVuSans-ExtraLight.ttf', index=0, name='DejaVu Sans', style='normal', variant='normal', weight=200, stretch='normal', size='scalable')) = 0.24
2026-07-21 14:55:57 runnervm3jd5f matplotlib.font_manager[2874] DEBUG findfont: score(FontEntry(fname='/usr/share/fonts/truetype/dejavu/DejaVuSans-ExtraLight.ttf', index=0, name='DejaVu Sans Light', style='normal', variant='normal', weight=200, stretch='normal', size='scalable')) = 10.24
2026-07-21 14:55:57 runnervm3jd5f matplotlib.font_manager[2874] DEBUG findfont: score(FontEntry(fname='/home/runner/micromamba/envs/trajan/fonts/Ubuntu-BI.ttf', index=0, name='Ubuntu', style='italic', variant='normal', weight=700, stretch='normal', size='scalable')) = 11.335
2026-07-21 14:55:57 runnervm3jd5f matplotlib.font_manager[2874] DEBUG findfont: score(FontEntry(fname='/usr/share/fonts/truetype/dejavu/DejaVuSans-BoldOblique.ttf', index=0, name='DejaVu Sans', style='oblique', variant='normal', weight=700, stretch='normal', size='scalable')) = 1.335
2026-07-21 14:55:57 runnervm3jd5f matplotlib.font_manager[2874] DEBUG findfont: score(FontEntry(fname='/home/runner/micromamba/envs/trajan/fonts/Ubuntu-RI.ttf', index=0, name='Ubuntu', style='italic', variant='normal', weight=400, stretch='normal', size='scalable')) = 11.05
2026-07-21 14:55:57 runnervm3jd5f matplotlib.font_manager[2874] DEBUG findfont: score(FontEntry(fname='/usr/share/fonts/truetype/dejavu/DejaVuSerif-Italic.ttf', index=0, name='DejaVu Serif', style='italic', variant='normal', weight=400, stretch='normal', size='scalable')) = 11.05
2026-07-21 14:55:57 runnervm3jd5f matplotlib.font_manager[2874] DEBUG findfont: score(FontEntry(fname='/home/runner/micromamba/envs/trajan/fonts/SourceCodePro-Medium.ttf', index=0, name='Source Code Pro', style='normal', variant='normal', weight=500, stretch='normal', size='scalable')) = 10.145
2026-07-21 14:55:57 runnervm3jd5f matplotlib.font_manager[2874] DEBUG findfont: score(FontEntry(fname='/home/runner/micromamba/envs/trajan/fonts/SourceCodePro-Medium.ttf', index=0, name='Source Code Pro Medium', style='normal', variant='normal', weight=400, stretch='normal', size='scalable')) = 10.05
2026-07-21 14:55:57 runnervm3jd5f matplotlib.font_manager[2874] DEBUG findfont: score(FontEntry(fname='/usr/share/fonts/truetype/lato/Lato-HeavyItalic.ttf', index=0, name='Lato', style='italic', variant='normal', weight=800, stretch='normal', size='scalable')) = 11.43
2026-07-21 14:55:57 runnervm3jd5f matplotlib.font_manager[2874] DEBUG findfont: score(FontEntry(fname='/usr/share/fonts/truetype/lato/Lato-HeavyItalic.ttf', index=0, name='Lato Heavy', style='italic', variant='normal', weight=400, stretch='normal', size='scalable')) = 11.05
2026-07-21 14:55:57 runnervm3jd5f matplotlib.font_manager[2874] DEBUG findfont: score(FontEntry(fname='/usr/share/fonts/truetype/dejavu/DejaVuSans-Oblique.ttf', index=0, name='DejaVu Sans', style='oblique', variant='normal', weight=400, stretch='normal', size='scalable')) = 1.05
2026-07-21 14:55:57 runnervm3jd5f matplotlib.font_manager[2874] DEBUG findfont: score(FontEntry(fname='/home/runner/micromamba/envs/trajan/fonts/Ubuntu-M.ttf', index=0, name='Ubuntu', style='normal', variant='normal', weight=500, stretch='normal', size='scalable')) = 10.145
2026-07-21 14:55:57 runnervm3jd5f matplotlib.font_manager[2874] DEBUG findfont: score(FontEntry(fname='/home/runner/micromamba/envs/trajan/fonts/Ubuntu-M.ttf', index=0, name='Ubuntu Light', style='normal', variant='normal', weight=700, stretch='normal', size='scalable')) = 10.335
2026-07-21 14:55:57 runnervm3jd5f matplotlib.font_manager[2874] DEBUG findfont: score(FontEntry(fname='/usr/share/fonts/truetype/liberation/LiberationMono-BoldItalic.ttf', index=0, name='Liberation Mono', style='italic', variant='normal', weight=700, stretch='normal', size='scalable')) = 11.335
2026-07-21 14:55:57 runnervm3jd5f matplotlib.font_manager[2874] DEBUG findfont: score(FontEntry(fname='/usr/share/fonts/truetype/dejavu/DejaVuSansMono.ttf', index=0, name='DejaVu Sans Mono', style='normal', variant='normal', weight=400, stretch='normal', size='scalable')) = 10.05
2026-07-21 14:55:57 runnervm3jd5f matplotlib.font_manager[2874] DEBUG findfont: score(FontEntry(fname='/usr/share/fonts/truetype/dejavu/DejaVuMathTeXGyre.ttf', index=0, name='DejaVu Math TeX Gyre', style='normal', variant='normal', weight=400, stretch='normal', size='scalable')) = 10.05
2026-07-21 14:55:57 runnervm3jd5f matplotlib.font_manager[2874] DEBUG findfont: score(FontEntry(fname='/usr/share/fonts/truetype/dejavu/DejaVuSansMono-Oblique.ttf', index=0, name='DejaVu Sans Mono', style='oblique', variant='normal', weight=400, stretch='normal', size='scalable')) = 11.05
2026-07-21 14:55:57 runnervm3jd5f matplotlib.font_manager[2874] DEBUG findfont: score(FontEntry(fname='/home/runner/micromamba/envs/trajan/fonts/Ubuntu-L.ttf', index=0, name='Ubuntu', style='normal', variant='normal', weight=300, stretch='normal', size='scalable')) = 10.145
2026-07-21 14:55:57 runnervm3jd5f matplotlib.font_manager[2874] DEBUG findfont: score(FontEntry(fname='/home/runner/micromamba/envs/trajan/fonts/Ubuntu-L.ttf', index=0, name='Ubuntu Light', style='normal', variant='normal', weight=400, stretch='normal', size='scalable')) = 10.05
2026-07-21 14:55:57 runnervm3jd5f matplotlib.font_manager[2874] DEBUG findfont: score(FontEntry(fname='/home/runner/micromamba/envs/trajan/fonts/SourceCodePro-MediumIt.ttf', index=0, name='Source Code Pro', style='italic', variant='normal', weight=500, stretch='normal', size='scalable')) = 11.145
2026-07-21 14:55:57 runnervm3jd5f matplotlib.font_manager[2874] DEBUG findfont: score(FontEntry(fname='/home/runner/micromamba/envs/trajan/fonts/SourceCodePro-MediumIt.ttf', index=0, name='Source Code Pro Medium', style='italic', variant='normal', weight=400, stretch='normal', size='scalable')) = 11.05
2026-07-21 14:55:57 runnervm3jd5f matplotlib.font_manager[2874] DEBUG findfont: score(FontEntry(fname='/home/runner/micromamba/envs/trajan/fonts/SourceCodePro-Regular.ttf', index=0, name='Source Code Pro', style='normal', variant='normal', weight=400, stretch='normal', size='scalable')) = 10.05
2026-07-21 14:55:57 runnervm3jd5f matplotlib.font_manager[2874] DEBUG findfont: score(FontEntry(fname='/home/runner/micromamba/envs/trajan/fonts/SourceCodePro-SemiboldIt.ttf', index=0, name='Source Code Pro', style='italic', variant='normal', weight=600, stretch='normal', size='scalable')) = 11.24
2026-07-21 14:55:57 runnervm3jd5f matplotlib.font_manager[2874] DEBUG findfont: score(FontEntry(fname='/home/runner/micromamba/envs/trajan/fonts/SourceCodePro-SemiboldIt.ttf', index=0, name='Source Code Pro Semibold', style='italic', variant='normal', weight=400, stretch='normal', size='scalable')) = 11.05
2026-07-21 14:55:57 runnervm3jd5f matplotlib.font_manager[2874] DEBUG findfont: score(FontEntry(fname='/usr/share/fonts/truetype/dejavu/DejaVuSerif.ttf', index=0, name='DejaVu Serif', style='normal', variant='normal', weight=400, stretch='normal', size='scalable')) = 10.05
2026-07-21 14:55:57 runnervm3jd5f matplotlib.font_manager[2874] DEBUG findfont: score(FontEntry(fname='/usr/share/fonts/truetype/dejavu/DejaVuSerif-Bold.ttf', index=0, name='DejaVu Serif', style='normal', variant='normal', weight=700, stretch='normal', size='scalable')) = 10.335
2026-07-21 14:55:57 runnervm3jd5f matplotlib.font_manager[2874] DEBUG findfont: score(FontEntry(fname='/usr/share/fonts/truetype/liberation/LiberationSerif-Italic.ttf', index=0, name='Liberation Serif', style='italic', variant='normal', weight=400, stretch='normal', size='scalable')) = 11.05
2026-07-21 14:55:57 runnervm3jd5f matplotlib.font_manager[2874] DEBUG findfont: score(FontEntry(fname='/usr/share/fonts/truetype/dejavu/DejaVuSansMono-BoldOblique.ttf', index=0, name='DejaVu Sans Mono', style='oblique', variant='normal', weight=700, stretch='normal', size='scalable')) = 11.335
2026-07-21 14:55:57 runnervm3jd5f matplotlib.font_manager[2874] DEBUG findfont: score(FontEntry(fname='/home/runner/micromamba/envs/trajan/fonts/SourceCodePro-Light.ttf', index=0, name='Source Code Pro', style='normal', variant='normal', weight=300, stretch='normal', size='scalable')) = 10.145
2026-07-21 14:55:57 runnervm3jd5f matplotlib.font_manager[2874] DEBUG findfont: score(FontEntry(fname='/home/runner/micromamba/envs/trajan/fonts/SourceCodePro-Light.ttf', index=0, name='Source Code Pro Light', style='normal', variant='normal', weight=400, stretch='normal', size='scalable')) = 10.05
2026-07-21 14:55:57 runnervm3jd5f matplotlib.font_manager[2874] DEBUG findfont: score(FontEntry(fname='/usr/share/fonts/truetype/liberation/LiberationMono-Italic.ttf', index=0, name='Liberation Mono', style='italic', variant='normal', weight=400, stretch='normal', size='scalable')) = 11.05
2026-07-21 14:55:57 runnervm3jd5f matplotlib.font_manager[2874] DEBUG findfont: Matching DejaVu Sans:style=normal:variant=normal:weight=normal:stretch=normal:size=10.0 to DejaVu Sans ('/home/runner/micromamba/envs/trajan/lib/python3.14/site-packages/matplotlib/mpl-data/fonts/ttf/DejaVuSans.ttf') with score of 0.050000.
2026-07-21 14:55:57 runnervm3jd5f matplotlib.font_manager[2874] DEBUG findfont: Matching DejaVu Sans:style=italic:variant=normal:weight=normal:stretch=normal:size=10.0.
2026-07-21 14:55:57 runnervm3jd5f matplotlib.font_manager[2874] DEBUG findfont: score(FontEntry(fname='/home/runner/micromamba/envs/trajan/lib/python3.14/site-packages/matplotlib/mpl-data/fonts/ttf/cmmi10.ttf', index=0, name='cmmi10', style='normal', variant='normal', weight=400, stretch='normal', size='scalable')) = 11.05
2026-07-21 14:55:57 runnervm3jd5f matplotlib.font_manager[2874] DEBUG findfont: score(FontEntry(fname='/home/runner/micromamba/envs/trajan/lib/python3.14/site-packages/matplotlib/mpl-data/fonts/ttf/DejaVuSerif-Bold.ttf', index=0, name='DejaVu Serif', style='normal', variant='normal', weight=700, stretch='normal', size='scalable')) = 11.335
2026-07-21 14:55:57 runnervm3jd5f matplotlib.font_manager[2874] DEBUG findfont: score(FontEntry(fname='/home/runner/micromamba/envs/trajan/lib/python3.14/site-packages/matplotlib/mpl-data/fonts/ttf/DejaVuSans-Oblique.ttf', index=0, name='DejaVu Sans', style='oblique', variant='normal', weight=400, stretch='normal', size='scalable')) = 0.15000000000000002
2026-07-21 14:55:57 runnervm3jd5f matplotlib.font_manager[2874] DEBUG findfont: score(FontEntry(fname='/home/runner/micromamba/envs/trajan/lib/python3.14/site-packages/matplotlib/mpl-data/fonts/ttf/STIXSizThreeSymReg.ttf', index=0, name='STIXSizeThreeSym', style='normal', variant='normal', weight=400, stretch='normal', size='scalable')) = 11.05
2026-07-21 14:55:57 runnervm3jd5f matplotlib.font_manager[2874] DEBUG findfont: score(FontEntry(fname='/home/runner/micromamba/envs/trajan/lib/python3.14/site-packages/matplotlib/mpl-data/fonts/ttf/STIXNonUniBolIta.ttf', index=0, name='STIXNonUnicode', style='italic', variant='normal', weight=700, stretch='normal', size='scalable')) = 10.335
2026-07-21 14:55:57 runnervm3jd5f matplotlib.font_manager[2874] DEBUG findfont: score(FontEntry(fname='/home/runner/micromamba/envs/trajan/lib/python3.14/site-packages/matplotlib/mpl-data/fonts/ttf/DejaVuSerifDisplay.ttf', index=0, name='DejaVu Serif Display', style='normal', variant='normal', weight=400, stretch='normal', size='scalable')) = 11.05
2026-07-21 14:55:57 runnervm3jd5f matplotlib.font_manager[2874] DEBUG findfont: score(FontEntry(fname='/home/runner/micromamba/envs/trajan/lib/python3.14/site-packages/matplotlib/mpl-data/fonts/ttf/cmss10.ttf', index=0, name='cmss10', style='normal', variant='normal', weight=400, stretch='normal', size='scalable')) = 11.05
2026-07-21 14:55:57 runnervm3jd5f matplotlib.font_manager[2874] DEBUG findfont: score(FontEntry(fname='/home/runner/micromamba/envs/trajan/lib/python3.14/site-packages/matplotlib/mpl-data/fonts/ttf/STIXGeneralBolIta.ttf', index=0, name='STIXGeneral', style='italic', variant='normal', weight=700, stretch='normal', size='scalable')) = 10.335
2026-07-21 14:55:57 runnervm3jd5f matplotlib.font_manager[2874] DEBUG findfont: score(FontEntry(fname='/home/runner/micromamba/envs/trajan/lib/python3.14/site-packages/matplotlib/mpl-data/fonts/ttf/cmtt10.ttf', index=0, name='cmtt10', style='normal', variant='normal', weight=400, stretch='normal', size='scalable')) = 11.05
2026-07-21 14:55:57 runnervm3jd5f matplotlib.font_manager[2874] DEBUG findfont: score(FontEntry(fname='/home/runner/micromamba/envs/trajan/lib/python3.14/site-packages/matplotlib/mpl-data/fonts/ttf/cmsy10.ttf', index=0, name='cmsy10', style='normal', variant='normal', weight=400, stretch='normal', size='scalable')) = 11.05
2026-07-21 14:55:57 runnervm3jd5f matplotlib.font_manager[2874] DEBUG findfont: score(FontEntry(fname='/home/runner/micromamba/envs/trajan/lib/python3.14/site-packages/matplotlib/mpl-data/fonts/ttf/DejaVuSansMono-Oblique.ttf', index=0, name='DejaVu Sans Mono', style='oblique', variant='normal', weight=400, stretch='normal', size='scalable')) = 10.15
2026-07-21 14:55:57 runnervm3jd5f matplotlib.font_manager[2874] DEBUG findfont: score(FontEntry(fname='/home/runner/micromamba/envs/trajan/lib/python3.14/site-packages/matplotlib/mpl-data/fonts/ttf/STIXNonUniIta.ttf', index=0, name='STIXNonUnicode', style='italic', variant='normal', weight=400, stretch='normal', size='scalable')) = 10.05
2026-07-21 14:55:57 runnervm3jd5f matplotlib.font_manager[2874] DEBUG findfont: score(FontEntry(fname='/home/runner/micromamba/envs/trajan/lib/python3.14/site-packages/matplotlib/mpl-data/fonts/ttf/STIXGeneral.ttf', index=0, name='STIXGeneral', style='normal', variant='normal', weight=400, stretch='normal', size='scalable')) = 11.05
2026-07-21 14:55:57 runnervm3jd5f matplotlib.font_manager[2874] DEBUG findfont: score(FontEntry(fname='/home/runner/micromamba/envs/trajan/lib/python3.14/site-packages/matplotlib/mpl-data/fonts/ttf/cmti10.ttf', index=0, name='cmti10', style='normal', variant='normal', weight=400, stretch='normal', size='scalable')) = 11.05
2026-07-21 14:55:57 runnervm3jd5f matplotlib.font_manager[2874] DEBUG findfont: score(FontEntry(fname='/home/runner/micromamba/envs/trajan/lib/python3.14/site-packages/matplotlib/mpl-data/fonts/ttf/DejaVuSansMono-BoldOblique.ttf', index=0, name='DejaVu Sans Mono', style='oblique', variant='normal', weight=700, stretch='normal', size='scalable')) = 10.434999999999999
2026-07-21 14:55:57 runnervm3jd5f matplotlib.font_manager[2874] DEBUG findfont: score(FontEntry(fname='/home/runner/micromamba/envs/trajan/lib/python3.14/site-packages/matplotlib/mpl-data/fonts/ttf/DejaVuSerif.ttf', index=0, name='DejaVu Serif', style='normal', variant='normal', weight=400, stretch='normal', size='scalable')) = 11.05
2026-07-21 14:55:57 runnervm3jd5f matplotlib.font_manager[2874] DEBUG findfont: score(FontEntry(fname='/home/runner/micromamba/envs/trajan/lib/python3.14/site-packages/matplotlib/mpl-data/fonts/ttf/LastResortHE-Regular.ttf', index=0, name='Last Resort High-Efficiency', style='normal', variant='normal', weight=400, stretch='normal', size='scalable')) = 11.05
2026-07-21 14:55:57 runnervm3jd5f matplotlib.font_manager[2874] DEBUG findfont: score(FontEntry(fname='/home/runner/micromamba/envs/trajan/lib/python3.14/site-packages/matplotlib/mpl-data/fonts/ttf/cmex10.ttf', index=0, name='cmex10', style='normal', variant='normal', weight=400, stretch='normal', size='scalable')) = 11.05
2026-07-21 14:55:57 runnervm3jd5f matplotlib.font_manager[2874] DEBUG findfont: score(FontEntry(fname='/home/runner/micromamba/envs/trajan/lib/python3.14/site-packages/matplotlib/mpl-data/fonts/ttf/STIXSizFiveSymReg.ttf', index=0, name='STIXSizeFiveSym', style='normal', variant='normal', weight=400, stretch='normal', size='scalable')) = 11.05
2026-07-21 14:55:57 runnervm3jd5f matplotlib.font_manager[2874] DEBUG findfont: score(FontEntry(fname='/home/runner/micromamba/envs/trajan/lib/python3.14/site-packages/matplotlib/mpl-data/fonts/ttf/STIXNonUniBol.ttf', index=0, name='STIXNonUnicode', style='normal', variant='normal', weight=700, stretch='normal', size='scalable')) = 11.335
2026-07-21 14:55:57 runnervm3jd5f matplotlib.font_manager[2874] DEBUG findfont: score(FontEntry(fname='/home/runner/micromamba/envs/trajan/lib/python3.14/site-packages/matplotlib/mpl-data/fonts/ttf/DejaVuSansDisplay.ttf', index=0, name='DejaVu Sans Display', style='normal', variant='normal', weight=400, stretch='normal', size='scalable')) = 11.05
2026-07-21 14:55:57 runnervm3jd5f matplotlib.font_manager[2874] DEBUG findfont: score(FontEntry(fname='/home/runner/micromamba/envs/trajan/lib/python3.14/site-packages/matplotlib/mpl-data/fonts/ttf/DejaVuSansMono.ttf', index=0, name='DejaVu Sans Mono', style='normal', variant='normal', weight=400, stretch='normal', size='scalable')) = 11.05
2026-07-21 14:55:57 runnervm3jd5f matplotlib.font_manager[2874] DEBUG findfont: score(FontEntry(fname='/home/runner/micromamba/envs/trajan/lib/python3.14/site-packages/matplotlib/mpl-data/fonts/ttf/cmb10.ttf', index=0, name='cmb10', style='normal', variant='normal', weight=400, stretch='normal', size='scalable')) = 11.05
2026-07-21 14:55:57 runnervm3jd5f matplotlib.font_manager[2874] DEBUG findfont: score(FontEntry(fname='/home/runner/micromamba/envs/trajan/lib/python3.14/site-packages/matplotlib/mpl-data/fonts/ttf/STIXSizTwoSymReg.ttf', index=0, name='STIXSizeTwoSym', style='normal', variant='normal', weight=400, stretch='normal', size='scalable')) = 11.05
2026-07-21 14:55:57 runnervm3jd5f matplotlib.font_manager[2874] DEBUG findfont: score(FontEntry(fname='/home/runner/micromamba/envs/trajan/lib/python3.14/site-packages/matplotlib/mpl-data/fonts/ttf/DejaVuSans.ttf', index=0, name='DejaVu Sans', style='normal', variant='normal', weight=400, stretch='normal', size='scalable')) = 1.05
2026-07-21 14:55:57 runnervm3jd5f matplotlib.font_manager[2874] DEBUG findfont: score(FontEntry(fname='/home/runner/micromamba/envs/trajan/lib/python3.14/site-packages/matplotlib/mpl-data/fonts/ttf/STIXNonUni.ttf', index=0, name='STIXNonUnicode', style='normal', variant='normal', weight=400, stretch='normal', size='scalable')) = 11.05
2026-07-21 14:55:57 runnervm3jd5f matplotlib.font_manager[2874] DEBUG findfont: score(FontEntry(fname='/home/runner/micromamba/envs/trajan/lib/python3.14/site-packages/matplotlib/mpl-data/fonts/ttf/STIXGeneralItalic.ttf', index=0, name='STIXGeneral', style='italic', variant='normal', weight=400, stretch='normal', size='scalable')) = 10.05
2026-07-21 14:55:57 runnervm3jd5f matplotlib.font_manager[2874] DEBUG findfont: score(FontEntry(fname='/home/runner/micromamba/envs/trajan/lib/python3.14/site-packages/matplotlib/mpl-data/fonts/ttf/STIXSizOneSymBol.ttf', index=0, name='STIXSizeOneSym', style='normal', variant='normal', weight=700, stretch='normal', size='scalable')) = 11.335
2026-07-21 14:55:57 runnervm3jd5f matplotlib.font_manager[2874] DEBUG findfont: score(FontEntry(fname='/home/runner/micromamba/envs/trajan/lib/python3.14/site-packages/matplotlib/mpl-data/fonts/ttf/DejaVuSansMono-Bold.ttf', index=0, name='DejaVu Sans Mono', style='normal', variant='normal', weight=700, stretch='normal', size='scalable')) = 11.335
2026-07-21 14:55:57 runnervm3jd5f matplotlib.font_manager[2874] DEBUG findfont: score(FontEntry(fname='/home/runner/micromamba/envs/trajan/lib/python3.14/site-packages/matplotlib/mpl-data/fonts/ttf/STIXSizTwoSymBol.ttf', index=0, name='STIXSizeTwoSym', style='normal', variant='normal', weight=700, stretch='normal', size='scalable')) = 11.335
2026-07-21 14:55:57 runnervm3jd5f matplotlib.font_manager[2874] DEBUG findfont: score(FontEntry(fname='/home/runner/micromamba/envs/trajan/lib/python3.14/site-packages/matplotlib/mpl-data/fonts/ttf/STIXSizThreeSymBol.ttf', index=0, name='STIXSizeThreeSym', style='normal', variant='normal', weight=700, stretch='normal', size='scalable')) = 11.335
2026-07-21 14:55:57 runnervm3jd5f matplotlib.font_manager[2874] DEBUG findfont: score(FontEntry(fname='/home/runner/micromamba/envs/trajan/lib/python3.14/site-packages/matplotlib/mpl-data/fonts/ttf/DejaVuSerif-BoldItalic.ttf', index=0, name='DejaVu Serif', style='italic', variant='normal', weight=700, stretch='normal', size='scalable')) = 10.335
2026-07-21 14:55:57 runnervm3jd5f matplotlib.font_manager[2874] DEBUG findfont: score(FontEntry(fname='/home/runner/micromamba/envs/trajan/lib/python3.14/site-packages/matplotlib/mpl-data/fonts/ttf/DejaVuSerif-Italic.ttf', index=0, name='DejaVu Serif', style='italic', variant='normal', weight=400, stretch='normal', size='scalable')) = 10.05
2026-07-21 14:55:57 runnervm3jd5f matplotlib.font_manager[2874] DEBUG findfont: score(FontEntry(fname='/home/runner/micromamba/envs/trajan/lib/python3.14/site-packages/matplotlib/mpl-data/fonts/ttf/DejaVuSans-Bold.ttf', index=0, name='DejaVu Sans', style='normal', variant='normal', weight=700, stretch='normal', size='scalable')) = 1.335
2026-07-21 14:55:57 runnervm3jd5f matplotlib.font_manager[2874] DEBUG findfont: score(FontEntry(fname='/home/runner/micromamba/envs/trajan/lib/python3.14/site-packages/matplotlib/mpl-data/fonts/ttf/STIXSizFourSymBol.ttf', index=0, name='STIXSizeFourSym', style='normal', variant='normal', weight=700, stretch='normal', size='scalable')) = 11.335
2026-07-21 14:55:57 runnervm3jd5f matplotlib.font_manager[2874] DEBUG findfont: score(FontEntry(fname='/home/runner/micromamba/envs/trajan/lib/python3.14/site-packages/matplotlib/mpl-data/fonts/ttf/STIXSizOneSymReg.ttf', index=0, name='STIXSizeOneSym', style='normal', variant='normal', weight=400, stretch='normal', size='scalable')) = 11.05
2026-07-21 14:55:57 runnervm3jd5f matplotlib.font_manager[2874] DEBUG findfont: score(FontEntry(fname='/home/runner/micromamba/envs/trajan/lib/python3.14/site-packages/matplotlib/mpl-data/fonts/ttf/cmr10.ttf', index=0, name='cmr10', style='normal', variant='normal', weight=400, stretch='normal', size='scalable')) = 11.05
2026-07-21 14:55:57 runnervm3jd5f matplotlib.font_manager[2874] DEBUG findfont: score(FontEntry(fname='/home/runner/micromamba/envs/trajan/lib/python3.14/site-packages/matplotlib/mpl-data/fonts/ttf/STIXGeneralBol.ttf', index=0, name='STIXGeneral', style='normal', variant='normal', weight=700, stretch='normal', size='scalable')) = 11.335
2026-07-21 14:55:57 runnervm3jd5f matplotlib.font_manager[2874] DEBUG findfont: score(FontEntry(fname='/home/runner/micromamba/envs/trajan/lib/python3.14/site-packages/matplotlib/mpl-data/fonts/ttf/DejaVuSans-BoldOblique.ttf', index=0, name='DejaVu Sans', style='oblique', variant='normal', weight=700, stretch='normal', size='scalable')) = 0.43499999999999994
2026-07-21 14:55:57 runnervm3jd5f matplotlib.font_manager[2874] DEBUG findfont: score(FontEntry(fname='/home/runner/micromamba/envs/trajan/lib/python3.14/site-packages/matplotlib/mpl-data/fonts/ttf/STIXSizFourSymReg.ttf', index=0, name='STIXSizeFourSym', style='normal', variant='normal', weight=400, stretch='normal', size='scalable')) = 11.05
2026-07-21 14:55:57 runnervm3jd5f matplotlib.font_manager[2874] DEBUG findfont: score(FontEntry(fname='/usr/share/fonts/truetype/lato/Lato-Black.ttf', index=0, name='Lato', style='normal', variant='normal', weight=900, stretch='normal', size='scalable')) = 11.525
2026-07-21 14:55:57 runnervm3jd5f matplotlib.font_manager[2874] DEBUG findfont: score(FontEntry(fname='/usr/share/fonts/truetype/lato/Lato-Black.ttf', index=0, name='Lato Black', style='normal', variant='normal', weight=400, stretch='normal', size='scalable')) = 11.05
2026-07-21 14:55:57 runnervm3jd5f matplotlib.font_manager[2874] DEBUG findfont: score(FontEntry(fname='/usr/share/fonts/truetype/liberation/LiberationSerif-Regular.ttf', index=0, name='Liberation Serif', style='normal', variant='normal', weight=400, stretch='normal', size='scalable')) = 11.05
2026-07-21 14:55:57 runnervm3jd5f matplotlib.font_manager[2874] DEBUG findfont: score(FontEntry(fname='/usr/share/fonts/truetype/dejavu/DejaVuSerifCondensed.ttf', index=0, name='DejaVu Serif', style='normal', variant='normal', weight=400, stretch='condensed', size='scalable')) = 11.25
2026-07-21 14:55:57 runnervm3jd5f matplotlib.font_manager[2874] DEBUG findfont: score(FontEntry(fname='/usr/share/fonts/truetype/dejavu/DejaVuSerifCondensed.ttf', index=0, name='DejaVu Serif Condensed', style='normal', variant='normal', weight=380, stretch='condensed', size='scalable')) = 11.269
2026-07-21 14:55:57 runnervm3jd5f matplotlib.font_manager[2874] DEBUG findfont: score(FontEntry(fname='/home/runner/micromamba/envs/trajan/fonts/UbuntuMono-BI.ttf', index=0, name='Ubuntu Mono', style='italic', variant='normal', weight=700, stretch='normal', size='scalable')) = 10.335
2026-07-21 14:55:57 runnervm3jd5f matplotlib.font_manager[2874] DEBUG findfont: score(FontEntry(fname='/usr/share/fonts/truetype/dejavu/DejaVuSans.ttf', index=0, name='DejaVu Sans', style='normal', variant='normal', weight=400, stretch='normal', size='scalable')) = 1.05
2026-07-21 14:55:57 runnervm3jd5f matplotlib.font_manager[2874] DEBUG findfont: score(FontEntry(fname='/usr/share/fonts/truetype/lato/Lato-Italic.ttf', index=0, name='Lato', style='italic', variant='normal', weight=400, stretch='normal', size='scalable')) = 10.05
2026-07-21 14:55:57 runnervm3jd5f matplotlib.font_manager[2874] DEBUG findfont: score(FontEntry(fname='/usr/share/fonts/truetype/liberation/LiberationSans-Italic.ttf', index=0, name='Liberation Sans', style='italic', variant='normal', weight=400, stretch='normal', size='scalable')) = 10.05
2026-07-21 14:55:57 runnervm3jd5f matplotlib.font_manager[2874] DEBUG findfont: score(FontEntry(fname='/home/runner/micromamba/envs/trajan/fonts/Ubuntu-B.ttf', index=0, name='Ubuntu', style='normal', variant='normal', weight=700, stretch='normal', size='scalable')) = 11.335
2026-07-21 14:55:57 runnervm3jd5f matplotlib.font_manager[2874] DEBUG findfont: score(FontEntry(fname='/home/runner/micromamba/envs/trajan/fonts/SourceCodePro-Semibold.ttf', index=0, name='Source Code Pro', style='normal', variant='normal', weight=600, stretch='normal', size='scalable')) = 11.24
2026-07-21 14:55:57 runnervm3jd5f matplotlib.font_manager[2874] DEBUG findfont: score(FontEntry(fname='/home/runner/micromamba/envs/trajan/fonts/SourceCodePro-Semibold.ttf', index=0, name='Source Code Pro Semibold', style='normal', variant='normal', weight=400, stretch='normal', size='scalable')) = 11.05
2026-07-21 14:55:57 runnervm3jd5f matplotlib.font_manager[2874] DEBUG findfont: score(FontEntry(fname='/home/runner/micromamba/envs/trajan/fonts/SourceCodePro-Bold.ttf', index=0, name='Source Code Pro', style='normal', variant='normal', weight=700, stretch='normal', size='scalable')) = 11.335
2026-07-21 14:55:57 runnervm3jd5f matplotlib.font_manager[2874] DEBUG findfont: score(FontEntry(fname='/home/runner/micromamba/envs/trajan/fonts/Ubuntu-MI.ttf', index=0, name='Ubuntu', style='italic', variant='normal', weight=500, stretch='normal', size='scalable')) = 10.145
2026-07-21 14:55:57 runnervm3jd5f matplotlib.font_manager[2874] DEBUG findfont: score(FontEntry(fname='/home/runner/micromamba/envs/trajan/fonts/Ubuntu-MI.ttf', index=0, name='Ubuntu Light', style='italic', variant='normal', weight=700, stretch='normal', size='scalable')) = 10.335
2026-07-21 14:55:57 runnervm3jd5f matplotlib.font_manager[2874] DEBUG findfont: score(FontEntry(fname='/usr/share/fonts/truetype/lato/Lato-Regular.ttf', index=0, name='Lato', style='normal', variant='normal', weight=400, stretch='normal', size='scalable')) = 11.05
2026-07-21 14:55:57 runnervm3jd5f matplotlib.font_manager[2874] DEBUG findfont: score(FontEntry(fname='/usr/share/fonts/truetype/lato/Lato-ThinItalic.ttf', index=0, name='Lato', style='italic', variant='normal', weight=275, stretch='normal', size='scalable')) = 10.16875
2026-07-21 14:55:57 runnervm3jd5f matplotlib.font_manager[2874] DEBUG findfont: score(FontEntry(fname='/usr/share/fonts/truetype/lato/Lato-ThinItalic.ttf', index=0, name='Lato Thin', style='italic', variant='normal', weight=400, stretch='normal', size='scalable')) = 10.05
2026-07-21 14:55:57 runnervm3jd5f matplotlib.font_manager[2874] DEBUG findfont: score(FontEntry(fname='/usr/share/fonts/truetype/lato/Lato-BlackItalic.ttf', index=0, name='Lato', style='italic', variant='normal', weight=900, stretch='normal', size='scalable')) = 10.525
2026-07-21 14:55:57 runnervm3jd5f matplotlib.font_manager[2874] DEBUG findfont: score(FontEntry(fname='/usr/share/fonts/truetype/lato/Lato-BlackItalic.ttf', index=0, name='Lato Black', style='italic', variant='normal', weight=400, stretch='normal', size='scalable')) = 10.05
2026-07-21 14:55:57 runnervm3jd5f matplotlib.font_manager[2874] DEBUG findfont: score(FontEntry(fname='/usr/share/fonts/truetype/dejavu/DejaVuSerifCondensed-Italic.ttf', index=0, name='DejaVu Serif', style='italic', variant='normal', weight=400, stretch='condensed', size='scalable')) = 10.25
2026-07-21 14:55:57 runnervm3jd5f matplotlib.font_manager[2874] DEBUG findfont: score(FontEntry(fname='/usr/share/fonts/truetype/dejavu/DejaVuSerifCondensed-Italic.ttf', index=0, name='DejaVu Serif Condensed', style='italic', variant='normal', weight=400, stretch='condensed', size='scalable')) = 10.25
2026-07-21 14:55:57 runnervm3jd5f matplotlib.font_manager[2874] DEBUG findfont: score(FontEntry(fname='/usr/share/fonts/truetype/dejavu/DejaVuSans-Bold.ttf', index=0, name='DejaVu Sans', style='normal', variant='normal', weight=700, stretch='normal', size='scalable')) = 1.335
2026-07-21 14:55:57 runnervm3jd5f matplotlib.font_manager[2874] DEBUG findfont: score(FontEntry(fname='/home/runner/micromamba/envs/trajan/fonts/UbuntuMono-R.ttf', index=0, name='Ubuntu Mono', style='normal', variant='normal', weight=400, stretch='normal', size='scalable')) = 11.05
2026-07-21 14:55:57 runnervm3jd5f matplotlib.font_manager[2874] DEBUG findfont: score(FontEntry(fname='/usr/share/fonts/truetype/dejavu/DejaVuSerif-BoldItalic.ttf', index=0, name='DejaVu Serif', style='italic', variant='normal', weight=700, stretch='normal', size='scalable')) = 10.335
2026-07-21 14:55:57 runnervm3jd5f matplotlib.font_manager[2874] DEBUG findfont: score(FontEntry(fname='/usr/share/fonts/truetype/lato/Lato-Hairline.ttf', index=0, name='Lato', style='normal', variant='normal', weight=250, stretch='normal', size='scalable')) = 11.1925
2026-07-21 14:55:57 runnervm3jd5f matplotlib.font_manager[2874] DEBUG findfont: score(FontEntry(fname='/usr/share/fonts/truetype/lato/Lato-Hairline.ttf', index=0, name='Lato Hairline', style='normal', variant='normal', weight=400, stretch='normal', size='scalable')) = 11.05
2026-07-21 14:55:57 runnervm3jd5f matplotlib.font_manager[2874] DEBUG findfont: score(FontEntry(fname='/usr/share/fonts/truetype/lato/Lato-LightItalic.ttf', index=0, name='Lato', style='italic', variant='normal', weight=300, stretch='normal', size='scalable')) = 10.145
2026-07-21 14:55:57 runnervm3jd5f matplotlib.font_manager[2874] DEBUG findfont: score(FontEntry(fname='/usr/share/fonts/truetype/lato/Lato-LightItalic.ttf', index=0, name='Lato Light', style='italic', variant='normal', weight=400, stretch='normal', size='scalable')) = 10.05
2026-07-21 14:55:57 runnervm3jd5f matplotlib.font_manager[2874] DEBUG findfont: score(FontEntry(fname='/usr/share/fonts/truetype/dejavu/DejaVuSansCondensed-BoldOblique.ttf', index=0, name='DejaVu Sans', style='oblique', variant='normal', weight=700, stretch='condensed', size='scalable')) = 0.635
2026-07-21 14:55:57 runnervm3jd5f matplotlib.font_manager[2874] DEBUG findfont: score(FontEntry(fname='/usr/share/fonts/truetype/dejavu/DejaVuSansCondensed-BoldOblique.ttf', index=0, name='DejaVu Sans Condensed', style='oblique', variant='normal', weight=700, stretch='condensed', size='scalable')) = 10.634999999999998
2026-07-21 14:55:57 runnervm3jd5f matplotlib.font_manager[2874] DEBUG findfont: score(FontEntry(fname='/home/runner/micromamba/envs/trajan/fonts/SourceCodePro-It.ttf', index=0, name='Source Code Pro', style='italic', variant='normal', weight=400, stretch='normal', size='scalable')) = 10.05
2026-07-21 14:55:57 runnervm3jd5f matplotlib.font_manager[2874] DEBUG findfont: score(FontEntry(fname='/home/runner/micromamba/envs/trajan/fonts/SourceCodePro-ExtraLightIt.ttf', index=0, name='Source Code Pro', style='italic', variant='normal', weight=200, stretch='normal', size='scalable')) = 10.24
2026-07-21 14:55:57 runnervm3jd5f matplotlib.font_manager[2874] DEBUG findfont: score(FontEntry(fname='/home/runner/micromamba/envs/trajan/fonts/SourceCodePro-ExtraLightIt.ttf', index=0, name='Source Code Pro ExtraLight', style='italic', variant='normal', weight=400, stretch='normal', size='scalable')) = 10.05
2026-07-21 14:55:57 runnervm3jd5f matplotlib.font_manager[2874] DEBUG findfont: score(FontEntry(fname='/usr/share/fonts/truetype/lato/Lato-Medium.ttf', index=0, name='Lato', style='normal', variant='normal', weight=500, stretch='normal', size='scalable')) = 11.145
2026-07-21 14:55:57 runnervm3jd5f matplotlib.font_manager[2874] DEBUG findfont: score(FontEntry(fname='/usr/share/fonts/truetype/lato/Lato-Medium.ttf', index=0, name='Lato Medium', style='normal', variant='normal', weight=400, stretch='normal', size='scalable')) = 11.05
2026-07-21 14:55:57 runnervm3jd5f matplotlib.font_manager[2874] DEBUG findfont: score(FontEntry(fname='/usr/share/fonts/truetype/lato/Lato-BoldItalic.ttf', index=0, name='Lato', style='italic', variant='normal', weight=700, stretch='normal', size='scalable')) = 10.335
2026-07-21 14:55:57 runnervm3jd5f matplotlib.font_manager[2874] DEBUG findfont: score(FontEntry(fname='/home/runner/micromamba/envs/trajan/fonts/DejaVuSans.ttf', index=0, name='DejaVu Sans', style='normal', variant='normal', weight=400, stretch='normal', size='scalable')) = 1.05
2026-07-21 14:55:57 runnervm3jd5f matplotlib.font_manager[2874] DEBUG findfont: score(FontEntry(fname='/home/runner/micromamba/envs/trajan/fonts/UbuntuMono-B.ttf', index=0, name='Ubuntu Mono', style='normal', variant='normal', weight=700, stretch='normal', size='scalable')) = 11.335
2026-07-21 14:55:57 runnervm3jd5f matplotlib.font_manager[2874] DEBUG findfont: score(FontEntry(fname='/home/runner/micromamba/envs/trajan/fonts/SourceCodePro-LightIt.ttf', index=0, name='Source Code Pro', style='italic', variant='normal', weight=300, stretch='normal', size='scalable')) = 10.145
2026-07-21 14:55:57 runnervm3jd5f matplotlib.font_manager[2874] DEBUG findfont: score(FontEntry(fname='/home/runner/micromamba/envs/trajan/fonts/SourceCodePro-LightIt.ttf', index=0, name='Source Code Pro Light', style='italic', variant='normal', weight=400, stretch='normal', size='scalable')) = 10.05
2026-07-21 14:55:57 runnervm3jd5f matplotlib.font_manager[2874] DEBUG findfont: score(FontEntry(fname='/usr/share/fonts/truetype/liberation/LiberationSans-BoldItalic.ttf', index=0, name='Liberation Sans', style='italic', variant='normal', weight=700, stretch='normal', size='scalable')) = 10.335
2026-07-21 14:55:57 runnervm3jd5f matplotlib.font_manager[2874] DEBUG findfont: score(FontEntry(fname='/usr/share/fonts/truetype/liberation/LiberationSans-Regular.ttf', index=0, name='Liberation Sans', style='normal', variant='normal', weight=400, stretch='normal', size='scalable')) = 11.05
2026-07-21 14:55:57 runnervm3jd5f matplotlib.font_manager[2874] DEBUG findfont: score(FontEntry(fname='/usr/share/fonts/truetype/dejavu/DejaVuSansMono-Bold.ttf', index=0, name='DejaVu Sans Mono', style='normal', variant='normal', weight=700, stretch='normal', size='scalable')) = 11.335
2026-07-21 14:55:57 runnervm3jd5f matplotlib.font_manager[2874] DEBUG findfont: score(FontEntry(fname='/home/runner/micromamba/envs/trajan/fonts/SourceCodePro-BoldIt.ttf', index=0, name='Source Code Pro', style='italic', variant='normal', weight=700, stretch='normal', size='scalable')) = 10.335
2026-07-21 14:55:57 runnervm3jd5f matplotlib.font_manager[2874] DEBUG findfont: score(FontEntry(fname='/usr/share/fonts/truetype/lato/Lato-Bold.ttf', index=0, name='Lato', style='normal', variant='normal', weight=700, stretch='normal', size='scalable')) = 11.335
2026-07-21 14:55:57 runnervm3jd5f matplotlib.font_manager[2874] DEBUG findfont: score(FontEntry(fname='/usr/share/fonts/truetype/dejavu/DejaVuSansCondensed.ttf', index=0, name='DejaVu Sans', style='normal', variant='normal', weight=400, stretch='condensed', size='scalable')) = 1.25
2026-07-21 14:55:57 runnervm3jd5f matplotlib.font_manager[2874] DEBUG findfont: score(FontEntry(fname='/usr/share/fonts/truetype/dejavu/DejaVuSansCondensed.ttf', index=0, name='DejaVu Sans Condensed', style='normal', variant='normal', weight=380, stretch='condensed', size='scalable')) = 11.269
2026-07-21 14:55:57 runnervm3jd5f matplotlib.font_manager[2874] DEBUG findfont: score(FontEntry(fname='/usr/share/fonts/truetype/lato/Lato-MediumItalic.ttf', index=0, name='Lato', style='italic', variant='normal', weight=500, stretch='normal', size='scalable')) = 10.145
2026-07-21 14:55:57 runnervm3jd5f matplotlib.font_manager[2874] DEBUG findfont: score(FontEntry(fname='/usr/share/fonts/truetype/lato/Lato-MediumItalic.ttf', index=0, name='Lato Medium', style='italic', variant='normal', weight=400, stretch='normal', size='scalable')) = 10.05
2026-07-21 14:55:57 runnervm3jd5f matplotlib.font_manager[2874] DEBUG findfont: score(FontEntry(fname='/usr/share/fonts/truetype/liberation/LiberationSans-Bold.ttf', index=0, name='Liberation Sans', style='normal', variant='normal', weight=700, stretch='normal', size='scalable')) = 11.335
2026-07-21 14:55:57 runnervm3jd5f matplotlib.font_manager[2874] DEBUG findfont: score(FontEntry(fname='/usr/share/fonts/truetype/dejavu/DejaVuSerifCondensed-BoldItalic.ttf', index=0, name='DejaVu Serif', style='italic', variant='normal', weight=700, stretch='condensed', size='scalable')) = 10.535
2026-07-21 14:55:57 runnervm3jd5f matplotlib.font_manager[2874] DEBUG findfont: score(FontEntry(fname='/usr/share/fonts/truetype/dejavu/DejaVuSerifCondensed-BoldItalic.ttf', index=0, name='DejaVu Serif Condensed', style='italic', variant='normal', weight=700, stretch='condensed', size='scalable')) = 10.535
2026-07-21 14:55:57 runnervm3jd5f matplotlib.font_manager[2874] DEBUG findfont: score(FontEntry(fname='/home/runner/micromamba/envs/trajan/fonts/Ubuntu-R.ttf', index=0, name='Ubuntu', style='normal', variant='normal', weight=400, stretch='normal', size='scalable')) = 11.05
2026-07-21 14:55:57 runnervm3jd5f matplotlib.font_manager[2874] DEBUG findfont: score(FontEntry(fname='/usr/share/fonts/truetype/lato/Lato-Light.ttf', index=0, name='Lato', style='normal', variant='normal', weight=300, stretch='normal', size='scalable')) = 11.145
2026-07-21 14:55:57 runnervm3jd5f matplotlib.font_manager[2874] DEBUG findfont: score(FontEntry(fname='/usr/share/fonts/truetype/lato/Lato-Light.ttf', index=0, name='Lato Light', style='normal', variant='normal', weight=400, stretch='normal', size='scalable')) = 11.05
2026-07-21 14:55:57 runnervm3jd5f matplotlib.font_manager[2874] DEBUG findfont: score(FontEntry(fname='/usr/share/fonts/truetype/liberation/LiberationSerif-BoldItalic.ttf', index=0, name='Liberation Serif', style='italic', variant='normal', weight=700, stretch='normal', size='scalable')) = 10.335
2026-07-21 14:55:57 runnervm3jd5f matplotlib.font_manager[2874] DEBUG findfont: score(FontEntry(fname='/home/runner/micromamba/envs/trajan/fonts/Ubuntu-Th.ttf', index=0, name='Ubuntu', style='normal', variant='normal', weight=250, stretch='normal', size='scalable')) = 11.1925
2026-07-21 14:55:57 runnervm3jd5f matplotlib.font_manager[2874] DEBUG findfont: score(FontEntry(fname='/home/runner/micromamba/envs/trajan/fonts/Ubuntu-Th.ttf', index=0, name='Ubuntu Thin', style='normal', variant='normal', weight=400, stretch='normal', size='scalable')) = 11.05
2026-07-21 14:55:57 runnervm3jd5f matplotlib.font_manager[2874] DEBUG findfont: score(FontEntry(fname='/home/runner/micromamba/envs/trajan/fonts/SourceCodePro-ExtraLight.ttf', index=0, name='Source Code Pro', style='normal', variant='normal', weight=200, stretch='normal', size='scalable')) = 11.24
2026-07-21 14:55:57 runnervm3jd5f matplotlib.font_manager[2874] DEBUG findfont: score(FontEntry(fname='/home/runner/micromamba/envs/trajan/fonts/SourceCodePro-ExtraLight.ttf', index=0, name='Source Code Pro ExtraLight', style='normal', variant='normal', weight=400, stretch='normal', size='scalable')) = 11.05
2026-07-21 14:55:57 runnervm3jd5f matplotlib.font_manager[2874] DEBUG findfont: score(FontEntry(fname='/usr/share/fonts/truetype/lato/Lato-Thin.ttf', index=0, name='Lato', style='normal', variant='normal', weight=275, stretch='normal', size='scalable')) = 11.16875
2026-07-21 14:55:57 runnervm3jd5f matplotlib.font_manager[2874] DEBUG findfont: score(FontEntry(fname='/usr/share/fonts/truetype/lato/Lato-Thin.ttf', index=0, name='Lato Thin', style='normal', variant='normal', weight=400, stretch='normal', size='scalable')) = 11.05
2026-07-21 14:55:57 runnervm3jd5f matplotlib.font_manager[2874] DEBUG findfont: score(FontEntry(fname='/usr/share/fonts/truetype/liberation/LiberationSerif-Bold.ttf', index=0, name='Liberation Serif', style='normal', variant='normal', weight=700, stretch='normal', size='scalable')) = 11.335
2026-07-21 14:55:57 runnervm3jd5f matplotlib.font_manager[2874] DEBUG findfont: score(FontEntry(fname='/home/runner/micromamba/envs/trajan/fonts/Inconsolata-Regular.ttf', index=0, name='Inconsolata', style='normal', variant='normal', weight=400, stretch='normal', size='scalable')) = 11.05
2026-07-21 14:55:57 runnervm3jd5f matplotlib.font_manager[2874] DEBUG findfont: score(FontEntry(fname='/home/runner/micromamba/envs/trajan/fonts/Ubuntu-C.ttf', index=0, name='Ubuntu Condensed', style='normal', variant='normal', weight=400, stretch='condensed', size='scalable')) = 11.25
2026-07-21 14:55:57 runnervm3jd5f matplotlib.font_manager[2874] DEBUG findfont: score(FontEntry(fname='/usr/share/fonts/truetype/dejavu/DejaVuSansCondensed-Bold.ttf', index=0, name='DejaVu Sans', style='normal', variant='normal', weight=700, stretch='condensed', size='scalable')) = 1.535
2026-07-21 14:55:57 runnervm3jd5f matplotlib.font_manager[2874] DEBUG findfont: score(FontEntry(fname='/usr/share/fonts/truetype/dejavu/DejaVuSansCondensed-Bold.ttf', index=0, name='DejaVu Sans Condensed', style='normal', variant='normal', weight=700, stretch='condensed', size='scalable')) = 11.535
2026-07-21 14:55:57 runnervm3jd5f matplotlib.font_manager[2874] DEBUG findfont: score(FontEntry(fname='/usr/share/fonts/truetype/liberation/LiberationMono-Bold.ttf', index=0, name='Liberation Mono', style='normal', variant='normal', weight=700, stretch='normal', size='scalable')) = 11.335
2026-07-21 14:55:57 runnervm3jd5f matplotlib.font_manager[2874] DEBUG findfont: score(FontEntry(fname='/home/runner/micromamba/envs/trajan/fonts/SourceCodePro-Black.ttf', index=0, name='Source Code Pro', style='normal', variant='normal', weight=900, stretch='normal', size='scalable')) = 11.525
2026-07-21 14:55:57 runnervm3jd5f matplotlib.font_manager[2874] DEBUG findfont: score(FontEntry(fname='/home/runner/micromamba/envs/trajan/fonts/SourceCodePro-Black.ttf', index=0, name='Source Code Pro Black', style='normal', variant='normal', weight=400, stretch='normal', size='scalable')) = 11.05
2026-07-21 14:55:57 runnervm3jd5f matplotlib.font_manager[2874] DEBUG findfont: score(FontEntry(fname='/home/runner/micromamba/envs/trajan/fonts/SourceCodePro-BlackIt.ttf', index=0, name='Source Code Pro', style='italic', variant='normal', weight=900, stretch='normal', size='scalable')) = 10.525
2026-07-21 14:55:57 runnervm3jd5f matplotlib.font_manager[2874] DEBUG findfont: score(FontEntry(fname='/home/runner/micromamba/envs/trajan/fonts/SourceCodePro-BlackIt.ttf', index=0, name='Source Code Pro Black', style='italic', variant='normal', weight=400, stretch='normal', size='scalable')) = 10.05
2026-07-21 14:55:57 runnervm3jd5f matplotlib.font_manager[2874] DEBUG findfont: score(FontEntry(fname='/home/runner/micromamba/envs/trajan/fonts/Ubuntu-LI.ttf', index=0, name='Ubuntu', style='italic', variant='normal', weight=300, stretch='normal', size='scalable')) = 10.145
2026-07-21 14:55:57 runnervm3jd5f matplotlib.font_manager[2874] DEBUG findfont: score(FontEntry(fname='/home/runner/micromamba/envs/trajan/fonts/Ubuntu-LI.ttf', index=0, name='Ubuntu Light', style='italic', variant='normal', weight=400, stretch='normal', size='scalable')) = 10.05
2026-07-21 14:55:57 runnervm3jd5f matplotlib.font_manager[2874] DEBUG findfont: score(FontEntry(fname='/usr/share/fonts/truetype/liberation/LiberationMono-Regular.ttf', index=0, name='Liberation Mono', style='normal', variant='normal', weight=400, stretch='normal', size='scalable')) = 11.05
2026-07-21 14:55:57 runnervm3jd5f matplotlib.font_manager[2874] DEBUG findfont: score(FontEntry(fname='/home/runner/micromamba/envs/trajan/fonts/UbuntuMono-RI.ttf', index=0, name='Ubuntu Mono', style='italic', variant='normal', weight=400, stretch='normal', size='scalable')) = 10.05
2026-07-21 14:55:57 runnervm3jd5f matplotlib.font_manager[2874] DEBUG findfont: score(FontEntry(fname='/usr/share/fonts/truetype/lato/Lato-Heavy.ttf', index=0, name='Lato', style='normal', variant='normal', weight=800, stretch='normal', size='scalable')) = 11.43
2026-07-21 14:55:57 runnervm3jd5f matplotlib.font_manager[2874] DEBUG findfont: score(FontEntry(fname='/usr/share/fonts/truetype/lato/Lato-Heavy.ttf', index=0, name='Lato Heavy', style='normal', variant='normal', weight=400, stretch='normal', size='scalable')) = 11.05
2026-07-21 14:55:57 runnervm3jd5f matplotlib.font_manager[2874] DEBUG findfont: score(FontEntry(fname='/usr/share/fonts/truetype/lato/Lato-HairlineItalic.ttf', index=0, name='Lato', style='italic', variant='normal', weight=250, stretch='normal', size='scalable')) = 10.1925
2026-07-21 14:55:57 runnervm3jd5f matplotlib.font_manager[2874] DEBUG findfont: score(FontEntry(fname='/usr/share/fonts/truetype/lato/Lato-HairlineItalic.ttf', index=0, name='Lato Hairline', style='italic', variant='normal', weight=400, stretch='normal', size='scalable')) = 10.05
2026-07-21 14:55:57 runnervm3jd5f matplotlib.font_manager[2874] DEBUG findfont: score(FontEntry(fname='/usr/share/fonts/truetype/dejavu/DejaVuSerifCondensed-Bold.ttf', index=0, name='DejaVu Serif', style='normal', variant='normal', weight=700, stretch='condensed', size='scalable')) = 11.535
2026-07-21 14:55:57 runnervm3jd5f matplotlib.font_manager[2874] DEBUG findfont: score(FontEntry(fname='/usr/share/fonts/truetype/dejavu/DejaVuSerifCondensed-Bold.ttf', index=0, name='DejaVu Serif Condensed', style='normal', variant='normal', weight=700, stretch='condensed', size='scalable')) = 11.535
2026-07-21 14:55:57 runnervm3jd5f matplotlib.font_manager[2874] DEBUG findfont: score(FontEntry(fname='/usr/share/fonts/truetype/dejavu/DejaVuSansCondensed-Oblique.ttf', index=0, name='DejaVu Sans', style='oblique', variant='normal', weight=400, stretch='condensed', size='scalable')) = 0.35000000000000003
2026-07-21 14:55:57 runnervm3jd5f matplotlib.font_manager[2874] DEBUG findfont: score(FontEntry(fname='/usr/share/fonts/truetype/dejavu/DejaVuSansCondensed-Oblique.ttf', index=0, name='DejaVu Sans Condensed', style='oblique', variant='normal', weight=400, stretch='condensed', size='scalable')) = 10.35
2026-07-21 14:55:57 runnervm3jd5f matplotlib.font_manager[2874] DEBUG findfont: score(FontEntry(fname='/usr/share/fonts/truetype/lato/Lato-SemiboldItalic.ttf', index=0, name='Lato', style='italic', variant='normal', weight=600, stretch='normal', size='scalable')) = 10.24
2026-07-21 14:55:57 runnervm3jd5f matplotlib.font_manager[2874] DEBUG findfont: score(FontEntry(fname='/usr/share/fonts/truetype/lato/Lato-SemiboldItalic.ttf', index=0, name='Lato Semibold', style='italic', variant='normal', weight=400, stretch='normal', size='scalable')) = 10.05
2026-07-21 14:55:57 runnervm3jd5f matplotlib.font_manager[2874] DEBUG findfont: score(FontEntry(fname='/usr/share/fonts/truetype/lato/Lato-Semibold.ttf', index=0, name='Lato', style='normal', variant='normal', weight=600, stretch='normal', size='scalable')) = 11.24
2026-07-21 14:55:57 runnervm3jd5f matplotlib.font_manager[2874] DEBUG findfont: score(FontEntry(fname='/usr/share/fonts/truetype/lato/Lato-Semibold.ttf', index=0, name='Lato Semibold', style='normal', variant='normal', weight=400, stretch='normal', size='scalable')) = 11.05
2026-07-21 14:55:57 runnervm3jd5f matplotlib.font_manager[2874] DEBUG findfont: score(FontEntry(fname='/home/runner/micromamba/envs/trajan/fonts/Inconsolata-Bold.ttf', index=0, name='Inconsolata', style='normal', variant='normal', weight=700, stretch='normal', size='scalable')) = 11.335
2026-07-21 14:55:57 runnervm3jd5f matplotlib.font_manager[2874] DEBUG findfont: score(FontEntry(fname='/usr/share/fonts/truetype/dejavu/DejaVuSans-ExtraLight.ttf', index=0, name='DejaVu Sans', style='normal', variant='normal', weight=200, stretch='normal', size='scalable')) = 1.24
2026-07-21 14:55:57 runnervm3jd5f matplotlib.font_manager[2874] DEBUG findfont: score(FontEntry(fname='/usr/share/fonts/truetype/dejavu/DejaVuSans-ExtraLight.ttf', index=0, name='DejaVu Sans Light', style='normal', variant='normal', weight=200, stretch='normal', size='scalable')) = 11.24
2026-07-21 14:55:57 runnervm3jd5f matplotlib.font_manager[2874] DEBUG findfont: score(FontEntry(fname='/home/runner/micromamba/envs/trajan/fonts/Ubuntu-BI.ttf', index=0, name='Ubuntu', style='italic', variant='normal', weight=700, stretch='normal', size='scalable')) = 10.335
2026-07-21 14:55:57 runnervm3jd5f matplotlib.font_manager[2874] DEBUG findfont: score(FontEntry(fname='/usr/share/fonts/truetype/dejavu/DejaVuSans-BoldOblique.ttf', index=0, name='DejaVu Sans', style='oblique', variant='normal', weight=700, stretch='normal', size='scalable')) = 0.43499999999999994
2026-07-21 14:55:57 runnervm3jd5f matplotlib.font_manager[2874] DEBUG findfont: score(FontEntry(fname='/home/runner/micromamba/envs/trajan/fonts/Ubuntu-RI.ttf', index=0, name='Ubuntu', style='italic', variant='normal', weight=400, stretch='normal', size='scalable')) = 10.05
2026-07-21 14:55:57 runnervm3jd5f matplotlib.font_manager[2874] DEBUG findfont: score(FontEntry(fname='/usr/share/fonts/truetype/dejavu/DejaVuSerif-Italic.ttf', index=0, name='DejaVu Serif', style='italic', variant='normal', weight=400, stretch='normal', size='scalable')) = 10.05
2026-07-21 14:55:57 runnervm3jd5f matplotlib.font_manager[2874] DEBUG findfont: score(FontEntry(fname='/home/runner/micromamba/envs/trajan/fonts/SourceCodePro-Medium.ttf', index=0, name='Source Code Pro', style='normal', variant='normal', weight=500, stretch='normal', size='scalable')) = 11.145
2026-07-21 14:55:57 runnervm3jd5f matplotlib.font_manager[2874] DEBUG findfont: score(FontEntry(fname='/home/runner/micromamba/envs/trajan/fonts/SourceCodePro-Medium.ttf', index=0, name='Source Code Pro Medium', style='normal', variant='normal', weight=400, stretch='normal', size='scalable')) = 11.05
2026-07-21 14:55:57 runnervm3jd5f matplotlib.font_manager[2874] DEBUG findfont: score(FontEntry(fname='/usr/share/fonts/truetype/lato/Lato-HeavyItalic.ttf', index=0, name='Lato', style='italic', variant='normal', weight=800, stretch='normal', size='scalable')) = 10.43
2026-07-21 14:55:57 runnervm3jd5f matplotlib.font_manager[2874] DEBUG findfont: score(FontEntry(fname='/usr/share/fonts/truetype/lato/Lato-HeavyItalic.ttf', index=0, name='Lato Heavy', style='italic', variant='normal', weight=400, stretch='normal', size='scalable')) = 10.05
2026-07-21 14:55:57 runnervm3jd5f matplotlib.font_manager[2874] DEBUG findfont: score(FontEntry(fname='/usr/share/fonts/truetype/dejavu/DejaVuSans-Oblique.ttf', index=0, name='DejaVu Sans', style='oblique', variant='normal', weight=400, stretch='normal', size='scalable')) = 0.15000000000000002
2026-07-21 14:55:57 runnervm3jd5f matplotlib.font_manager[2874] DEBUG findfont: score(FontEntry(fname='/home/runner/micromamba/envs/trajan/fonts/Ubuntu-M.ttf', index=0, name='Ubuntu', style='normal', variant='normal', weight=500, stretch='normal', size='scalable')) = 11.145
2026-07-21 14:55:57 runnervm3jd5f matplotlib.font_manager[2874] DEBUG findfont: score(FontEntry(fname='/home/runner/micromamba/envs/trajan/fonts/Ubuntu-M.ttf', index=0, name='Ubuntu Light', style='normal', variant='normal', weight=700, stretch='normal', size='scalable')) = 11.335
2026-07-21 14:55:57 runnervm3jd5f matplotlib.font_manager[2874] DEBUG findfont: score(FontEntry(fname='/usr/share/fonts/truetype/liberation/LiberationMono-BoldItalic.ttf', index=0, name='Liberation Mono', style='italic', variant='normal', weight=700, stretch='normal', size='scalable')) = 10.335
2026-07-21 14:55:57 runnervm3jd5f matplotlib.font_manager[2874] DEBUG findfont: score(FontEntry(fname='/usr/share/fonts/truetype/dejavu/DejaVuSansMono.ttf', index=0, name='DejaVu Sans Mono', style='normal', variant='normal', weight=400, stretch='normal', size='scalable')) = 11.05
2026-07-21 14:55:57 runnervm3jd5f matplotlib.font_manager[2874] DEBUG findfont: score(FontEntry(fname='/usr/share/fonts/truetype/dejavu/DejaVuMathTeXGyre.ttf', index=0, name='DejaVu Math TeX Gyre', style='normal', variant='normal', weight=400, stretch='normal', size='scalable')) = 11.05
2026-07-21 14:55:57 runnervm3jd5f matplotlib.font_manager[2874] DEBUG findfont: score(FontEntry(fname='/usr/share/fonts/truetype/dejavu/DejaVuSansMono-Oblique.ttf', index=0, name='DejaVu Sans Mono', style='oblique', variant='normal', weight=400, stretch='normal', size='scalable')) = 10.15
2026-07-21 14:55:57 runnervm3jd5f matplotlib.font_manager[2874] DEBUG findfont: score(FontEntry(fname='/home/runner/micromamba/envs/trajan/fonts/Ubuntu-L.ttf', index=0, name='Ubuntu', style='normal', variant='normal', weight=300, stretch='normal', size='scalable')) = 11.145
2026-07-21 14:55:57 runnervm3jd5f matplotlib.font_manager[2874] DEBUG findfont: score(FontEntry(fname='/home/runner/micromamba/envs/trajan/fonts/Ubuntu-L.ttf', index=0, name='Ubuntu Light', style='normal', variant='normal', weight=400, stretch='normal', size='scalable')) = 11.05
2026-07-21 14:55:57 runnervm3jd5f matplotlib.font_manager[2874] DEBUG findfont: score(FontEntry(fname='/home/runner/micromamba/envs/trajan/fonts/SourceCodePro-MediumIt.ttf', index=0, name='Source Code Pro', style='italic', variant='normal', weight=500, stretch='normal', size='scalable')) = 10.145
2026-07-21 14:55:57 runnervm3jd5f matplotlib.font_manager[2874] DEBUG findfont: score(FontEntry(fname='/home/runner/micromamba/envs/trajan/fonts/SourceCodePro-MediumIt.ttf', index=0, name='Source Code Pro Medium', style='italic', variant='normal', weight=400, stretch='normal', size='scalable')) = 10.05
2026-07-21 14:55:57 runnervm3jd5f matplotlib.font_manager[2874] DEBUG findfont: score(FontEntry(fname='/home/runner/micromamba/envs/trajan/fonts/SourceCodePro-Regular.ttf', index=0, name='Source Code Pro', style='normal', variant='normal', weight=400, stretch='normal', size='scalable')) = 11.05
2026-07-21 14:55:57 runnervm3jd5f matplotlib.font_manager[2874] DEBUG findfont: score(FontEntry(fname='/home/runner/micromamba/envs/trajan/fonts/SourceCodePro-SemiboldIt.ttf', index=0, name='Source Code Pro', style='italic', variant='normal', weight=600, stretch='normal', size='scalable')) = 10.24
2026-07-21 14:55:57 runnervm3jd5f matplotlib.font_manager[2874] DEBUG findfont: score(FontEntry(fname='/home/runner/micromamba/envs/trajan/fonts/SourceCodePro-SemiboldIt.ttf', index=0, name='Source Code Pro Semibold', style='italic', variant='normal', weight=400, stretch='normal', size='scalable')) = 10.05
2026-07-21 14:55:57 runnervm3jd5f matplotlib.font_manager[2874] DEBUG findfont: score(FontEntry(fname='/usr/share/fonts/truetype/dejavu/DejaVuSerif.ttf', index=0, name='DejaVu Serif', style='normal', variant='normal', weight=400, stretch='normal', size='scalable')) = 11.05
2026-07-21 14:55:57 runnervm3jd5f matplotlib.font_manager[2874] DEBUG findfont: score(FontEntry(fname='/usr/share/fonts/truetype/dejavu/DejaVuSerif-Bold.ttf', index=0, name='DejaVu Serif', style='normal', variant='normal', weight=700, stretch='normal', size='scalable')) = 11.335
2026-07-21 14:55:57 runnervm3jd5f matplotlib.font_manager[2874] DEBUG findfont: score(FontEntry(fname='/usr/share/fonts/truetype/liberation/LiberationSerif-Italic.ttf', index=0, name='Liberation Serif', style='italic', variant='normal', weight=400, stretch='normal', size='scalable')) = 10.05
2026-07-21 14:55:57 runnervm3jd5f matplotlib.font_manager[2874] DEBUG findfont: score(FontEntry(fname='/usr/share/fonts/truetype/dejavu/DejaVuSansMono-BoldOblique.ttf', index=0, name='DejaVu Sans Mono', style='oblique', variant='normal', weight=700, stretch='normal', size='scalable')) = 10.434999999999999
2026-07-21 14:55:57 runnervm3jd5f matplotlib.font_manager[2874] DEBUG findfont: score(FontEntry(fname='/home/runner/micromamba/envs/trajan/fonts/SourceCodePro-Light.ttf', index=0, name='Source Code Pro', style='normal', variant='normal', weight=300, stretch='normal', size='scalable')) = 11.145
2026-07-21 14:55:57 runnervm3jd5f matplotlib.font_manager[2874] DEBUG findfont: score(FontEntry(fname='/home/runner/micromamba/envs/trajan/fonts/SourceCodePro-Light.ttf', index=0, name='Source Code Pro Light', style='normal', variant='normal', weight=400, stretch='normal', size='scalable')) = 11.05
2026-07-21 14:55:57 runnervm3jd5f matplotlib.font_manager[2874] DEBUG findfont: score(FontEntry(fname='/usr/share/fonts/truetype/liberation/LiberationMono-Italic.ttf', index=0, name='Liberation Mono', style='italic', variant='normal', weight=400, stretch='normal', size='scalable')) = 10.05
2026-07-21 14:55:57 runnervm3jd5f matplotlib.font_manager[2874] DEBUG findfont: Matching DejaVu Sans:style=italic:variant=normal:weight=normal:stretch=normal:size=10.0 to DejaVu Sans ('/home/runner/micromamba/envs/trajan/lib/python3.14/site-packages/matplotlib/mpl-data/fonts/ttf/DejaVuSans-Oblique.ttf') with score of 0.150000.
2026-07-21 14:55:57 runnervm3jd5f matplotlib.font_manager[2874] DEBUG findfont: Matching DejaVu Sans:style=normal:variant=normal:weight=bold:stretch=normal:size=10.0.
2026-07-21 14:55:57 runnervm3jd5f matplotlib.font_manager[2874] DEBUG findfont: score(FontEntry(fname='/home/runner/micromamba/envs/trajan/lib/python3.14/site-packages/matplotlib/mpl-data/fonts/ttf/cmmi10.ttf', index=0, name='cmmi10', style='normal', variant='normal', weight=400, stretch='normal', size='scalable')) = 10.335
2026-07-21 14:55:57 runnervm3jd5f matplotlib.font_manager[2874] DEBUG findfont: score(FontEntry(fname='/home/runner/micromamba/envs/trajan/lib/python3.14/site-packages/matplotlib/mpl-data/fonts/ttf/DejaVuSerif-Bold.ttf', index=0, name='DejaVu Serif', style='normal', variant='normal', weight=700, stretch='normal', size='scalable')) = 10.05
2026-07-21 14:55:57 runnervm3jd5f matplotlib.font_manager[2874] DEBUG findfont: score(FontEntry(fname='/home/runner/micromamba/envs/trajan/lib/python3.14/site-packages/matplotlib/mpl-data/fonts/ttf/DejaVuSans-Oblique.ttf', index=0, name='DejaVu Sans', style='oblique', variant='normal', weight=400, stretch='normal', size='scalable')) = 1.335
2026-07-21 14:55:57 runnervm3jd5f matplotlib.font_manager[2874] DEBUG findfont: score(FontEntry(fname='/home/runner/micromamba/envs/trajan/lib/python3.14/site-packages/matplotlib/mpl-data/fonts/ttf/STIXSizThreeSymReg.ttf', index=0, name='STIXSizeThreeSym', style='normal', variant='normal', weight=400, stretch='normal', size='scalable')) = 10.335
2026-07-21 14:55:57 runnervm3jd5f matplotlib.font_manager[2874] DEBUG findfont: score(FontEntry(fname='/home/runner/micromamba/envs/trajan/lib/python3.14/site-packages/matplotlib/mpl-data/fonts/ttf/STIXNonUniBolIta.ttf', index=0, name='STIXNonUnicode', style='italic', variant='normal', weight=700, stretch='normal', size='scalable')) = 11.05
2026-07-21 14:55:57 runnervm3jd5f matplotlib.font_manager[2874] DEBUG findfont: score(FontEntry(fname='/home/runner/micromamba/envs/trajan/lib/python3.14/site-packages/matplotlib/mpl-data/fonts/ttf/DejaVuSerifDisplay.ttf', index=0, name='DejaVu Serif Display', style='normal', variant='normal', weight=400, stretch='normal', size='scalable')) = 10.335
2026-07-21 14:55:57 runnervm3jd5f matplotlib.font_manager[2874] DEBUG findfont: score(FontEntry(fname='/home/runner/micromamba/envs/trajan/lib/python3.14/site-packages/matplotlib/mpl-data/fonts/ttf/cmss10.ttf', index=0, name='cmss10', style='normal', variant='normal', weight=400, stretch='normal', size='scalable')) = 10.335
2026-07-21 14:55:57 runnervm3jd5f matplotlib.font_manager[2874] DEBUG findfont: score(FontEntry(fname='/home/runner/micromamba/envs/trajan/lib/python3.14/site-packages/matplotlib/mpl-data/fonts/ttf/STIXGeneralBolIta.ttf', index=0, name='STIXGeneral', style='italic', variant='normal', weight=700, stretch='normal', size='scalable')) = 11.05
2026-07-21 14:55:57 runnervm3jd5f matplotlib.font_manager[2874] DEBUG findfont: score(FontEntry(fname='/home/runner/micromamba/envs/trajan/lib/python3.14/site-packages/matplotlib/mpl-data/fonts/ttf/cmtt10.ttf', index=0, name='cmtt10', style='normal', variant='normal', weight=400, stretch='normal', size='scalable')) = 10.335
2026-07-21 14:55:57 runnervm3jd5f matplotlib.font_manager[2874] DEBUG findfont: score(FontEntry(fname='/home/runner/micromamba/envs/trajan/lib/python3.14/site-packages/matplotlib/mpl-data/fonts/ttf/cmsy10.ttf', index=0, name='cmsy10', style='normal', variant='normal', weight=400, stretch='normal', size='scalable')) = 10.335
2026-07-21 14:55:57 runnervm3jd5f matplotlib.font_manager[2874] DEBUG findfont: score(FontEntry(fname='/home/runner/micromamba/envs/trajan/lib/python3.14/site-packages/matplotlib/mpl-data/fonts/ttf/DejaVuSansMono-Oblique.ttf', index=0, name='DejaVu Sans Mono', style='oblique', variant='normal', weight=400, stretch='normal', size='scalable')) = 11.335
2026-07-21 14:55:57 runnervm3jd5f matplotlib.font_manager[2874] DEBUG findfont: score(FontEntry(fname='/home/runner/micromamba/envs/trajan/lib/python3.14/site-packages/matplotlib/mpl-data/fonts/ttf/STIXNonUniIta.ttf', index=0, name='STIXNonUnicode', style='italic', variant='normal', weight=400, stretch='normal', size='scalable')) = 11.335
2026-07-21 14:55:57 runnervm3jd5f matplotlib.font_manager[2874] DEBUG findfont: score(FontEntry(fname='/home/runner/micromamba/envs/trajan/lib/python3.14/site-packages/matplotlib/mpl-data/fonts/ttf/STIXGeneral.ttf', index=0, name='STIXGeneral', style='normal', variant='normal', weight=400, stretch='normal', size='scalable')) = 10.335
2026-07-21 14:55:57 runnervm3jd5f matplotlib.font_manager[2874] DEBUG findfont: score(FontEntry(fname='/home/runner/micromamba/envs/trajan/lib/python3.14/site-packages/matplotlib/mpl-data/fonts/ttf/cmti10.ttf', index=0, name='cmti10', style='normal', variant='normal', weight=400, stretch='normal', size='scalable')) = 10.335
2026-07-21 14:55:57 runnervm3jd5f matplotlib.font_manager[2874] DEBUG findfont: score(FontEntry(fname='/home/runner/micromamba/envs/trajan/lib/python3.14/site-packages/matplotlib/mpl-data/fonts/ttf/DejaVuSansMono-BoldOblique.ttf', index=0, name='DejaVu Sans Mono', style='oblique', variant='normal', weight=700, stretch='normal', size='scalable')) = 11.05
2026-07-21 14:55:57 runnervm3jd5f matplotlib.font_manager[2874] DEBUG findfont: score(FontEntry(fname='/home/runner/micromamba/envs/trajan/lib/python3.14/site-packages/matplotlib/mpl-data/fonts/ttf/DejaVuSerif.ttf', index=0, name='DejaVu Serif', style='normal', variant='normal', weight=400, stretch='normal', size='scalable')) = 10.335
2026-07-21 14:55:57 runnervm3jd5f matplotlib.font_manager[2874] DEBUG findfont: score(FontEntry(fname='/home/runner/micromamba/envs/trajan/lib/python3.14/site-packages/matplotlib/mpl-data/fonts/ttf/LastResortHE-Regular.ttf', index=0, name='Last Resort High-Efficiency', style='normal', variant='normal', weight=400, stretch='normal', size='scalable')) = 10.335
2026-07-21 14:55:57 runnervm3jd5f matplotlib.font_manager[2874] DEBUG findfont: score(FontEntry(fname='/home/runner/micromamba/envs/trajan/lib/python3.14/site-packages/matplotlib/mpl-data/fonts/ttf/cmex10.ttf', index=0, name='cmex10', style='normal', variant='normal', weight=400, stretch='normal', size='scalable')) = 10.335
2026-07-21 14:55:57 runnervm3jd5f matplotlib.font_manager[2874] DEBUG findfont: score(FontEntry(fname='/home/runner/micromamba/envs/trajan/lib/python3.14/site-packages/matplotlib/mpl-data/fonts/ttf/STIXSizFiveSymReg.ttf', index=0, name='STIXSizeFiveSym', style='normal', variant='normal', weight=400, stretch='normal', size='scalable')) = 10.335
2026-07-21 14:55:57 runnervm3jd5f matplotlib.font_manager[2874] DEBUG findfont: score(FontEntry(fname='/home/runner/micromamba/envs/trajan/lib/python3.14/site-packages/matplotlib/mpl-data/fonts/ttf/STIXNonUniBol.ttf', index=0, name='STIXNonUnicode', style='normal', variant='normal', weight=700, stretch='normal', size='scalable')) = 10.05
2026-07-21 14:55:57 runnervm3jd5f matplotlib.font_manager[2874] DEBUG findfont: score(FontEntry(fname='/home/runner/micromamba/envs/trajan/lib/python3.14/site-packages/matplotlib/mpl-data/fonts/ttf/DejaVuSansDisplay.ttf', index=0, name='DejaVu Sans Display', style='normal', variant='normal', weight=400, stretch='normal', size='scalable')) = 10.335
2026-07-21 14:55:57 runnervm3jd5f matplotlib.font_manager[2874] DEBUG findfont: score(FontEntry(fname='/home/runner/micromamba/envs/trajan/lib/python3.14/site-packages/matplotlib/mpl-data/fonts/ttf/DejaVuSansMono.ttf', index=0, name='DejaVu Sans Mono', style='normal', variant='normal', weight=400, stretch='normal', size='scalable')) = 10.335
2026-07-21 14:55:57 runnervm3jd5f matplotlib.font_manager[2874] DEBUG findfont: score(FontEntry(fname='/home/runner/micromamba/envs/trajan/lib/python3.14/site-packages/matplotlib/mpl-data/fonts/ttf/cmb10.ttf', index=0, name='cmb10', style='normal', variant='normal', weight=400, stretch='normal', size='scalable')) = 10.335
2026-07-21 14:55:57 runnervm3jd5f matplotlib.font_manager[2874] DEBUG findfont: score(FontEntry(fname='/home/runner/micromamba/envs/trajan/lib/python3.14/site-packages/matplotlib/mpl-data/fonts/ttf/STIXSizTwoSymReg.ttf', index=0, name='STIXSizeTwoSym', style='normal', variant='normal', weight=400, stretch='normal', size='scalable')) = 10.335
2026-07-21 14:55:57 runnervm3jd5f matplotlib.font_manager[2874] DEBUG findfont: score(FontEntry(fname='/home/runner/micromamba/envs/trajan/lib/python3.14/site-packages/matplotlib/mpl-data/fonts/ttf/DejaVuSans.ttf', index=0, name='DejaVu Sans', style='normal', variant='normal', weight=400, stretch='normal', size='scalable')) = 0.33499999999999996
2026-07-21 14:55:57 runnervm3jd5f matplotlib.font_manager[2874] DEBUG findfont: score(FontEntry(fname='/home/runner/micromamba/envs/trajan/lib/python3.14/site-packages/matplotlib/mpl-data/fonts/ttf/STIXNonUni.ttf', index=0, name='STIXNonUnicode', style='normal', variant='normal', weight=400, stretch='normal', size='scalable')) = 10.335
2026-07-21 14:55:57 runnervm3jd5f matplotlib.font_manager[2874] DEBUG findfont: score(FontEntry(fname='/home/runner/micromamba/envs/trajan/lib/python3.14/site-packages/matplotlib/mpl-data/fonts/ttf/STIXGeneralItalic.ttf', index=0, name='STIXGeneral', style='italic', variant='normal', weight=400, stretch='normal', size='scalable')) = 11.335
2026-07-21 14:55:57 runnervm3jd5f matplotlib.font_manager[2874] DEBUG findfont: score(FontEntry(fname='/home/runner/micromamba/envs/trajan/lib/python3.14/site-packages/matplotlib/mpl-data/fonts/ttf/STIXSizOneSymBol.ttf', index=0, name='STIXSizeOneSym', style='normal', variant='normal', weight=700, stretch='normal', size='scalable')) = 10.05
2026-07-21 14:55:57 runnervm3jd5f matplotlib.font_manager[2874] DEBUG findfont: score(FontEntry(fname='/home/runner/micromamba/envs/trajan/lib/python3.14/site-packages/matplotlib/mpl-data/fonts/ttf/DejaVuSansMono-Bold.ttf', index=0, name='DejaVu Sans Mono', style='normal', variant='normal', weight=700, stretch='normal', size='scalable')) = 10.05
2026-07-21 14:55:57 runnervm3jd5f matplotlib.font_manager[2874] DEBUG findfont: score(FontEntry(fname='/home/runner/micromamba/envs/trajan/lib/python3.14/site-packages/matplotlib/mpl-data/fonts/ttf/STIXSizTwoSymBol.ttf', index=0, name='STIXSizeTwoSym', style='normal', variant='normal', weight=700, stretch='normal', size='scalable')) = 10.05
2026-07-21 14:55:57 runnervm3jd5f matplotlib.font_manager[2874] DEBUG findfont: score(FontEntry(fname='/home/runner/micromamba/envs/trajan/lib/python3.14/site-packages/matplotlib/mpl-data/fonts/ttf/STIXSizThreeSymBol.ttf', index=0, name='STIXSizeThreeSym', style='normal', variant='normal', weight=700, stretch='normal', size='scalable')) = 10.05
2026-07-21 14:55:57 runnervm3jd5f matplotlib.font_manager[2874] DEBUG findfont: score(FontEntry(fname='/home/runner/micromamba/envs/trajan/lib/python3.14/site-packages/matplotlib/mpl-data/fonts/ttf/DejaVuSerif-BoldItalic.ttf', index=0, name='DejaVu Serif', style='italic', variant='normal', weight=700, stretch='normal', size='scalable')) = 11.05
2026-07-21 14:55:57 runnervm3jd5f matplotlib.font_manager[2874] DEBUG findfont: score(FontEntry(fname='/home/runner/micromamba/envs/trajan/lib/python3.14/site-packages/matplotlib/mpl-data/fonts/ttf/DejaVuSerif-Italic.ttf', index=0, name='DejaVu Serif', style='italic', variant='normal', weight=400, stretch='normal', size='scalable')) = 11.335
2026-07-21 14:55:57 runnervm3jd5f matplotlib.font_manager[2874] DEBUG findfont: score(FontEntry(fname='/home/runner/micromamba/envs/trajan/lib/python3.14/site-packages/matplotlib/mpl-data/fonts/ttf/DejaVuSans-Bold.ttf', index=0, name='DejaVu Sans', style='normal', variant='normal', weight=700, stretch='normal', size='scalable')) = 0.05
2026-07-21 14:55:57 runnervm3jd5f matplotlib.font_manager[2874] DEBUG findfont: score(FontEntry(fname='/home/runner/micromamba/envs/trajan/lib/python3.14/site-packages/matplotlib/mpl-data/fonts/ttf/STIXSizFourSymBol.ttf', index=0, name='STIXSizeFourSym', style='normal', variant='normal', weight=700, stretch='normal', size='scalable')) = 10.05
2026-07-21 14:55:57 runnervm3jd5f matplotlib.font_manager[2874] DEBUG findfont: score(FontEntry(fname='/home/runner/micromamba/envs/trajan/lib/python3.14/site-packages/matplotlib/mpl-data/fonts/ttf/STIXSizOneSymReg.ttf', index=0, name='STIXSizeOneSym', style='normal', variant='normal', weight=400, stretch='normal', size='scalable')) = 10.335
2026-07-21 14:55:57 runnervm3jd5f matplotlib.font_manager[2874] DEBUG findfont: score(FontEntry(fname='/home/runner/micromamba/envs/trajan/lib/python3.14/site-packages/matplotlib/mpl-data/fonts/ttf/cmr10.ttf', index=0, name='cmr10', style='normal', variant='normal', weight=400, stretch='normal', size='scalable')) = 10.335
2026-07-21 14:55:57 runnervm3jd5f matplotlib.font_manager[2874] DEBUG findfont: score(FontEntry(fname='/home/runner/micromamba/envs/trajan/lib/python3.14/site-packages/matplotlib/mpl-data/fonts/ttf/STIXGeneralBol.ttf', index=0, name='STIXGeneral', style='normal', variant='normal', weight=700, stretch='normal', size='scalable')) = 10.05
2026-07-21 14:55:57 runnervm3jd5f matplotlib.font_manager[2874] DEBUG findfont: score(FontEntry(fname='/home/runner/micromamba/envs/trajan/lib/python3.14/site-packages/matplotlib/mpl-data/fonts/ttf/DejaVuSans-BoldOblique.ttf', index=0, name='DejaVu Sans', style='oblique', variant='normal', weight=700, stretch='normal', size='scalable')) = 1.05
2026-07-21 14:55:57 runnervm3jd5f matplotlib.font_manager[2874] DEBUG findfont: score(FontEntry(fname='/home/runner/micromamba/envs/trajan/lib/python3.14/site-packages/matplotlib/mpl-data/fonts/ttf/STIXSizFourSymReg.ttf', index=0, name='STIXSizeFourSym', style='normal', variant='normal', weight=400, stretch='normal', size='scalable')) = 10.335
2026-07-21 14:55:57 runnervm3jd5f matplotlib.font_manager[2874] DEBUG findfont: score(FontEntry(fname='/usr/share/fonts/truetype/lato/Lato-Black.ttf', index=0, name='Lato', style='normal', variant='normal', weight=900, stretch='normal', size='scalable')) = 10.24
2026-07-21 14:55:57 runnervm3jd5f matplotlib.font_manager[2874] DEBUG findfont: score(FontEntry(fname='/usr/share/fonts/truetype/lato/Lato-Black.ttf', index=0, name='Lato Black', style='normal', variant='normal', weight=400, stretch='normal', size='scalable')) = 10.335
2026-07-21 14:55:57 runnervm3jd5f matplotlib.font_manager[2874] DEBUG findfont: score(FontEntry(fname='/usr/share/fonts/truetype/liberation/LiberationSerif-Regular.ttf', index=0, name='Liberation Serif', style='normal', variant='normal', weight=400, stretch='normal', size='scalable')) = 10.335
2026-07-21 14:55:57 runnervm3jd5f matplotlib.font_manager[2874] DEBUG findfont: score(FontEntry(fname='/usr/share/fonts/truetype/dejavu/DejaVuSerifCondensed.ttf', index=0, name='DejaVu Serif', style='normal', variant='normal', weight=400, stretch='condensed', size='scalable')) = 10.535
2026-07-21 14:55:57 runnervm3jd5f matplotlib.font_manager[2874] DEBUG findfont: score(FontEntry(fname='/usr/share/fonts/truetype/dejavu/DejaVuSerifCondensed.ttf', index=0, name='DejaVu Serif Condensed', style='normal', variant='normal', weight=380, stretch='condensed', size='scalable')) = 10.553999999999998
2026-07-21 14:55:57 runnervm3jd5f matplotlib.font_manager[2874] DEBUG findfont: score(FontEntry(fname='/home/runner/micromamba/envs/trajan/fonts/UbuntuMono-BI.ttf', index=0, name='Ubuntu Mono', style='italic', variant='normal', weight=700, stretch='normal', size='scalable')) = 11.05
2026-07-21 14:55:57 runnervm3jd5f matplotlib.font_manager[2874] DEBUG findfont: score(FontEntry(fname='/usr/share/fonts/truetype/dejavu/DejaVuSans.ttf', index=0, name='DejaVu Sans', style='normal', variant='normal', weight=400, stretch='normal', size='scalable')) = 0.33499999999999996
2026-07-21 14:55:57 runnervm3jd5f matplotlib.font_manager[2874] DEBUG findfont: score(FontEntry(fname='/usr/share/fonts/truetype/lato/Lato-Italic.ttf', index=0, name='Lato', style='italic', variant='normal', weight=400, stretch='normal', size='scalable')) = 11.335
2026-07-21 14:55:57 runnervm3jd5f matplotlib.font_manager[2874] DEBUG findfont: score(FontEntry(fname='/usr/share/fonts/truetype/liberation/LiberationSans-Italic.ttf', index=0, name='Liberation Sans', style='italic', variant='normal', weight=400, stretch='normal', size='scalable')) = 11.335
2026-07-21 14:55:57 runnervm3jd5f matplotlib.font_manager[2874] DEBUG findfont: score(FontEntry(fname='/home/runner/micromamba/envs/trajan/fonts/Ubuntu-B.ttf', index=0, name='Ubuntu', style='normal', variant='normal', weight=700, stretch='normal', size='scalable')) = 10.05
2026-07-21 14:55:57 runnervm3jd5f matplotlib.font_manager[2874] DEBUG findfont: score(FontEntry(fname='/home/runner/micromamba/envs/trajan/fonts/SourceCodePro-Semibold.ttf', index=0, name='Source Code Pro', style='normal', variant='normal', weight=600, stretch='normal', size='scalable')) = 10.145
2026-07-21 14:55:57 runnervm3jd5f matplotlib.font_manager[2874] DEBUG findfont: score(FontEntry(fname='/home/runner/micromamba/envs/trajan/fonts/SourceCodePro-Semibold.ttf', index=0, name='Source Code Pro Semibold', style='normal', variant='normal', weight=400, stretch='normal', size='scalable')) = 10.335
2026-07-21 14:55:57 runnervm3jd5f matplotlib.font_manager[2874] DEBUG findfont: score(FontEntry(fname='/home/runner/micromamba/envs/trajan/fonts/SourceCodePro-Bold.ttf', index=0, name='Source Code Pro', style='normal', variant='normal', weight=700, stretch='normal', size='scalable')) = 10.05
2026-07-21 14:55:57 runnervm3jd5f matplotlib.font_manager[2874] DEBUG findfont: score(FontEntry(fname='/home/runner/micromamba/envs/trajan/fonts/Ubuntu-MI.ttf', index=0, name='Ubuntu', style='italic', variant='normal', weight=500, stretch='normal', size='scalable')) = 11.24
2026-07-21 14:55:57 runnervm3jd5f matplotlib.font_manager[2874] DEBUG findfont: score(FontEntry(fname='/home/runner/micromamba/envs/trajan/fonts/Ubuntu-MI.ttf', index=0, name='Ubuntu Light', style='italic', variant='normal', weight=700, stretch='normal', size='scalable')) = 11.05
2026-07-21 14:55:57 runnervm3jd5f matplotlib.font_manager[2874] DEBUG findfont: score(FontEntry(fname='/usr/share/fonts/truetype/lato/Lato-Regular.ttf', index=0, name='Lato', style='normal', variant='normal', weight=400, stretch='normal', size='scalable')) = 10.335
2026-07-21 14:55:57 runnervm3jd5f matplotlib.font_manager[2874] DEBUG findfont: score(FontEntry(fname='/usr/share/fonts/truetype/lato/Lato-ThinItalic.ttf', index=0, name='Lato', style='italic', variant='normal', weight=275, stretch='normal', size='scalable')) = 11.45375
2026-07-21 14:55:57 runnervm3jd5f matplotlib.font_manager[2874] DEBUG findfont: score(FontEntry(fname='/usr/share/fonts/truetype/lato/Lato-ThinItalic.ttf', index=0, name='Lato Thin', style='italic', variant='normal', weight=400, stretch='normal', size='scalable')) = 11.335
2026-07-21 14:55:57 runnervm3jd5f matplotlib.font_manager[2874] DEBUG findfont: score(FontEntry(fname='/usr/share/fonts/truetype/lato/Lato-BlackItalic.ttf', index=0, name='Lato', style='italic', variant='normal', weight=900, stretch='normal', size='scalable')) = 11.24
2026-07-21 14:55:57 runnervm3jd5f matplotlib.font_manager[2874] DEBUG findfont: score(FontEntry(fname='/usr/share/fonts/truetype/lato/Lato-BlackItalic.ttf', index=0, name='Lato Black', style='italic', variant='normal', weight=400, stretch='normal', size='scalable')) = 11.335
2026-07-21 14:55:57 runnervm3jd5f matplotlib.font_manager[2874] DEBUG findfont: score(FontEntry(fname='/usr/share/fonts/truetype/dejavu/DejaVuSerifCondensed-Italic.ttf', index=0, name='DejaVu Serif', style='italic', variant='normal', weight=400, stretch='condensed', size='scalable')) = 11.535
2026-07-21 14:55:57 runnervm3jd5f matplotlib.font_manager[2874] DEBUG findfont: score(FontEntry(fname='/usr/share/fonts/truetype/dejavu/DejaVuSerifCondensed-Italic.ttf', index=0, name='DejaVu Serif Condensed', style='italic', variant='normal', weight=400, stretch='condensed', size='scalable')) = 11.535
2026-07-21 14:55:57 runnervm3jd5f matplotlib.font_manager[2874] DEBUG findfont: score(FontEntry(fname='/usr/share/fonts/truetype/dejavu/DejaVuSans-Bold.ttf', index=0, name='DejaVu Sans', style='normal', variant='normal', weight=700, stretch='normal', size='scalable')) = 0.05
2026-07-21 14:55:57 runnervm3jd5f matplotlib.font_manager[2874] DEBUG findfont: score(FontEntry(fname='/home/runner/micromamba/envs/trajan/fonts/UbuntuMono-R.ttf', index=0, name='Ubuntu Mono', style='normal', variant='normal', weight=400, stretch='normal', size='scalable')) = 10.335
2026-07-21 14:55:57 runnervm3jd5f matplotlib.font_manager[2874] DEBUG findfont: score(FontEntry(fname='/usr/share/fonts/truetype/dejavu/DejaVuSerif-BoldItalic.ttf', index=0, name='DejaVu Serif', style='italic', variant='normal', weight=700, stretch='normal', size='scalable')) = 11.05
2026-07-21 14:55:57 runnervm3jd5f matplotlib.font_manager[2874] DEBUG findfont: score(FontEntry(fname='/usr/share/fonts/truetype/lato/Lato-Hairline.ttf', index=0, name='Lato', style='normal', variant='normal', weight=250, stretch='normal', size='scalable')) = 10.4775
2026-07-21 14:55:57 runnervm3jd5f matplotlib.font_manager[2874] DEBUG findfont: score(FontEntry(fname='/usr/share/fonts/truetype/lato/Lato-Hairline.ttf', index=0, name='Lato Hairline', style='normal', variant='normal', weight=400, stretch='normal', size='scalable')) = 10.335
2026-07-21 14:55:57 runnervm3jd5f matplotlib.font_manager[2874] DEBUG findfont: score(FontEntry(fname='/usr/share/fonts/truetype/lato/Lato-LightItalic.ttf', index=0, name='Lato', style='italic', variant='normal', weight=300, stretch='normal', size='scalable')) = 11.43
2026-07-21 14:55:57 runnervm3jd5f matplotlib.font_manager[2874] DEBUG findfont: score(FontEntry(fname='/usr/share/fonts/truetype/lato/Lato-LightItalic.ttf', index=0, name='Lato Light', style='italic', variant='normal', weight=400, stretch='normal', size='scalable')) = 11.335
2026-07-21 14:55:57 runnervm3jd5f matplotlib.font_manager[2874] DEBUG findfont: score(FontEntry(fname='/usr/share/fonts/truetype/dejavu/DejaVuSansCondensed-BoldOblique.ttf', index=0, name='DejaVu Sans', style='oblique', variant='normal', weight=700, stretch='condensed', size='scalable')) = 1.25
2026-07-21 14:55:57 runnervm3jd5f matplotlib.font_manager[2874] DEBUG findfont: score(FontEntry(fname='/usr/share/fonts/truetype/dejavu/DejaVuSansCondensed-BoldOblique.ttf', index=0, name='DejaVu Sans Condensed', style='oblique', variant='normal', weight=700, stretch='condensed', size='scalable')) = 11.25
2026-07-21 14:55:57 runnervm3jd5f matplotlib.font_manager[2874] DEBUG findfont: score(FontEntry(fname='/home/runner/micromamba/envs/trajan/fonts/SourceCodePro-It.ttf', index=0, name='Source Code Pro', style='italic', variant='normal', weight=400, stretch='normal', size='scalable')) = 11.335
2026-07-21 14:55:57 runnervm3jd5f matplotlib.font_manager[2874] DEBUG findfont: score(FontEntry(fname='/home/runner/micromamba/envs/trajan/fonts/SourceCodePro-ExtraLightIt.ttf', index=0, name='Source Code Pro', style='italic', variant='normal', weight=200, stretch='normal', size='scalable')) = 11.525
2026-07-21 14:55:57 runnervm3jd5f matplotlib.font_manager[2874] DEBUG findfont: score(FontEntry(fname='/home/runner/micromamba/envs/trajan/fonts/SourceCodePro-ExtraLightIt.ttf', index=0, name='Source Code Pro ExtraLight', style='italic', variant='normal', weight=400, stretch='normal', size='scalable')) = 11.335
2026-07-21 14:55:57 runnervm3jd5f matplotlib.font_manager[2874] DEBUG findfont: score(FontEntry(fname='/usr/share/fonts/truetype/lato/Lato-Medium.ttf', index=0, name='Lato', style='normal', variant='normal', weight=500, stretch='normal', size='scalable')) = 10.24
2026-07-21 14:55:57 runnervm3jd5f matplotlib.font_manager[2874] DEBUG findfont: score(FontEntry(fname='/usr/share/fonts/truetype/lato/Lato-Medium.ttf', index=0, name='Lato Medium', style='normal', variant='normal', weight=400, stretch='normal', size='scalable')) = 10.335
2026-07-21 14:55:57 runnervm3jd5f matplotlib.font_manager[2874] DEBUG findfont: score(FontEntry(fname='/usr/share/fonts/truetype/lato/Lato-BoldItalic.ttf', index=0, name='Lato', style='italic', variant='normal', weight=700, stretch='normal', size='scalable')) = 11.05
2026-07-21 14:55:57 runnervm3jd5f matplotlib.font_manager[2874] DEBUG findfont: score(FontEntry(fname='/home/runner/micromamba/envs/trajan/fonts/DejaVuSans.ttf', index=0, name='DejaVu Sans', style='normal', variant='normal', weight=400, stretch='normal', size='scalable')) = 0.33499999999999996
2026-07-21 14:55:57 runnervm3jd5f matplotlib.font_manager[2874] DEBUG findfont: score(FontEntry(fname='/home/runner/micromamba/envs/trajan/fonts/UbuntuMono-B.ttf', index=0, name='Ubuntu Mono', style='normal', variant='normal', weight=700, stretch='normal', size='scalable')) = 10.05
2026-07-21 14:55:57 runnervm3jd5f matplotlib.font_manager[2874] DEBUG findfont: score(FontEntry(fname='/home/runner/micromamba/envs/trajan/fonts/SourceCodePro-LightIt.ttf', index=0, name='Source Code Pro', style='italic', variant='normal', weight=300, stretch='normal', size='scalable')) = 11.43
2026-07-21 14:55:57 runnervm3jd5f matplotlib.font_manager[2874] DEBUG findfont: score(FontEntry(fname='/home/runner/micromamba/envs/trajan/fonts/SourceCodePro-LightIt.ttf', index=0, name='Source Code Pro Light', style='italic', variant='normal', weight=400, stretch='normal', size='scalable')) = 11.335
2026-07-21 14:55:57 runnervm3jd5f matplotlib.font_manager[2874] DEBUG findfont: score(FontEntry(fname='/usr/share/fonts/truetype/liberation/LiberationSans-BoldItalic.ttf', index=0, name='Liberation Sans', style='italic', variant='normal', weight=700, stretch='normal', size='scalable')) = 11.05
2026-07-21 14:55:57 runnervm3jd5f matplotlib.font_manager[2874] DEBUG findfont: score(FontEntry(fname='/usr/share/fonts/truetype/liberation/LiberationSans-Regular.ttf', index=0, name='Liberation Sans', style='normal', variant='normal', weight=400, stretch='normal', size='scalable')) = 10.335
2026-07-21 14:55:57 runnervm3jd5f matplotlib.font_manager[2874] DEBUG findfont: score(FontEntry(fname='/usr/share/fonts/truetype/dejavu/DejaVuSansMono-Bold.ttf', index=0, name='DejaVu Sans Mono', style='normal', variant='normal', weight=700, stretch='normal', size='scalable')) = 10.05
2026-07-21 14:55:57 runnervm3jd5f matplotlib.font_manager[2874] DEBUG findfont: score(FontEntry(fname='/home/runner/micromamba/envs/trajan/fonts/SourceCodePro-BoldIt.ttf', index=0, name='Source Code Pro', style='italic', variant='normal', weight=700, stretch='normal', size='scalable')) = 11.05
2026-07-21 14:55:57 runnervm3jd5f matplotlib.font_manager[2874] DEBUG findfont: score(FontEntry(fname='/usr/share/fonts/truetype/lato/Lato-Bold.ttf', index=0, name='Lato', style='normal', variant='normal', weight=700, stretch='normal', size='scalable')) = 10.05
2026-07-21 14:55:57 runnervm3jd5f matplotlib.font_manager[2874] DEBUG findfont: score(FontEntry(fname='/usr/share/fonts/truetype/dejavu/DejaVuSansCondensed.ttf', index=0, name='DejaVu Sans', style='normal', variant='normal', weight=400, stretch='condensed', size='scalable')) = 0.5349999999999999
2026-07-21 14:55:57 runnervm3jd5f matplotlib.font_manager[2874] DEBUG findfont: score(FontEntry(fname='/usr/share/fonts/truetype/dejavu/DejaVuSansCondensed.ttf', index=0, name='DejaVu Sans Condensed', style='normal', variant='normal', weight=380, stretch='condensed', size='scalable')) = 10.553999999999998
2026-07-21 14:55:57 runnervm3jd5f matplotlib.font_manager[2874] DEBUG findfont: score(FontEntry(fname='/usr/share/fonts/truetype/lato/Lato-MediumItalic.ttf', index=0, name='Lato', style='italic', variant='normal', weight=500, stretch='normal', size='scalable')) = 11.24
2026-07-21 14:55:57 runnervm3jd5f matplotlib.font_manager[2874] DEBUG findfont: score(FontEntry(fname='/usr/share/fonts/truetype/lato/Lato-MediumItalic.ttf', index=0, name='Lato Medium', style='italic', variant='normal', weight=400, stretch='normal', size='scalable')) = 11.335
2026-07-21 14:55:57 runnervm3jd5f matplotlib.font_manager[2874] DEBUG findfont: score(FontEntry(fname='/usr/share/fonts/truetype/liberation/LiberationSans-Bold.ttf', index=0, name='Liberation Sans', style='normal', variant='normal', weight=700, stretch='normal', size='scalable')) = 10.05
2026-07-21 14:55:57 runnervm3jd5f matplotlib.font_manager[2874] DEBUG findfont: score(FontEntry(fname='/usr/share/fonts/truetype/dejavu/DejaVuSerifCondensed-BoldItalic.ttf', index=0, name='DejaVu Serif', style='italic', variant='normal', weight=700, stretch='condensed', size='scalable')) = 11.25
2026-07-21 14:55:57 runnervm3jd5f matplotlib.font_manager[2874] DEBUG findfont: score(FontEntry(fname='/usr/share/fonts/truetype/dejavu/DejaVuSerifCondensed-BoldItalic.ttf', index=0, name='DejaVu Serif Condensed', style='italic', variant='normal', weight=700, stretch='condensed', size='scalable')) = 11.25
2026-07-21 14:55:57 runnervm3jd5f matplotlib.font_manager[2874] DEBUG findfont: score(FontEntry(fname='/home/runner/micromamba/envs/trajan/fonts/Ubuntu-R.ttf', index=0, name='Ubuntu', style='normal', variant='normal', weight=400, stretch='normal', size='scalable')) = 10.335
2026-07-21 14:55:57 runnervm3jd5f matplotlib.font_manager[2874] DEBUG findfont: score(FontEntry(fname='/usr/share/fonts/truetype/lato/Lato-Light.ttf', index=0, name='Lato', style='normal', variant='normal', weight=300, stretch='normal', size='scalable')) = 10.43
2026-07-21 14:55:57 runnervm3jd5f matplotlib.font_manager[2874] DEBUG findfont: score(FontEntry(fname='/usr/share/fonts/truetype/lato/Lato-Light.ttf', index=0, name='Lato Light', style='normal', variant='normal', weight=400, stretch='normal', size='scalable')) = 10.335
2026-07-21 14:55:57 runnervm3jd5f matplotlib.font_manager[2874] DEBUG findfont: score(FontEntry(fname='/usr/share/fonts/truetype/liberation/LiberationSerif-BoldItalic.ttf', index=0, name='Liberation Serif', style='italic', variant='normal', weight=700, stretch='normal', size='scalable')) = 11.05
2026-07-21 14:55:57 runnervm3jd5f matplotlib.font_manager[2874] DEBUG findfont: score(FontEntry(fname='/home/runner/micromamba/envs/trajan/fonts/Ubuntu-Th.ttf', index=0, name='Ubuntu', style='normal', variant='normal', weight=250, stretch='normal', size='scalable')) = 10.4775
2026-07-21 14:55:57 runnervm3jd5f matplotlib.font_manager[2874] DEBUG findfont: score(FontEntry(fname='/home/runner/micromamba/envs/trajan/fonts/Ubuntu-Th.ttf', index=0, name='Ubuntu Thin', style='normal', variant='normal', weight=400, stretch='normal', size='scalable')) = 10.335
2026-07-21 14:55:57 runnervm3jd5f matplotlib.font_manager[2874] DEBUG findfont: score(FontEntry(fname='/home/runner/micromamba/envs/trajan/fonts/SourceCodePro-ExtraLight.ttf', index=0, name='Source Code Pro', style='normal', variant='normal', weight=200, stretch='normal', size='scalable')) = 10.525
2026-07-21 14:55:57 runnervm3jd5f matplotlib.font_manager[2874] DEBUG findfont: score(FontEntry(fname='/home/runner/micromamba/envs/trajan/fonts/SourceCodePro-ExtraLight.ttf', index=0, name='Source Code Pro ExtraLight', style='normal', variant='normal', weight=400, stretch='normal', size='scalable')) = 10.335
2026-07-21 14:55:57 runnervm3jd5f matplotlib.font_manager[2874] DEBUG findfont: score(FontEntry(fname='/usr/share/fonts/truetype/lato/Lato-Thin.ttf', index=0, name='Lato', style='normal', variant='normal', weight=275, stretch='normal', size='scalable')) = 10.45375
2026-07-21 14:55:57 runnervm3jd5f matplotlib.font_manager[2874] DEBUG findfont: score(FontEntry(fname='/usr/share/fonts/truetype/lato/Lato-Thin.ttf', index=0, name='Lato Thin', style='normal', variant='normal', weight=400, stretch='normal', size='scalable')) = 10.335
2026-07-21 14:55:57 runnervm3jd5f matplotlib.font_manager[2874] DEBUG findfont: score(FontEntry(fname='/usr/share/fonts/truetype/liberation/LiberationSerif-Bold.ttf', index=0, name='Liberation Serif', style='normal', variant='normal', weight=700, stretch='normal', size='scalable')) = 10.05
2026-07-21 14:55:57 runnervm3jd5f matplotlib.font_manager[2874] DEBUG findfont: score(FontEntry(fname='/home/runner/micromamba/envs/trajan/fonts/Inconsolata-Regular.ttf', index=0, name='Inconsolata', style='normal', variant='normal', weight=400, stretch='normal', size='scalable')) = 10.335
2026-07-21 14:55:57 runnervm3jd5f matplotlib.font_manager[2874] DEBUG findfont: score(FontEntry(fname='/home/runner/micromamba/envs/trajan/fonts/Ubuntu-C.ttf', index=0, name='Ubuntu Condensed', style='normal', variant='normal', weight=400, stretch='condensed', size='scalable')) = 10.535
2026-07-21 14:55:57 runnervm3jd5f matplotlib.font_manager[2874] DEBUG findfont: score(FontEntry(fname='/usr/share/fonts/truetype/dejavu/DejaVuSansCondensed-Bold.ttf', index=0, name='DejaVu Sans', style='normal', variant='normal', weight=700, stretch='condensed', size='scalable')) = 0.25
2026-07-21 14:55:57 runnervm3jd5f matplotlib.font_manager[2874] DEBUG findfont: score(FontEntry(fname='/usr/share/fonts/truetype/dejavu/DejaVuSansCondensed-Bold.ttf', index=0, name='DejaVu Sans Condensed', style='normal', variant='normal', weight=700, stretch='condensed', size='scalable')) = 10.25
2026-07-21 14:55:57 runnervm3jd5f matplotlib.font_manager[2874] DEBUG findfont: score(FontEntry(fname='/usr/share/fonts/truetype/liberation/LiberationMono-Bold.ttf', index=0, name='Liberation Mono', style='normal', variant='normal', weight=700, stretch='normal', size='scalable')) = 10.05
2026-07-21 14:55:57 runnervm3jd5f matplotlib.font_manager[2874] DEBUG findfont: score(FontEntry(fname='/home/runner/micromamba/envs/trajan/fonts/SourceCodePro-Black.ttf', index=0, name='Source Code Pro', style='normal', variant='normal', weight=900, stretch='normal', size='scalable')) = 10.24
2026-07-21 14:55:57 runnervm3jd5f matplotlib.font_manager[2874] DEBUG findfont: score(FontEntry(fname='/home/runner/micromamba/envs/trajan/fonts/SourceCodePro-Black.ttf', index=0, name='Source Code Pro Black', style='normal', variant='normal', weight=400, stretch='normal', size='scalable')) = 10.335
2026-07-21 14:55:57 runnervm3jd5f matplotlib.font_manager[2874] DEBUG findfont: score(FontEntry(fname='/home/runner/micromamba/envs/trajan/fonts/SourceCodePro-BlackIt.ttf', index=0, name='Source Code Pro', style='italic', variant='normal', weight=900, stretch='normal', size='scalable')) = 11.24
2026-07-21 14:55:57 runnervm3jd5f matplotlib.font_manager[2874] DEBUG findfont: score(FontEntry(fname='/home/runner/micromamba/envs/trajan/fonts/SourceCodePro-BlackIt.ttf', index=0, name='Source Code Pro Black', style='italic', variant='normal', weight=400, stretch='normal', size='scalable')) = 11.335
2026-07-21 14:55:57 runnervm3jd5f matplotlib.font_manager[2874] DEBUG findfont: score(FontEntry(fname='/home/runner/micromamba/envs/trajan/fonts/Ubuntu-LI.ttf', index=0, name='Ubuntu', style='italic', variant='normal', weight=300, stretch='normal', size='scalable')) = 11.43
2026-07-21 14:55:57 runnervm3jd5f matplotlib.font_manager[2874] DEBUG findfont: score(FontEntry(fname='/home/runner/micromamba/envs/trajan/fonts/Ubuntu-LI.ttf', index=0, name='Ubuntu Light', style='italic', variant='normal', weight=400, stretch='normal', size='scalable')) = 11.335
2026-07-21 14:55:57 runnervm3jd5f matplotlib.font_manager[2874] DEBUG findfont: score(FontEntry(fname='/usr/share/fonts/truetype/liberation/LiberationMono-Regular.ttf', index=0, name='Liberation Mono', style='normal', variant='normal', weight=400, stretch='normal', size='scalable')) = 10.335
2026-07-21 14:55:57 runnervm3jd5f matplotlib.font_manager[2874] DEBUG findfont: score(FontEntry(fname='/home/runner/micromamba/envs/trajan/fonts/UbuntuMono-RI.ttf', index=0, name='Ubuntu Mono', style='italic', variant='normal', weight=400, stretch='normal', size='scalable')) = 11.335
2026-07-21 14:55:57 runnervm3jd5f matplotlib.font_manager[2874] DEBUG findfont: score(FontEntry(fname='/usr/share/fonts/truetype/lato/Lato-Heavy.ttf', index=0, name='Lato', style='normal', variant='normal', weight=800, stretch='normal', size='scalable')) = 10.145
2026-07-21 14:55:57 runnervm3jd5f matplotlib.font_manager[2874] DEBUG findfont: score(FontEntry(fname='/usr/share/fonts/truetype/lato/Lato-Heavy.ttf', index=0, name='Lato Heavy', style='normal', variant='normal', weight=400, stretch='normal', size='scalable')) = 10.335
2026-07-21 14:55:57 runnervm3jd5f matplotlib.font_manager[2874] DEBUG findfont: score(FontEntry(fname='/usr/share/fonts/truetype/lato/Lato-HairlineItalic.ttf', index=0, name='Lato', style='italic', variant='normal', weight=250, stretch='normal', size='scalable')) = 11.4775
2026-07-21 14:55:57 runnervm3jd5f matplotlib.font_manager[2874] DEBUG findfont: score(FontEntry(fname='/usr/share/fonts/truetype/lato/Lato-HairlineItalic.ttf', index=0, name='Lato Hairline', style='italic', variant='normal', weight=400, stretch='normal', size='scalable')) = 11.335
2026-07-21 14:55:57 runnervm3jd5f matplotlib.font_manager[2874] DEBUG findfont: score(FontEntry(fname='/usr/share/fonts/truetype/dejavu/DejaVuSerifCondensed-Bold.ttf', index=0, name='DejaVu Serif', style='normal', variant='normal', weight=700, stretch='condensed', size='scalable')) = 10.25
2026-07-21 14:55:57 runnervm3jd5f matplotlib.font_manager[2874] DEBUG findfont: score(FontEntry(fname='/usr/share/fonts/truetype/dejavu/DejaVuSerifCondensed-Bold.ttf', index=0, name='DejaVu Serif Condensed', style='normal', variant='normal', weight=700, stretch='condensed', size='scalable')) = 10.25
2026-07-21 14:55:57 runnervm3jd5f matplotlib.font_manager[2874] DEBUG findfont: score(FontEntry(fname='/usr/share/fonts/truetype/dejavu/DejaVuSansCondensed-Oblique.ttf', index=0, name='DejaVu Sans', style='oblique', variant='normal', weight=400, stretch='condensed', size='scalable')) = 1.535
2026-07-21 14:55:57 runnervm3jd5f matplotlib.font_manager[2874] DEBUG findfont: score(FontEntry(fname='/usr/share/fonts/truetype/dejavu/DejaVuSansCondensed-Oblique.ttf', index=0, name='DejaVu Sans Condensed', style='oblique', variant='normal', weight=400, stretch='condensed', size='scalable')) = 11.535
2026-07-21 14:55:57 runnervm3jd5f matplotlib.font_manager[2874] DEBUG findfont: score(FontEntry(fname='/usr/share/fonts/truetype/lato/Lato-SemiboldItalic.ttf', index=0, name='Lato', style='italic', variant='normal', weight=600, stretch='normal', size='scalable')) = 11.145
2026-07-21 14:55:57 runnervm3jd5f matplotlib.font_manager[2874] DEBUG findfont: score(FontEntry(fname='/usr/share/fonts/truetype/lato/Lato-SemiboldItalic.ttf', index=0, name='Lato Semibold', style='italic', variant='normal', weight=400, stretch='normal', size='scalable')) = 11.335
2026-07-21 14:55:57 runnervm3jd5f matplotlib.font_manager[2874] DEBUG findfont: score(FontEntry(fname='/usr/share/fonts/truetype/lato/Lato-Semibold.ttf', index=0, name='Lato', style='normal', variant='normal', weight=600, stretch='normal', size='scalable')) = 10.145
2026-07-21 14:55:57 runnervm3jd5f matplotlib.font_manager[2874] DEBUG findfont: score(FontEntry(fname='/usr/share/fonts/truetype/lato/Lato-Semibold.ttf', index=0, name='Lato Semibold', style='normal', variant='normal', weight=400, stretch='normal', size='scalable')) = 10.335
2026-07-21 14:55:57 runnervm3jd5f matplotlib.font_manager[2874] DEBUG findfont: score(FontEntry(fname='/home/runner/micromamba/envs/trajan/fonts/Inconsolata-Bold.ttf', index=0, name='Inconsolata', style='normal', variant='normal', weight=700, stretch='normal', size='scalable')) = 10.05
2026-07-21 14:55:57 runnervm3jd5f matplotlib.font_manager[2874] DEBUG findfont: score(FontEntry(fname='/usr/share/fonts/truetype/dejavu/DejaVuSans-ExtraLight.ttf', index=0, name='DejaVu Sans', style='normal', variant='normal', weight=200, stretch='normal', size='scalable')) = 0.525
2026-07-21 14:55:57 runnervm3jd5f matplotlib.font_manager[2874] DEBUG findfont: score(FontEntry(fname='/usr/share/fonts/truetype/dejavu/DejaVuSans-ExtraLight.ttf', index=0, name='DejaVu Sans Light', style='normal', variant='normal', weight=200, stretch='normal', size='scalable')) = 10.525
2026-07-21 14:55:57 runnervm3jd5f matplotlib.font_manager[2874] DEBUG findfont: score(FontEntry(fname='/home/runner/micromamba/envs/trajan/fonts/Ubuntu-BI.ttf', index=0, name='Ubuntu', style='italic', variant='normal', weight=700, stretch='normal', size='scalable')) = 11.05
2026-07-21 14:55:57 runnervm3jd5f matplotlib.font_manager[2874] DEBUG findfont: score(FontEntry(fname='/usr/share/fonts/truetype/dejavu/DejaVuSans-BoldOblique.ttf', index=0, name='DejaVu Sans', style='oblique', variant='normal', weight=700, stretch='normal', size='scalable')) = 1.05
2026-07-21 14:55:57 runnervm3jd5f matplotlib.font_manager[2874] DEBUG findfont: score(FontEntry(fname='/home/runner/micromamba/envs/trajan/fonts/Ubuntu-RI.ttf', index=0, name='Ubuntu', style='italic', variant='normal', weight=400, stretch='normal', size='scalable')) = 11.335
2026-07-21 14:55:57 runnervm3jd5f matplotlib.font_manager[2874] DEBUG findfont: score(FontEntry(fname='/usr/share/fonts/truetype/dejavu/DejaVuSerif-Italic.ttf', index=0, name='DejaVu Serif', style='italic', variant='normal', weight=400, stretch='normal', size='scalable')) = 11.335
2026-07-21 14:55:57 runnervm3jd5f matplotlib.font_manager[2874] DEBUG findfont: score(FontEntry(fname='/home/runner/micromamba/envs/trajan/fonts/SourceCodePro-Medium.ttf', index=0, name='Source Code Pro', style='normal', variant='normal', weight=500, stretch='normal', size='scalable')) = 10.24
2026-07-21 14:55:57 runnervm3jd5f matplotlib.font_manager[2874] DEBUG findfont: score(FontEntry(fname='/home/runner/micromamba/envs/trajan/fonts/SourceCodePro-Medium.ttf', index=0, name='Source Code Pro Medium', style='normal', variant='normal', weight=400, stretch='normal', size='scalable')) = 10.335
2026-07-21 14:55:57 runnervm3jd5f matplotlib.font_manager[2874] DEBUG findfont: score(FontEntry(fname='/usr/share/fonts/truetype/lato/Lato-HeavyItalic.ttf', index=0, name='Lato', style='italic', variant='normal', weight=800, stretch='normal', size='scalable')) = 11.145
2026-07-21 14:55:57 runnervm3jd5f matplotlib.font_manager[2874] DEBUG findfont: score(FontEntry(fname='/usr/share/fonts/truetype/lato/Lato-HeavyItalic.ttf', index=0, name='Lato Heavy', style='italic', variant='normal', weight=400, stretch='normal', size='scalable')) = 11.335
2026-07-21 14:55:57 runnervm3jd5f matplotlib.font_manager[2874] DEBUG findfont: score(FontEntry(fname='/usr/share/fonts/truetype/dejavu/DejaVuSans-Oblique.ttf', index=0, name='DejaVu Sans', style='oblique', variant='normal', weight=400, stretch='normal', size='scalable')) = 1.335
2026-07-21 14:55:57 runnervm3jd5f matplotlib.font_manager[2874] DEBUG findfont: score(FontEntry(fname='/home/runner/micromamba/envs/trajan/fonts/Ubuntu-M.ttf', index=0, name='Ubuntu', style='normal', variant='normal', weight=500, stretch='normal', size='scalable')) = 10.24
2026-07-21 14:55:57 runnervm3jd5f matplotlib.font_manager[2874] DEBUG findfont: score(FontEntry(fname='/home/runner/micromamba/envs/trajan/fonts/Ubuntu-M.ttf', index=0, name='Ubuntu Light', style='normal', variant='normal', weight=700, stretch='normal', size='scalable')) = 10.05
2026-07-21 14:55:57 runnervm3jd5f matplotlib.font_manager[2874] DEBUG findfont: score(FontEntry(fname='/usr/share/fonts/truetype/liberation/LiberationMono-BoldItalic.ttf', index=0, name='Liberation Mono', style='italic', variant='normal', weight=700, stretch='normal', size='scalable')) = 11.05
2026-07-21 14:55:57 runnervm3jd5f matplotlib.font_manager[2874] DEBUG findfont: score(FontEntry(fname='/usr/share/fonts/truetype/dejavu/DejaVuSansMono.ttf', index=0, name='DejaVu Sans Mono', style='normal', variant='normal', weight=400, stretch='normal', size='scalable')) = 10.335
2026-07-21 14:55:57 runnervm3jd5f matplotlib.font_manager[2874] DEBUG findfont: score(FontEntry(fname='/usr/share/fonts/truetype/dejavu/DejaVuMathTeXGyre.ttf', index=0, name='DejaVu Math TeX Gyre', style='normal', variant='normal', weight=400, stretch='normal', size='scalable')) = 10.335
2026-07-21 14:55:57 runnervm3jd5f matplotlib.font_manager[2874] DEBUG findfont: score(FontEntry(fname='/usr/share/fonts/truetype/dejavu/DejaVuSansMono-Oblique.ttf', index=0, name='DejaVu Sans Mono', style='oblique', variant='normal', weight=400, stretch='normal', size='scalable')) = 11.335
2026-07-21 14:55:57 runnervm3jd5f matplotlib.font_manager[2874] DEBUG findfont: score(FontEntry(fname='/home/runner/micromamba/envs/trajan/fonts/Ubuntu-L.ttf', index=0, name='Ubuntu', style='normal', variant='normal', weight=300, stretch='normal', size='scalable')) = 10.43
2026-07-21 14:55:57 runnervm3jd5f matplotlib.font_manager[2874] DEBUG findfont: score(FontEntry(fname='/home/runner/micromamba/envs/trajan/fonts/Ubuntu-L.ttf', index=0, name='Ubuntu Light', style='normal', variant='normal', weight=400, stretch='normal', size='scalable')) = 10.335
2026-07-21 14:55:57 runnervm3jd5f matplotlib.font_manager[2874] DEBUG findfont: score(FontEntry(fname='/home/runner/micromamba/envs/trajan/fonts/SourceCodePro-MediumIt.ttf', index=0, name='Source Code Pro', style='italic', variant='normal', weight=500, stretch='normal', size='scalable')) = 11.24
2026-07-21 14:55:57 runnervm3jd5f matplotlib.font_manager[2874] DEBUG findfont: score(FontEntry(fname='/home/runner/micromamba/envs/trajan/fonts/SourceCodePro-MediumIt.ttf', index=0, name='Source Code Pro Medium', style='italic', variant='normal', weight=400, stretch='normal', size='scalable')) = 11.335
2026-07-21 14:55:57 runnervm3jd5f matplotlib.font_manager[2874] DEBUG findfont: score(FontEntry(fname='/home/runner/micromamba/envs/trajan/fonts/SourceCodePro-Regular.ttf', index=0, name='Source Code Pro', style='normal', variant='normal', weight=400, stretch='normal', size='scalable')) = 10.335
2026-07-21 14:55:57 runnervm3jd5f matplotlib.font_manager[2874] DEBUG findfont: score(FontEntry(fname='/home/runner/micromamba/envs/trajan/fonts/SourceCodePro-SemiboldIt.ttf', index=0, name='Source Code Pro', style='italic', variant='normal', weight=600, stretch='normal', size='scalable')) = 11.145
2026-07-21 14:55:57 runnervm3jd5f matplotlib.font_manager[2874] DEBUG findfont: score(FontEntry(fname='/home/runner/micromamba/envs/trajan/fonts/SourceCodePro-SemiboldIt.ttf', index=0, name='Source Code Pro Semibold', style='italic', variant='normal', weight=400, stretch='normal', size='scalable')) = 11.335
2026-07-21 14:55:57 runnervm3jd5f matplotlib.font_manager[2874] DEBUG findfont: score(FontEntry(fname='/usr/share/fonts/truetype/dejavu/DejaVuSerif.ttf', index=0, name='DejaVu Serif', style='normal', variant='normal', weight=400, stretch='normal', size='scalable')) = 10.335
2026-07-21 14:55:57 runnervm3jd5f matplotlib.font_manager[2874] DEBUG findfont: score(FontEntry(fname='/usr/share/fonts/truetype/dejavu/DejaVuSerif-Bold.ttf', index=0, name='DejaVu Serif', style='normal', variant='normal', weight=700, stretch='normal', size='scalable')) = 10.05
2026-07-21 14:55:57 runnervm3jd5f matplotlib.font_manager[2874] DEBUG findfont: score(FontEntry(fname='/usr/share/fonts/truetype/liberation/LiberationSerif-Italic.ttf', index=0, name='Liberation Serif', style='italic', variant='normal', weight=400, stretch='normal', size='scalable')) = 11.335
2026-07-21 14:55:57 runnervm3jd5f matplotlib.font_manager[2874] DEBUG findfont: score(FontEntry(fname='/usr/share/fonts/truetype/dejavu/DejaVuSansMono-BoldOblique.ttf', index=0, name='DejaVu Sans Mono', style='oblique', variant='normal', weight=700, stretch='normal', size='scalable')) = 11.05
2026-07-21 14:55:57 runnervm3jd5f matplotlib.font_manager[2874] DEBUG findfont: score(FontEntry(fname='/home/runner/micromamba/envs/trajan/fonts/SourceCodePro-Light.ttf', index=0, name='Source Code Pro', style='normal', variant='normal', weight=300, stretch='normal', size='scalable')) = 10.43
2026-07-21 14:55:57 runnervm3jd5f matplotlib.font_manager[2874] DEBUG findfont: score(FontEntry(fname='/home/runner/micromamba/envs/trajan/fonts/SourceCodePro-Light.ttf', index=0, name='Source Code Pro Light', style='normal', variant='normal', weight=400, stretch='normal', size='scalable')) = 10.335
2026-07-21 14:55:57 runnervm3jd5f matplotlib.font_manager[2874] DEBUG findfont: score(FontEntry(fname='/usr/share/fonts/truetype/liberation/LiberationMono-Italic.ttf', index=0, name='Liberation Mono', style='italic', variant='normal', weight=400, stretch='normal', size='scalable')) = 11.335
2026-07-21 14:55:57 runnervm3jd5f matplotlib.font_manager[2874] DEBUG findfont: Matching DejaVu Sans:style=normal:variant=normal:weight=bold:stretch=normal:size=10.0 to DejaVu Sans ('/home/runner/micromamba/envs/trajan/lib/python3.14/site-packages/matplotlib/mpl-data/fonts/ttf/DejaVuSans-Bold.ttf') with score of 0.050000.
2026-07-21 14:55:57 runnervm3jd5f matplotlib.font_manager[2874] DEBUG findfont: Matching DejaVu Sans:style=italic:variant=normal:weight=bold:stretch=normal:size=10.0.
2026-07-21 14:55:57 runnervm3jd5f matplotlib.font_manager[2874] DEBUG findfont: score(FontEntry(fname='/home/runner/micromamba/envs/trajan/lib/python3.14/site-packages/matplotlib/mpl-data/fonts/ttf/cmmi10.ttf', index=0, name='cmmi10', style='normal', variant='normal', weight=400, stretch='normal', size='scalable')) = 11.335
2026-07-21 14:55:57 runnervm3jd5f matplotlib.font_manager[2874] DEBUG findfont: score(FontEntry(fname='/home/runner/micromamba/envs/trajan/lib/python3.14/site-packages/matplotlib/mpl-data/fonts/ttf/DejaVuSerif-Bold.ttf', index=0, name='DejaVu Serif', style='normal', variant='normal', weight=700, stretch='normal', size='scalable')) = 11.05
2026-07-21 14:55:57 runnervm3jd5f matplotlib.font_manager[2874] DEBUG findfont: score(FontEntry(fname='/home/runner/micromamba/envs/trajan/lib/python3.14/site-packages/matplotlib/mpl-data/fonts/ttf/DejaVuSans-Oblique.ttf', index=0, name='DejaVu Sans', style='oblique', variant='normal', weight=400, stretch='normal', size='scalable')) = 0.43499999999999994
2026-07-21 14:55:57 runnervm3jd5f matplotlib.font_manager[2874] DEBUG findfont: score(FontEntry(fname='/home/runner/micromamba/envs/trajan/lib/python3.14/site-packages/matplotlib/mpl-data/fonts/ttf/STIXSizThreeSymReg.ttf', index=0, name='STIXSizeThreeSym', style='normal', variant='normal', weight=400, stretch='normal', size='scalable')) = 11.335
2026-07-21 14:55:57 runnervm3jd5f matplotlib.font_manager[2874] DEBUG findfont: score(FontEntry(fname='/home/runner/micromamba/envs/trajan/lib/python3.14/site-packages/matplotlib/mpl-data/fonts/ttf/STIXNonUniBolIta.ttf', index=0, name='STIXNonUnicode', style='italic', variant='normal', weight=700, stretch='normal', size='scalable')) = 10.05
2026-07-21 14:55:57 runnervm3jd5f matplotlib.font_manager[2874] DEBUG findfont: score(FontEntry(fname='/home/runner/micromamba/envs/trajan/lib/python3.14/site-packages/matplotlib/mpl-data/fonts/ttf/DejaVuSerifDisplay.ttf', index=0, name='DejaVu Serif Display', style='normal', variant='normal', weight=400, stretch='normal', size='scalable')) = 11.335
2026-07-21 14:55:57 runnervm3jd5f matplotlib.font_manager[2874] DEBUG findfont: score(FontEntry(fname='/home/runner/micromamba/envs/trajan/lib/python3.14/site-packages/matplotlib/mpl-data/fonts/ttf/cmss10.ttf', index=0, name='cmss10', style='normal', variant='normal', weight=400, stretch='normal', size='scalable')) = 11.335
2026-07-21 14:55:57 runnervm3jd5f matplotlib.font_manager[2874] DEBUG findfont: score(FontEntry(fname='/home/runner/micromamba/envs/trajan/lib/python3.14/site-packages/matplotlib/mpl-data/fonts/ttf/STIXGeneralBolIta.ttf', index=0, name='STIXGeneral', style='italic', variant='normal', weight=700, stretch='normal', size='scalable')) = 10.05
2026-07-21 14:55:57 runnervm3jd5f matplotlib.font_manager[2874] DEBUG findfont: score(FontEntry(fname='/home/runner/micromamba/envs/trajan/lib/python3.14/site-packages/matplotlib/mpl-data/fonts/ttf/cmtt10.ttf', index=0, name='cmtt10', style='normal', variant='normal', weight=400, stretch='normal', size='scalable')) = 11.335
2026-07-21 14:55:57 runnervm3jd5f matplotlib.font_manager[2874] DEBUG findfont: score(FontEntry(fname='/home/runner/micromamba/envs/trajan/lib/python3.14/site-packages/matplotlib/mpl-data/fonts/ttf/cmsy10.ttf', index=0, name='cmsy10', style='normal', variant='normal', weight=400, stretch='normal', size='scalable')) = 11.335
2026-07-21 14:55:57 runnervm3jd5f matplotlib.font_manager[2874] DEBUG findfont: score(FontEntry(fname='/home/runner/micromamba/envs/trajan/lib/python3.14/site-packages/matplotlib/mpl-data/fonts/ttf/DejaVuSansMono-Oblique.ttf', index=0, name='DejaVu Sans Mono', style='oblique', variant='normal', weight=400, stretch='normal', size='scalable')) = 10.434999999999999
2026-07-21 14:55:57 runnervm3jd5f matplotlib.font_manager[2874] DEBUG findfont: score(FontEntry(fname='/home/runner/micromamba/envs/trajan/lib/python3.14/site-packages/matplotlib/mpl-data/fonts/ttf/STIXNonUniIta.ttf', index=0, name='STIXNonUnicode', style='italic', variant='normal', weight=400, stretch='normal', size='scalable')) = 10.335
2026-07-21 14:55:57 runnervm3jd5f matplotlib.font_manager[2874] DEBUG findfont: score(FontEntry(fname='/home/runner/micromamba/envs/trajan/lib/python3.14/site-packages/matplotlib/mpl-data/fonts/ttf/STIXGeneral.ttf', index=0, name='STIXGeneral', style='normal', variant='normal', weight=400, stretch='normal', size='scalable')) = 11.335
2026-07-21 14:55:57 runnervm3jd5f matplotlib.font_manager[2874] DEBUG findfont: score(FontEntry(fname='/home/runner/micromamba/envs/trajan/lib/python3.14/site-packages/matplotlib/mpl-data/fonts/ttf/cmti10.ttf', index=0, name='cmti10', style='normal', variant='normal', weight=400, stretch='normal', size='scalable')) = 11.335
2026-07-21 14:55:57 runnervm3jd5f matplotlib.font_manager[2874] DEBUG findfont: score(FontEntry(fname='/home/runner/micromamba/envs/trajan/lib/python3.14/site-packages/matplotlib/mpl-data/fonts/ttf/DejaVuSansMono-BoldOblique.ttf', index=0, name='DejaVu Sans Mono', style='oblique', variant='normal', weight=700, stretch='normal', size='scalable')) = 10.15
2026-07-21 14:55:57 runnervm3jd5f matplotlib.font_manager[2874] DEBUG findfont: score(FontEntry(fname='/home/runner/micromamba/envs/trajan/lib/python3.14/site-packages/matplotlib/mpl-data/fonts/ttf/DejaVuSerif.ttf', index=0, name='DejaVu Serif', style='normal', variant='normal', weight=400, stretch='normal', size='scalable')) = 11.335
2026-07-21 14:55:57 runnervm3jd5f matplotlib.font_manager[2874] DEBUG findfont: score(FontEntry(fname='/home/runner/micromamba/envs/trajan/lib/python3.14/site-packages/matplotlib/mpl-data/fonts/ttf/LastResortHE-Regular.ttf', index=0, name='Last Resort High-Efficiency', style='normal', variant='normal', weight=400, stretch='normal', size='scalable')) = 11.335
2026-07-21 14:55:57 runnervm3jd5f matplotlib.font_manager[2874] DEBUG findfont: score(FontEntry(fname='/home/runner/micromamba/envs/trajan/lib/python3.14/site-packages/matplotlib/mpl-data/fonts/ttf/cmex10.ttf', index=0, name='cmex10', style='normal', variant='normal', weight=400, stretch='normal', size='scalable')) = 11.335
2026-07-21 14:55:57 runnervm3jd5f matplotlib.font_manager[2874] DEBUG findfont: score(FontEntry(fname='/home/runner/micromamba/envs/trajan/lib/python3.14/site-packages/matplotlib/mpl-data/fonts/ttf/STIXSizFiveSymReg.ttf', index=0, name='STIXSizeFiveSym', style='normal', variant='normal', weight=400, stretch='normal', size='scalable')) = 11.335
2026-07-21 14:55:57 runnervm3jd5f matplotlib.font_manager[2874] DEBUG findfont: score(FontEntry(fname='/home/runner/micromamba/envs/trajan/lib/python3.14/site-packages/matplotlib/mpl-data/fonts/ttf/STIXNonUniBol.ttf', index=0, name='STIXNonUnicode', style='normal', variant='normal', weight=700, stretch='normal', size='scalable')) = 11.05
2026-07-21 14:55:57 runnervm3jd5f matplotlib.font_manager[2874] DEBUG findfont: score(FontEntry(fname='/home/runner/micromamba/envs/trajan/lib/python3.14/site-packages/matplotlib/mpl-data/fonts/ttf/DejaVuSansDisplay.ttf', index=0, name='DejaVu Sans Display', style='normal', variant='normal', weight=400, stretch='normal', size='scalable')) = 11.335
2026-07-21 14:55:57 runnervm3jd5f matplotlib.font_manager[2874] DEBUG findfont: score(FontEntry(fname='/home/runner/micromamba/envs/trajan/lib/python3.14/site-packages/matplotlib/mpl-data/fonts/ttf/DejaVuSansMono.ttf', index=0, name='DejaVu Sans Mono', style='normal', variant='normal', weight=400, stretch='normal', size='scalable')) = 11.335
2026-07-21 14:55:57 runnervm3jd5f matplotlib.font_manager[2874] DEBUG findfont: score(FontEntry(fname='/home/runner/micromamba/envs/trajan/lib/python3.14/site-packages/matplotlib/mpl-data/fonts/ttf/cmb10.ttf', index=0, name='cmb10', style='normal', variant='normal', weight=400, stretch='normal', size='scalable')) = 11.335
2026-07-21 14:55:57 runnervm3jd5f matplotlib.font_manager[2874] DEBUG findfont: score(FontEntry(fname='/home/runner/micromamba/envs/trajan/lib/python3.14/site-packages/matplotlib/mpl-data/fonts/ttf/STIXSizTwoSymReg.ttf', index=0, name='STIXSizeTwoSym', style='normal', variant='normal', weight=400, stretch='normal', size='scalable')) = 11.335
2026-07-21 14:55:57 runnervm3jd5f matplotlib.font_manager[2874] DEBUG findfont: score(FontEntry(fname='/home/runner/micromamba/envs/trajan/lib/python3.14/site-packages/matplotlib/mpl-data/fonts/ttf/DejaVuSans.ttf', index=0, name='DejaVu Sans', style='normal', variant='normal', weight=400, stretch='normal', size='scalable')) = 1.335
2026-07-21 14:55:57 runnervm3jd5f matplotlib.font_manager[2874] DEBUG findfont: score(FontEntry(fname='/home/runner/micromamba/envs/trajan/lib/python3.14/site-packages/matplotlib/mpl-data/fonts/ttf/STIXNonUni.ttf', index=0, name='STIXNonUnicode', style='normal', variant='normal', weight=400, stretch='normal', size='scalable')) = 11.335
2026-07-21 14:55:57 runnervm3jd5f matplotlib.font_manager[2874] DEBUG findfont: score(FontEntry(fname='/home/runner/micromamba/envs/trajan/lib/python3.14/site-packages/matplotlib/mpl-data/fonts/ttf/STIXGeneralItalic.ttf', index=0, name='STIXGeneral', style='italic', variant='normal', weight=400, stretch='normal', size='scalable')) = 10.335
2026-07-21 14:55:57 runnervm3jd5f matplotlib.font_manager[2874] DEBUG findfont: score(FontEntry(fname='/home/runner/micromamba/envs/trajan/lib/python3.14/site-packages/matplotlib/mpl-data/fonts/ttf/STIXSizOneSymBol.ttf', index=0, name='STIXSizeOneSym', style='normal', variant='normal', weight=700, stretch='normal', size='scalable')) = 11.05
2026-07-21 14:55:57 runnervm3jd5f matplotlib.font_manager[2874] DEBUG findfont: score(FontEntry(fname='/home/runner/micromamba/envs/trajan/lib/python3.14/site-packages/matplotlib/mpl-data/fonts/ttf/DejaVuSansMono-Bold.ttf', index=0, name='DejaVu Sans Mono', style='normal', variant='normal', weight=700, stretch='normal', size='scalable')) = 11.05
2026-07-21 14:55:57 runnervm3jd5f matplotlib.font_manager[2874] DEBUG findfont: score(FontEntry(fname='/home/runner/micromamba/envs/trajan/lib/python3.14/site-packages/matplotlib/mpl-data/fonts/ttf/STIXSizTwoSymBol.ttf', index=0, name='STIXSizeTwoSym', style='normal', variant='normal', weight=700, stretch='normal', size='scalable')) = 11.05
2026-07-21 14:55:57 runnervm3jd5f matplotlib.font_manager[2874] DEBUG findfont: score(FontEntry(fname='/home/runner/micromamba/envs/trajan/lib/python3.14/site-packages/matplotlib/mpl-data/fonts/ttf/STIXSizThreeSymBol.ttf', index=0, name='STIXSizeThreeSym', style='normal', variant='normal', weight=700, stretch='normal', size='scalable')) = 11.05
2026-07-21 14:55:57 runnervm3jd5f matplotlib.font_manager[2874] DEBUG findfont: score(FontEntry(fname='/home/runner/micromamba/envs/trajan/lib/python3.14/site-packages/matplotlib/mpl-data/fonts/ttf/DejaVuSerif-BoldItalic.ttf', index=0, name='DejaVu Serif', style='italic', variant='normal', weight=700, stretch='normal', size='scalable')) = 10.05
2026-07-21 14:55:57 runnervm3jd5f matplotlib.font_manager[2874] DEBUG findfont: score(FontEntry(fname='/home/runner/micromamba/envs/trajan/lib/python3.14/site-packages/matplotlib/mpl-data/fonts/ttf/DejaVuSerif-Italic.ttf', index=0, name='DejaVu Serif', style='italic', variant='normal', weight=400, stretch='normal', size='scalable')) = 10.335
2026-07-21 14:55:57 runnervm3jd5f matplotlib.font_manager[2874] DEBUG findfont: score(FontEntry(fname='/home/runner/micromamba/envs/trajan/lib/python3.14/site-packages/matplotlib/mpl-data/fonts/ttf/DejaVuSans-Bold.ttf', index=0, name='DejaVu Sans', style='normal', variant='normal', weight=700, stretch='normal', size='scalable')) = 1.05
2026-07-21 14:55:57 runnervm3jd5f matplotlib.font_manager[2874] DEBUG findfont: score(FontEntry(fname='/home/runner/micromamba/envs/trajan/lib/python3.14/site-packages/matplotlib/mpl-data/fonts/ttf/STIXSizFourSymBol.ttf', index=0, name='STIXSizeFourSym', style='normal', variant='normal', weight=700, stretch='normal', size='scalable')) = 11.05
2026-07-21 14:55:57 runnervm3jd5f matplotlib.font_manager[2874] DEBUG findfont: score(FontEntry(fname='/home/runner/micromamba/envs/trajan/lib/python3.14/site-packages/matplotlib/mpl-data/fonts/ttf/STIXSizOneSymReg.ttf', index=0, name='STIXSizeOneSym', style='normal', variant='normal', weight=400, stretch='normal', size='scalable')) = 11.335
2026-07-21 14:55:57 runnervm3jd5f matplotlib.font_manager[2874] DEBUG findfont: score(FontEntry(fname='/home/runner/micromamba/envs/trajan/lib/python3.14/site-packages/matplotlib/mpl-data/fonts/ttf/cmr10.ttf', index=0, name='cmr10', style='normal', variant='normal', weight=400, stretch='normal', size='scalable')) = 11.335
2026-07-21 14:55:57 runnervm3jd5f matplotlib.font_manager[2874] DEBUG findfont: score(FontEntry(fname='/home/runner/micromamba/envs/trajan/lib/python3.14/site-packages/matplotlib/mpl-data/fonts/ttf/STIXGeneralBol.ttf', index=0, name='STIXGeneral', style='normal', variant='normal', weight=700, stretch='normal', size='scalable')) = 11.05
2026-07-21 14:55:57 runnervm3jd5f matplotlib.font_manager[2874] DEBUG findfont: score(FontEntry(fname='/home/runner/micromamba/envs/trajan/lib/python3.14/site-packages/matplotlib/mpl-data/fonts/ttf/DejaVuSans-BoldOblique.ttf', index=0, name='DejaVu Sans', style='oblique', variant='normal', weight=700, stretch='normal', size='scalable')) = 0.15000000000000002
2026-07-21 14:55:57 runnervm3jd5f matplotlib.font_manager[2874] DEBUG findfont: score(FontEntry(fname='/home/runner/micromamba/envs/trajan/lib/python3.14/site-packages/matplotlib/mpl-data/fonts/ttf/STIXSizFourSymReg.ttf', index=0, name='STIXSizeFourSym', style='normal', variant='normal', weight=400, stretch='normal', size='scalable')) = 11.335
2026-07-21 14:55:57 runnervm3jd5f matplotlib.font_manager[2874] DEBUG findfont: score(FontEntry(fname='/usr/share/fonts/truetype/lato/Lato-Black.ttf', index=0, name='Lato', style='normal', variant='normal', weight=900, stretch='normal', size='scalable')) = 11.24
2026-07-21 14:55:57 runnervm3jd5f matplotlib.font_manager[2874] DEBUG findfont: score(FontEntry(fname='/usr/share/fonts/truetype/lato/Lato-Black.ttf', index=0, name='Lato Black', style='normal', variant='normal', weight=400, stretch='normal', size='scalable')) = 11.335
2026-07-21 14:55:57 runnervm3jd5f matplotlib.font_manager[2874] DEBUG findfont: score(FontEntry(fname='/usr/share/fonts/truetype/liberation/LiberationSerif-Regular.ttf', index=0, name='Liberation Serif', style='normal', variant='normal', weight=400, stretch='normal', size='scalable')) = 11.335
2026-07-21 14:55:57 runnervm3jd5f matplotlib.font_manager[2874] DEBUG findfont: score(FontEntry(fname='/usr/share/fonts/truetype/dejavu/DejaVuSerifCondensed.ttf', index=0, name='DejaVu Serif', style='normal', variant='normal', weight=400, stretch='condensed', size='scalable')) = 11.535
2026-07-21 14:55:57 runnervm3jd5f matplotlib.font_manager[2874] DEBUG findfont: score(FontEntry(fname='/usr/share/fonts/truetype/dejavu/DejaVuSerifCondensed.ttf', index=0, name='DejaVu Serif Condensed', style='normal', variant='normal', weight=380, stretch='condensed', size='scalable')) = 11.553999999999998
2026-07-21 14:55:57 runnervm3jd5f matplotlib.font_manager[2874] DEBUG findfont: score(FontEntry(fname='/home/runner/micromamba/envs/trajan/fonts/UbuntuMono-BI.ttf', index=0, name='Ubuntu Mono', style='italic', variant='normal', weight=700, stretch='normal', size='scalable')) = 10.05
2026-07-21 14:55:57 runnervm3jd5f matplotlib.font_manager[2874] DEBUG findfont: score(FontEntry(fname='/usr/share/fonts/truetype/dejavu/DejaVuSans.ttf', index=0, name='DejaVu Sans', style='normal', variant='normal', weight=400, stretch='normal', size='scalable')) = 1.335
2026-07-21 14:55:57 runnervm3jd5f matplotlib.font_manager[2874] DEBUG findfont: score(FontEntry(fname='/usr/share/fonts/truetype/lato/Lato-Italic.ttf', index=0, name='Lato', style='italic', variant='normal', weight=400, stretch='normal', size='scalable')) = 10.335
2026-07-21 14:55:57 runnervm3jd5f matplotlib.font_manager[2874] DEBUG findfont: score(FontEntry(fname='/usr/share/fonts/truetype/liberation/LiberationSans-Italic.ttf', index=0, name='Liberation Sans', style='italic', variant='normal', weight=400, stretch='normal', size='scalable')) = 10.335
2026-07-21 14:55:57 runnervm3jd5f matplotlib.font_manager[2874] DEBUG findfont: score(FontEntry(fname='/home/runner/micromamba/envs/trajan/fonts/Ubuntu-B.ttf', index=0, name='Ubuntu', style='normal', variant='normal', weight=700, stretch='normal', size='scalable')) = 11.05
2026-07-21 14:55:57 runnervm3jd5f matplotlib.font_manager[2874] DEBUG findfont: score(FontEntry(fname='/home/runner/micromamba/envs/trajan/fonts/SourceCodePro-Semibold.ttf', index=0, name='Source Code Pro', style='normal', variant='normal', weight=600, stretch='normal', size='scalable')) = 11.145
2026-07-21 14:55:57 runnervm3jd5f matplotlib.font_manager[2874] DEBUG findfont: score(FontEntry(fname='/home/runner/micromamba/envs/trajan/fonts/SourceCodePro-Semibold.ttf', index=0, name='Source Code Pro Semibold', style='normal', variant='normal', weight=400, stretch='normal', size='scalable')) = 11.335
2026-07-21 14:55:57 runnervm3jd5f matplotlib.font_manager[2874] DEBUG findfont: score(FontEntry(fname='/home/runner/micromamba/envs/trajan/fonts/SourceCodePro-Bold.ttf', index=0, name='Source Code Pro', style='normal', variant='normal', weight=700, stretch='normal', size='scalable')) = 11.05
2026-07-21 14:55:57 runnervm3jd5f matplotlib.font_manager[2874] DEBUG findfont: score(FontEntry(fname='/home/runner/micromamba/envs/trajan/fonts/Ubuntu-MI.ttf', index=0, name='Ubuntu', style='italic', variant='normal', weight=500, stretch='normal', size='scalable')) = 10.24
2026-07-21 14:55:57 runnervm3jd5f matplotlib.font_manager[2874] DEBUG findfont: score(FontEntry(fname='/home/runner/micromamba/envs/trajan/fonts/Ubuntu-MI.ttf', index=0, name='Ubuntu Light', style='italic', variant='normal', weight=700, stretch='normal', size='scalable')) = 10.05
2026-07-21 14:55:57 runnervm3jd5f matplotlib.font_manager[2874] DEBUG findfont: score(FontEntry(fname='/usr/share/fonts/truetype/lato/Lato-Regular.ttf', index=0, name='Lato', style='normal', variant='normal', weight=400, stretch='normal', size='scalable')) = 11.335
2026-07-21 14:55:57 runnervm3jd5f matplotlib.font_manager[2874] DEBUG findfont: score(FontEntry(fname='/usr/share/fonts/truetype/lato/Lato-ThinItalic.ttf', index=0, name='Lato', style='italic', variant='normal', weight=275, stretch='normal', size='scalable')) = 10.45375
2026-07-21 14:55:57 runnervm3jd5f matplotlib.font_manager[2874] DEBUG findfont: score(FontEntry(fname='/usr/share/fonts/truetype/lato/Lato-ThinItalic.ttf', index=0, name='Lato Thin', style='italic', variant='normal', weight=400, stretch='normal', size='scalable')) = 10.335
2026-07-21 14:55:57 runnervm3jd5f matplotlib.font_manager[2874] DEBUG findfont: score(FontEntry(fname='/usr/share/fonts/truetype/lato/Lato-BlackItalic.ttf', index=0, name='Lato', style='italic', variant='normal', weight=900, stretch='normal', size='scalable')) = 10.24
2026-07-21 14:55:57 runnervm3jd5f matplotlib.font_manager[2874] DEBUG findfont: score(FontEntry(fname='/usr/share/fonts/truetype/lato/Lato-BlackItalic.ttf', index=0, name='Lato Black', style='italic', variant='normal', weight=400, stretch='normal', size='scalable')) = 10.335
2026-07-21 14:55:57 runnervm3jd5f matplotlib.font_manager[2874] DEBUG findfont: score(FontEntry(fname='/usr/share/fonts/truetype/dejavu/DejaVuSerifCondensed-Italic.ttf', index=0, name='DejaVu Serif', style='italic', variant='normal', weight=400, stretch='condensed', size='scalable')) = 10.535
2026-07-21 14:55:57 runnervm3jd5f matplotlib.font_manager[2874] DEBUG findfont: score(FontEntry(fname='/usr/share/fonts/truetype/dejavu/DejaVuSerifCondensed-Italic.ttf', index=0, name='DejaVu Serif Condensed', style='italic', variant='normal', weight=400, stretch='condensed', size='scalable')) = 10.535
2026-07-21 14:55:57 runnervm3jd5f matplotlib.font_manager[2874] DEBUG findfont: score(FontEntry(fname='/usr/share/fonts/truetype/dejavu/DejaVuSans-Bold.ttf', index=0, name='DejaVu Sans', style='normal', variant='normal', weight=700, stretch='normal', size='scalable')) = 1.05
2026-07-21 14:55:57 runnervm3jd5f matplotlib.font_manager[2874] DEBUG findfont: score(FontEntry(fname='/home/runner/micromamba/envs/trajan/fonts/UbuntuMono-R.ttf', index=0, name='Ubuntu Mono', style='normal', variant='normal', weight=400, stretch='normal', size='scalable')) = 11.335
2026-07-21 14:55:57 runnervm3jd5f matplotlib.font_manager[2874] DEBUG findfont: score(FontEntry(fname='/usr/share/fonts/truetype/dejavu/DejaVuSerif-BoldItalic.ttf', index=0, name='DejaVu Serif', style='italic', variant='normal', weight=700, stretch='normal', size='scalable')) = 10.05
2026-07-21 14:55:57 runnervm3jd5f matplotlib.font_manager[2874] DEBUG findfont: score(FontEntry(fname='/usr/share/fonts/truetype/lato/Lato-Hairline.ttf', index=0, name='Lato', style='normal', variant='normal', weight=250, stretch='normal', size='scalable')) = 11.4775
2026-07-21 14:55:57 runnervm3jd5f matplotlib.font_manager[2874] DEBUG findfont: score(FontEntry(fname='/usr/share/fonts/truetype/lato/Lato-Hairline.ttf', index=0, name='Lato Hairline', style='normal', variant='normal', weight=400, stretch='normal', size='scalable')) = 11.335
2026-07-21 14:55:57 runnervm3jd5f matplotlib.font_manager[2874] DEBUG findfont: score(FontEntry(fname='/usr/share/fonts/truetype/lato/Lato-LightItalic.ttf', index=0, name='Lato', style='italic', variant='normal', weight=300, stretch='normal', size='scalable')) = 10.43
2026-07-21 14:55:57 runnervm3jd5f matplotlib.font_manager[2874] DEBUG findfont: score(FontEntry(fname='/usr/share/fonts/truetype/lato/Lato-LightItalic.ttf', index=0, name='Lato Light', style='italic', variant='normal', weight=400, stretch='normal', size='scalable')) = 10.335
2026-07-21 14:55:57 runnervm3jd5f matplotlib.font_manager[2874] DEBUG findfont: score(FontEntry(fname='/usr/share/fonts/truetype/dejavu/DejaVuSansCondensed-BoldOblique.ttf', index=0, name='DejaVu Sans', style='oblique', variant='normal', weight=700, stretch='condensed', size='scalable')) = 0.35000000000000003
2026-07-21 14:55:57 runnervm3jd5f matplotlib.font_manager[2874] DEBUG findfont: score(FontEntry(fname='/usr/share/fonts/truetype/dejavu/DejaVuSansCondensed-BoldOblique.ttf', index=0, name='DejaVu Sans Condensed', style='oblique', variant='normal', weight=700, stretch='condensed', size='scalable')) = 10.35
2026-07-21 14:55:57 runnervm3jd5f matplotlib.font_manager[2874] DEBUG findfont: score(FontEntry(fname='/home/runner/micromamba/envs/trajan/fonts/SourceCodePro-It.ttf', index=0, name='Source Code Pro', style='italic', variant='normal', weight=400, stretch='normal', size='scalable')) = 10.335
2026-07-21 14:55:57 runnervm3jd5f matplotlib.font_manager[2874] DEBUG findfont: score(FontEntry(fname='/home/runner/micromamba/envs/trajan/fonts/SourceCodePro-ExtraLightIt.ttf', index=0, name='Source Code Pro', style='italic', variant='normal', weight=200, stretch='normal', size='scalable')) = 10.525
2026-07-21 14:55:57 runnervm3jd5f matplotlib.font_manager[2874] DEBUG findfont: score(FontEntry(fname='/home/runner/micromamba/envs/trajan/fonts/SourceCodePro-ExtraLightIt.ttf', index=0, name='Source Code Pro ExtraLight', style='italic', variant='normal', weight=400, stretch='normal', size='scalable')) = 10.335
2026-07-21 14:55:57 runnervm3jd5f matplotlib.font_manager[2874] DEBUG findfont: score(FontEntry(fname='/usr/share/fonts/truetype/lato/Lato-Medium.ttf', index=0, name='Lato', style='normal', variant='normal', weight=500, stretch='normal', size='scalable')) = 11.24
2026-07-21 14:55:57 runnervm3jd5f matplotlib.font_manager[2874] DEBUG findfont: score(FontEntry(fname='/usr/share/fonts/truetype/lato/Lato-Medium.ttf', index=0, name='Lato Medium', style='normal', variant='normal', weight=400, stretch='normal', size='scalable')) = 11.335
2026-07-21 14:55:57 runnervm3jd5f matplotlib.font_manager[2874] DEBUG findfont: score(FontEntry(fname='/usr/share/fonts/truetype/lato/Lato-BoldItalic.ttf', index=0, name='Lato', style='italic', variant='normal', weight=700, stretch='normal', size='scalable')) = 10.05
2026-07-21 14:55:57 runnervm3jd5f matplotlib.font_manager[2874] DEBUG findfont: score(FontEntry(fname='/home/runner/micromamba/envs/trajan/fonts/DejaVuSans.ttf', index=0, name='DejaVu Sans', style='normal', variant='normal', weight=400, stretch='normal', size='scalable')) = 1.335
2026-07-21 14:55:57 runnervm3jd5f matplotlib.font_manager[2874] DEBUG findfont: score(FontEntry(fname='/home/runner/micromamba/envs/trajan/fonts/UbuntuMono-B.ttf', index=0, name='Ubuntu Mono', style='normal', variant='normal', weight=700, stretch='normal', size='scalable')) = 11.05
2026-07-21 14:55:57 runnervm3jd5f matplotlib.font_manager[2874] DEBUG findfont: score(FontEntry(fname='/home/runner/micromamba/envs/trajan/fonts/SourceCodePro-LightIt.ttf', index=0, name='Source Code Pro', style='italic', variant='normal', weight=300, stretch='normal', size='scalable')) = 10.43
2026-07-21 14:55:57 runnervm3jd5f matplotlib.font_manager[2874] DEBUG findfont: score(FontEntry(fname='/home/runner/micromamba/envs/trajan/fonts/SourceCodePro-LightIt.ttf', index=0, name='Source Code Pro Light', style='italic', variant='normal', weight=400, stretch='normal', size='scalable')) = 10.335
2026-07-21 14:55:57 runnervm3jd5f matplotlib.font_manager[2874] DEBUG findfont: score(FontEntry(fname='/usr/share/fonts/truetype/liberation/LiberationSans-BoldItalic.ttf', index=0, name='Liberation Sans', style='italic', variant='normal', weight=700, stretch='normal', size='scalable')) = 10.05
2026-07-21 14:55:57 runnervm3jd5f matplotlib.font_manager[2874] DEBUG findfont: score(FontEntry(fname='/usr/share/fonts/truetype/liberation/LiberationSans-Regular.ttf', index=0, name='Liberation Sans', style='normal', variant='normal', weight=400, stretch='normal', size='scalable')) = 11.335
2026-07-21 14:55:57 runnervm3jd5f matplotlib.font_manager[2874] DEBUG findfont: score(FontEntry(fname='/usr/share/fonts/truetype/dejavu/DejaVuSansMono-Bold.ttf', index=0, name='DejaVu Sans Mono', style='normal', variant='normal', weight=700, stretch='normal', size='scalable')) = 11.05
2026-07-21 14:55:57 runnervm3jd5f matplotlib.font_manager[2874] DEBUG findfont: score(FontEntry(fname='/home/runner/micromamba/envs/trajan/fonts/SourceCodePro-BoldIt.ttf', index=0, name='Source Code Pro', style='italic', variant='normal', weight=700, stretch='normal', size='scalable')) = 10.05
2026-07-21 14:55:57 runnervm3jd5f matplotlib.font_manager[2874] DEBUG findfont: score(FontEntry(fname='/usr/share/fonts/truetype/lato/Lato-Bold.ttf', index=0, name='Lato', style='normal', variant='normal', weight=700, stretch='normal', size='scalable')) = 11.05
2026-07-21 14:55:57 runnervm3jd5f matplotlib.font_manager[2874] DEBUG findfont: score(FontEntry(fname='/usr/share/fonts/truetype/dejavu/DejaVuSansCondensed.ttf', index=0, name='DejaVu Sans', style='normal', variant='normal', weight=400, stretch='condensed', size='scalable')) = 1.535
2026-07-21 14:55:57 runnervm3jd5f matplotlib.font_manager[2874] DEBUG findfont: score(FontEntry(fname='/usr/share/fonts/truetype/dejavu/DejaVuSansCondensed.ttf', index=0, name='DejaVu Sans Condensed', style='normal', variant='normal', weight=380, stretch='condensed', size='scalable')) = 11.553999999999998
2026-07-21 14:55:57 runnervm3jd5f matplotlib.font_manager[2874] DEBUG findfont: score(FontEntry(fname='/usr/share/fonts/truetype/lato/Lato-MediumItalic.ttf', index=0, name='Lato', style='italic', variant='normal', weight=500, stretch='normal', size='scalable')) = 10.24
2026-07-21 14:55:57 runnervm3jd5f matplotlib.font_manager[2874] DEBUG findfont: score(FontEntry(fname='/usr/share/fonts/truetype/lato/Lato-MediumItalic.ttf', index=0, name='Lato Medium', style='italic', variant='normal', weight=400, stretch='normal', size='scalable')) = 10.335
2026-07-21 14:55:57 runnervm3jd5f matplotlib.font_manager[2874] DEBUG findfont: score(FontEntry(fname='/usr/share/fonts/truetype/liberation/LiberationSans-Bold.ttf', index=0, name='Liberation Sans', style='normal', variant='normal', weight=700, stretch='normal', size='scalable')) = 11.05
2026-07-21 14:55:57 runnervm3jd5f matplotlib.font_manager[2874] DEBUG findfont: score(FontEntry(fname='/usr/share/fonts/truetype/dejavu/DejaVuSerifCondensed-BoldItalic.ttf', index=0, name='DejaVu Serif', style='italic', variant='normal', weight=700, stretch='condensed', size='scalable')) = 10.25
2026-07-21 14:55:57 runnervm3jd5f matplotlib.font_manager[2874] DEBUG findfont: score(FontEntry(fname='/usr/share/fonts/truetype/dejavu/DejaVuSerifCondensed-BoldItalic.ttf', index=0, name='DejaVu Serif Condensed', style='italic', variant='normal', weight=700, stretch='condensed', size='scalable')) = 10.25
2026-07-21 14:55:57 runnervm3jd5f matplotlib.font_manager[2874] DEBUG findfont: score(FontEntry(fname='/home/runner/micromamba/envs/trajan/fonts/Ubuntu-R.ttf', index=0, name='Ubuntu', style='normal', variant='normal', weight=400, stretch='normal', size='scalable')) = 11.335
2026-07-21 14:55:57 runnervm3jd5f matplotlib.font_manager[2874] DEBUG findfont: score(FontEntry(fname='/usr/share/fonts/truetype/lato/Lato-Light.ttf', index=0, name='Lato', style='normal', variant='normal', weight=300, stretch='normal', size='scalable')) = 11.43
2026-07-21 14:55:57 runnervm3jd5f matplotlib.font_manager[2874] DEBUG findfont: score(FontEntry(fname='/usr/share/fonts/truetype/lato/Lato-Light.ttf', index=0, name='Lato Light', style='normal', variant='normal', weight=400, stretch='normal', size='scalable')) = 11.335
2026-07-21 14:55:57 runnervm3jd5f matplotlib.font_manager[2874] DEBUG findfont: score(FontEntry(fname='/usr/share/fonts/truetype/liberation/LiberationSerif-BoldItalic.ttf', index=0, name='Liberation Serif', style='italic', variant='normal', weight=700, stretch='normal', size='scalable')) = 10.05
2026-07-21 14:55:57 runnervm3jd5f matplotlib.font_manager[2874] DEBUG findfont: score(FontEntry(fname='/home/runner/micromamba/envs/trajan/fonts/Ubuntu-Th.ttf', index=0, name='Ubuntu', style='normal', variant='normal', weight=250, stretch='normal', size='scalable')) = 11.4775
2026-07-21 14:55:57 runnervm3jd5f matplotlib.font_manager[2874] DEBUG findfont: score(FontEntry(fname='/home/runner/micromamba/envs/trajan/fonts/Ubuntu-Th.ttf', index=0, name='Ubuntu Thin', style='normal', variant='normal', weight=400, stretch='normal', size='scalable')) = 11.335
2026-07-21 14:55:57 runnervm3jd5f matplotlib.font_manager[2874] DEBUG findfont: score(FontEntry(fname='/home/runner/micromamba/envs/trajan/fonts/SourceCodePro-ExtraLight.ttf', index=0, name='Source Code Pro', style='normal', variant='normal', weight=200, stretch='normal', size='scalable')) = 11.525
2026-07-21 14:55:57 runnervm3jd5f matplotlib.font_manager[2874] DEBUG findfont: score(FontEntry(fname='/home/runner/micromamba/envs/trajan/fonts/SourceCodePro-ExtraLight.ttf', index=0, name='Source Code Pro ExtraLight', style='normal', variant='normal', weight=400, stretch='normal', size='scalable')) = 11.335
2026-07-21 14:55:57 runnervm3jd5f matplotlib.font_manager[2874] DEBUG findfont: score(FontEntry(fname='/usr/share/fonts/truetype/lato/Lato-Thin.ttf', index=0, name='Lato', style='normal', variant='normal', weight=275, stretch='normal', size='scalable')) = 11.45375
2026-07-21 14:55:57 runnervm3jd5f matplotlib.font_manager[2874] DEBUG findfont: score(FontEntry(fname='/usr/share/fonts/truetype/lato/Lato-Thin.ttf', index=0, name='Lato Thin', style='normal', variant='normal', weight=400, stretch='normal', size='scalable')) = 11.335
2026-07-21 14:55:57 runnervm3jd5f matplotlib.font_manager[2874] DEBUG findfont: score(FontEntry(fname='/usr/share/fonts/truetype/liberation/LiberationSerif-Bold.ttf', index=0, name='Liberation Serif', style='normal', variant='normal', weight=700, stretch='normal', size='scalable')) = 11.05
2026-07-21 14:55:57 runnervm3jd5f matplotlib.font_manager[2874] DEBUG findfont: score(FontEntry(fname='/home/runner/micromamba/envs/trajan/fonts/Inconsolata-Regular.ttf', index=0, name='Inconsolata', style='normal', variant='normal', weight=400, stretch='normal', size='scalable')) = 11.335
2026-07-21 14:55:57 runnervm3jd5f matplotlib.font_manager[2874] DEBUG findfont: score(FontEntry(fname='/home/runner/micromamba/envs/trajan/fonts/Ubuntu-C.ttf', index=0, name='Ubuntu Condensed', style='normal', variant='normal', weight=400, stretch='condensed', size='scalable')) = 11.535
2026-07-21 14:55:57 runnervm3jd5f matplotlib.font_manager[2874] DEBUG findfont: score(FontEntry(fname='/usr/share/fonts/truetype/dejavu/DejaVuSansCondensed-Bold.ttf', index=0, name='DejaVu Sans', style='normal', variant='normal', weight=700, stretch='condensed', size='scalable')) = 1.25
2026-07-21 14:55:57 runnervm3jd5f matplotlib.font_manager[2874] DEBUG findfont: score(FontEntry(fname='/usr/share/fonts/truetype/dejavu/DejaVuSansCondensed-Bold.ttf', index=0, name='DejaVu Sans Condensed', style='normal', variant='normal', weight=700, stretch='condensed', size='scalable')) = 11.25
2026-07-21 14:55:57 runnervm3jd5f matplotlib.font_manager[2874] DEBUG findfont: score(FontEntry(fname='/usr/share/fonts/truetype/liberation/LiberationMono-Bold.ttf', index=0, name='Liberation Mono', style='normal', variant='normal', weight=700, stretch='normal', size='scalable')) = 11.05
2026-07-21 14:55:57 runnervm3jd5f matplotlib.font_manager[2874] DEBUG findfont: score(FontEntry(fname='/home/runner/micromamba/envs/trajan/fonts/SourceCodePro-Black.ttf', index=0, name='Source Code Pro', style='normal', variant='normal', weight=900, stretch='normal', size='scalable')) = 11.24
2026-07-21 14:55:57 runnervm3jd5f matplotlib.font_manager[2874] DEBUG findfont: score(FontEntry(fname='/home/runner/micromamba/envs/trajan/fonts/SourceCodePro-Black.ttf', index=0, name='Source Code Pro Black', style='normal', variant='normal', weight=400, stretch='normal', size='scalable')) = 11.335
2026-07-21 14:55:57 runnervm3jd5f matplotlib.font_manager[2874] DEBUG findfont: score(FontEntry(fname='/home/runner/micromamba/envs/trajan/fonts/SourceCodePro-BlackIt.ttf', index=0, name='Source Code Pro', style='italic', variant='normal', weight=900, stretch='normal', size='scalable')) = 10.24
2026-07-21 14:55:57 runnervm3jd5f matplotlib.font_manager[2874] DEBUG findfont: score(FontEntry(fname='/home/runner/micromamba/envs/trajan/fonts/SourceCodePro-BlackIt.ttf', index=0, name='Source Code Pro Black', style='italic', variant='normal', weight=400, stretch='normal', size='scalable')) = 10.335
2026-07-21 14:55:57 runnervm3jd5f matplotlib.font_manager[2874] DEBUG findfont: score(FontEntry(fname='/home/runner/micromamba/envs/trajan/fonts/Ubuntu-LI.ttf', index=0, name='Ubuntu', style='italic', variant='normal', weight=300, stretch='normal', size='scalable')) = 10.43
2026-07-21 14:55:57 runnervm3jd5f matplotlib.font_manager[2874] DEBUG findfont: score(FontEntry(fname='/home/runner/micromamba/envs/trajan/fonts/Ubuntu-LI.ttf', index=0, name='Ubuntu Light', style='italic', variant='normal', weight=400, stretch='normal', size='scalable')) = 10.335
2026-07-21 14:55:57 runnervm3jd5f matplotlib.font_manager[2874] DEBUG findfont: score(FontEntry(fname='/usr/share/fonts/truetype/liberation/LiberationMono-Regular.ttf', index=0, name='Liberation Mono', style='normal', variant='normal', weight=400, stretch='normal', size='scalable')) = 11.335
2026-07-21 14:55:57 runnervm3jd5f matplotlib.font_manager[2874] DEBUG findfont: score(FontEntry(fname='/home/runner/micromamba/envs/trajan/fonts/UbuntuMono-RI.ttf', index=0, name='Ubuntu Mono', style='italic', variant='normal', weight=400, stretch='normal', size='scalable')) = 10.335
2026-07-21 14:55:57 runnervm3jd5f matplotlib.font_manager[2874] DEBUG findfont: score(FontEntry(fname='/usr/share/fonts/truetype/lato/Lato-Heavy.ttf', index=0, name='Lato', style='normal', variant='normal', weight=800, stretch='normal', size='scalable')) = 11.145
2026-07-21 14:55:57 runnervm3jd5f matplotlib.font_manager[2874] DEBUG findfont: score(FontEntry(fname='/usr/share/fonts/truetype/lato/Lato-Heavy.ttf', index=0, name='Lato Heavy', style='normal', variant='normal', weight=400, stretch='normal', size='scalable')) = 11.335
2026-07-21 14:55:57 runnervm3jd5f matplotlib.font_manager[2874] DEBUG findfont: score(FontEntry(fname='/usr/share/fonts/truetype/lato/Lato-HairlineItalic.ttf', index=0, name='Lato', style='italic', variant='normal', weight=250, stretch='normal', size='scalable')) = 10.4775
2026-07-21 14:55:57 runnervm3jd5f matplotlib.font_manager[2874] DEBUG findfont: score(FontEntry(fname='/usr/share/fonts/truetype/lato/Lato-HairlineItalic.ttf', index=0, name='Lato Hairline', style='italic', variant='normal', weight=400, stretch='normal', size='scalable')) = 10.335
2026-07-21 14:55:57 runnervm3jd5f matplotlib.font_manager[2874] DEBUG findfont: score(FontEntry(fname='/usr/share/fonts/truetype/dejavu/DejaVuSerifCondensed-Bold.ttf', index=0, name='DejaVu Serif', style='normal', variant='normal', weight=700, stretch='condensed', size='scalable')) = 11.25
2026-07-21 14:55:57 runnervm3jd5f matplotlib.font_manager[2874] DEBUG findfont: score(FontEntry(fname='/usr/share/fonts/truetype/dejavu/DejaVuSerifCondensed-Bold.ttf', index=0, name='DejaVu Serif Condensed', style='normal', variant='normal', weight=700, stretch='condensed', size='scalable')) = 11.25
2026-07-21 14:55:57 runnervm3jd5f matplotlib.font_manager[2874] DEBUG findfont: score(FontEntry(fname='/usr/share/fonts/truetype/dejavu/DejaVuSansCondensed-Oblique.ttf', index=0, name='DejaVu Sans', style='oblique', variant='normal', weight=400, stretch='condensed', size='scalable')) = 0.635
2026-07-21 14:55:57 runnervm3jd5f matplotlib.font_manager[2874] DEBUG findfont: score(FontEntry(fname='/usr/share/fonts/truetype/dejavu/DejaVuSansCondensed-Oblique.ttf', index=0, name='DejaVu Sans Condensed', style='oblique', variant='normal', weight=400, stretch='condensed', size='scalable')) = 10.634999999999998
2026-07-21 14:55:57 runnervm3jd5f matplotlib.font_manager[2874] DEBUG findfont: score(FontEntry(fname='/usr/share/fonts/truetype/lato/Lato-SemiboldItalic.ttf', index=0, name='Lato', style='italic', variant='normal', weight=600, stretch='normal', size='scalable')) = 10.145
2026-07-21 14:55:57 runnervm3jd5f matplotlib.font_manager[2874] DEBUG findfont: score(FontEntry(fname='/usr/share/fonts/truetype/lato/Lato-SemiboldItalic.ttf', index=0, name='Lato Semibold', style='italic', variant='normal', weight=400, stretch='normal', size='scalable')) = 10.335
2026-07-21 14:55:57 runnervm3jd5f matplotlib.font_manager[2874] DEBUG findfont: score(FontEntry(fname='/usr/share/fonts/truetype/lato/Lato-Semibold.ttf', index=0, name='Lato', style='normal', variant='normal', weight=600, stretch='normal', size='scalable')) = 11.145
2026-07-21 14:55:57 runnervm3jd5f matplotlib.font_manager[2874] DEBUG findfont: score(FontEntry(fname='/usr/share/fonts/truetype/lato/Lato-Semibold.ttf', index=0, name='Lato Semibold', style='normal', variant='normal', weight=400, stretch='normal', size='scalable')) = 11.335
2026-07-21 14:55:57 runnervm3jd5f matplotlib.font_manager[2874] DEBUG findfont: score(FontEntry(fname='/home/runner/micromamba/envs/trajan/fonts/Inconsolata-Bold.ttf', index=0, name='Inconsolata', style='normal', variant='normal', weight=700, stretch='normal', size='scalable')) = 11.05
2026-07-21 14:55:57 runnervm3jd5f matplotlib.font_manager[2874] DEBUG findfont: score(FontEntry(fname='/usr/share/fonts/truetype/dejavu/DejaVuSans-ExtraLight.ttf', index=0, name='DejaVu Sans', style='normal', variant='normal', weight=200, stretch='normal', size='scalable')) = 1.525
2026-07-21 14:55:57 runnervm3jd5f matplotlib.font_manager[2874] DEBUG findfont: score(FontEntry(fname='/usr/share/fonts/truetype/dejavu/DejaVuSans-ExtraLight.ttf', index=0, name='DejaVu Sans Light', style='normal', variant='normal', weight=200, stretch='normal', size='scalable')) = 11.525
2026-07-21 14:55:57 runnervm3jd5f matplotlib.font_manager[2874] DEBUG findfont: score(FontEntry(fname='/home/runner/micromamba/envs/trajan/fonts/Ubuntu-BI.ttf', index=0, name='Ubuntu', style='italic', variant='normal', weight=700, stretch='normal', size='scalable')) = 10.05
2026-07-21 14:55:57 runnervm3jd5f matplotlib.font_manager[2874] DEBUG findfont: score(FontEntry(fname='/usr/share/fonts/truetype/dejavu/DejaVuSans-BoldOblique.ttf', index=0, name='DejaVu Sans', style='oblique', variant='normal', weight=700, stretch='normal', size='scalable')) = 0.15000000000000002
2026-07-21 14:55:57 runnervm3jd5f matplotlib.font_manager[2874] DEBUG findfont: score(FontEntry(fname='/home/runner/micromamba/envs/trajan/fonts/Ubuntu-RI.ttf', index=0, name='Ubuntu', style='italic', variant='normal', weight=400, stretch='normal', size='scalable')) = 10.335
2026-07-21 14:55:57 runnervm3jd5f matplotlib.font_manager[2874] DEBUG findfont: score(FontEntry(fname='/usr/share/fonts/truetype/dejavu/DejaVuSerif-Italic.ttf', index=0, name='DejaVu Serif', style='italic', variant='normal', weight=400, stretch='normal', size='scalable')) = 10.335
2026-07-21 14:55:57 runnervm3jd5f matplotlib.font_manager[2874] DEBUG findfont: score(FontEntry(fname='/home/runner/micromamba/envs/trajan/fonts/SourceCodePro-Medium.ttf', index=0, name='Source Code Pro', style='normal', variant='normal', weight=500, stretch='normal', size='scalable')) = 11.24
2026-07-21 14:55:57 runnervm3jd5f matplotlib.font_manager[2874] DEBUG findfont: score(FontEntry(fname='/home/runner/micromamba/envs/trajan/fonts/SourceCodePro-Medium.ttf', index=0, name='Source Code Pro Medium', style='normal', variant='normal', weight=400, stretch='normal', size='scalable')) = 11.335
2026-07-21 14:55:57 runnervm3jd5f matplotlib.font_manager[2874] DEBUG findfont: score(FontEntry(fname='/usr/share/fonts/truetype/lato/Lato-HeavyItalic.ttf', index=0, name='Lato', style='italic', variant='normal', weight=800, stretch='normal', size='scalable')) = 10.145
2026-07-21 14:55:57 runnervm3jd5f matplotlib.font_manager[2874] DEBUG findfont: score(FontEntry(fname='/usr/share/fonts/truetype/lato/Lato-HeavyItalic.ttf', index=0, name='Lato Heavy', style='italic', variant='normal', weight=400, stretch='normal', size='scalable')) = 10.335
2026-07-21 14:55:57 runnervm3jd5f matplotlib.font_manager[2874] DEBUG findfont: score(FontEntry(fname='/usr/share/fonts/truetype/dejavu/DejaVuSans-Oblique.ttf', index=0, name='DejaVu Sans', style='oblique', variant='normal', weight=400, stretch='normal', size='scalable')) = 0.43499999999999994
2026-07-21 14:55:57 runnervm3jd5f matplotlib.font_manager[2874] DEBUG findfont: score(FontEntry(fname='/home/runner/micromamba/envs/trajan/fonts/Ubuntu-M.ttf', index=0, name='Ubuntu', style='normal', variant='normal', weight=500, stretch='normal', size='scalable')) = 11.24
2026-07-21 14:55:57 runnervm3jd5f matplotlib.font_manager[2874] DEBUG findfont: score(FontEntry(fname='/home/runner/micromamba/envs/trajan/fonts/Ubuntu-M.ttf', index=0, name='Ubuntu Light', style='normal', variant='normal', weight=700, stretch='normal', size='scalable')) = 11.05
2026-07-21 14:55:57 runnervm3jd5f matplotlib.font_manager[2874] DEBUG findfont: score(FontEntry(fname='/usr/share/fonts/truetype/liberation/LiberationMono-BoldItalic.ttf', index=0, name='Liberation Mono', style='italic', variant='normal', weight=700, stretch='normal', size='scalable')) = 10.05
2026-07-21 14:55:57 runnervm3jd5f matplotlib.font_manager[2874] DEBUG findfont: score(FontEntry(fname='/usr/share/fonts/truetype/dejavu/DejaVuSansMono.ttf', index=0, name='DejaVu Sans Mono', style='normal', variant='normal', weight=400, stretch='normal', size='scalable')) = 11.335
2026-07-21 14:55:57 runnervm3jd5f matplotlib.font_manager[2874] DEBUG findfont: score(FontEntry(fname='/usr/share/fonts/truetype/dejavu/DejaVuMathTeXGyre.ttf', index=0, name='DejaVu Math TeX Gyre', style='normal', variant='normal', weight=400, stretch='normal', size='scalable')) = 11.335
2026-07-21 14:55:57 runnervm3jd5f matplotlib.font_manager[2874] DEBUG findfont: score(FontEntry(fname='/usr/share/fonts/truetype/dejavu/DejaVuSansMono-Oblique.ttf', index=0, name='DejaVu Sans Mono', style='oblique', variant='normal', weight=400, stretch='normal', size='scalable')) = 10.434999999999999
2026-07-21 14:55:57 runnervm3jd5f matplotlib.font_manager[2874] DEBUG findfont: score(FontEntry(fname='/home/runner/micromamba/envs/trajan/fonts/Ubuntu-L.ttf', index=0, name='Ubuntu', style='normal', variant='normal', weight=300, stretch='normal', size='scalable')) = 11.43
2026-07-21 14:55:57 runnervm3jd5f matplotlib.font_manager[2874] DEBUG findfont: score(FontEntry(fname='/home/runner/micromamba/envs/trajan/fonts/Ubuntu-L.ttf', index=0, name='Ubuntu Light', style='normal', variant='normal', weight=400, stretch='normal', size='scalable')) = 11.335
2026-07-21 14:55:57 runnervm3jd5f matplotlib.font_manager[2874] DEBUG findfont: score(FontEntry(fname='/home/runner/micromamba/envs/trajan/fonts/SourceCodePro-MediumIt.ttf', index=0, name='Source Code Pro', style='italic', variant='normal', weight=500, stretch='normal', size='scalable')) = 10.24
2026-07-21 14:55:57 runnervm3jd5f matplotlib.font_manager[2874] DEBUG findfont: score(FontEntry(fname='/home/runner/micromamba/envs/trajan/fonts/SourceCodePro-MediumIt.ttf', index=0, name='Source Code Pro Medium', style='italic', variant='normal', weight=400, stretch='normal', size='scalable')) = 10.335
2026-07-21 14:55:57 runnervm3jd5f matplotlib.font_manager[2874] DEBUG findfont: score(FontEntry(fname='/home/runner/micromamba/envs/trajan/fonts/SourceCodePro-Regular.ttf', index=0, name='Source Code Pro', style='normal', variant='normal', weight=400, stretch='normal', size='scalable')) = 11.335
2026-07-21 14:55:57 runnervm3jd5f matplotlib.font_manager[2874] DEBUG findfont: score(FontEntry(fname='/home/runner/micromamba/envs/trajan/fonts/SourceCodePro-SemiboldIt.ttf', index=0, name='Source Code Pro', style='italic', variant='normal', weight=600, stretch='normal', size='scalable')) = 10.145
2026-07-21 14:55:57 runnervm3jd5f matplotlib.font_manager[2874] DEBUG findfont: score(FontEntry(fname='/home/runner/micromamba/envs/trajan/fonts/SourceCodePro-SemiboldIt.ttf', index=0, name='Source Code Pro Semibold', style='italic', variant='normal', weight=400, stretch='normal', size='scalable')) = 10.335
2026-07-21 14:55:57 runnervm3jd5f matplotlib.font_manager[2874] DEBUG findfont: score(FontEntry(fname='/usr/share/fonts/truetype/dejavu/DejaVuSerif.ttf', index=0, name='DejaVu Serif', style='normal', variant='normal', weight=400, stretch='normal', size='scalable')) = 11.335
2026-07-21 14:55:57 runnervm3jd5f matplotlib.font_manager[2874] DEBUG findfont: score(FontEntry(fname='/usr/share/fonts/truetype/dejavu/DejaVuSerif-Bold.ttf', index=0, name='DejaVu Serif', style='normal', variant='normal', weight=700, stretch='normal', size='scalable')) = 11.05
2026-07-21 14:55:57 runnervm3jd5f matplotlib.font_manager[2874] DEBUG findfont: score(FontEntry(fname='/usr/share/fonts/truetype/liberation/LiberationSerif-Italic.ttf', index=0, name='Liberation Serif', style='italic', variant='normal', weight=400, stretch='normal', size='scalable')) = 10.335
2026-07-21 14:55:57 runnervm3jd5f matplotlib.font_manager[2874] DEBUG findfont: score(FontEntry(fname='/usr/share/fonts/truetype/dejavu/DejaVuSansMono-BoldOblique.ttf', index=0, name='DejaVu Sans Mono', style='oblique', variant='normal', weight=700, stretch='normal', size='scalable')) = 10.15
2026-07-21 14:55:57 runnervm3jd5f matplotlib.font_manager[2874] DEBUG findfont: score(FontEntry(fname='/home/runner/micromamba/envs/trajan/fonts/SourceCodePro-Light.ttf', index=0, name='Source Code Pro', style='normal', variant='normal', weight=300, stretch='normal', size='scalable')) = 11.43
2026-07-21 14:55:57 runnervm3jd5f matplotlib.font_manager[2874] DEBUG findfont: score(FontEntry(fname='/home/runner/micromamba/envs/trajan/fonts/SourceCodePro-Light.ttf', index=0, name='Source Code Pro Light', style='normal', variant='normal', weight=400, stretch='normal', size='scalable')) = 11.335
2026-07-21 14:55:57 runnervm3jd5f matplotlib.font_manager[2874] DEBUG findfont: score(FontEntry(fname='/usr/share/fonts/truetype/liberation/LiberationMono-Italic.ttf', index=0, name='Liberation Mono', style='italic', variant='normal', weight=400, stretch='normal', size='scalable')) = 10.335
2026-07-21 14:55:57 runnervm3jd5f matplotlib.font_manager[2874] DEBUG findfont: Matching DejaVu Sans:style=italic:variant=normal:weight=bold:stretch=normal:size=10.0 to DejaVu Sans ('/home/runner/micromamba/envs/trajan/lib/python3.14/site-packages/matplotlib/mpl-data/fonts/ttf/DejaVuSans-BoldOblique.ttf') with score of 0.150000.
2026-07-21 14:55:57 runnervm3jd5f matplotlib.font_manager[2874] DEBUG findfont: Matching DejaVu Sans Mono:style=normal:variant=normal:weight=normal:stretch=normal:size=10.0.
2026-07-21 14:55:57 runnervm3jd5f matplotlib.font_manager[2874] DEBUG findfont: score(FontEntry(fname='/home/runner/micromamba/envs/trajan/lib/python3.14/site-packages/matplotlib/mpl-data/fonts/ttf/cmmi10.ttf', index=0, name='cmmi10', style='normal', variant='normal', weight=400, stretch='normal', size='scalable')) = 10.05
2026-07-21 14:55:57 runnervm3jd5f matplotlib.font_manager[2874] DEBUG findfont: score(FontEntry(fname='/home/runner/micromamba/envs/trajan/lib/python3.14/site-packages/matplotlib/mpl-data/fonts/ttf/DejaVuSerif-Bold.ttf', index=0, name='DejaVu Serif', style='normal', variant='normal', weight=700, stretch='normal', size='scalable')) = 10.335
2026-07-21 14:55:57 runnervm3jd5f matplotlib.font_manager[2874] DEBUG findfont: score(FontEntry(fname='/home/runner/micromamba/envs/trajan/lib/python3.14/site-packages/matplotlib/mpl-data/fonts/ttf/DejaVuSans-Oblique.ttf', index=0, name='DejaVu Sans', style='oblique', variant='normal', weight=400, stretch='normal', size='scalable')) = 11.05
2026-07-21 14:55:57 runnervm3jd5f matplotlib.font_manager[2874] DEBUG findfont: score(FontEntry(fname='/home/runner/micromamba/envs/trajan/lib/python3.14/site-packages/matplotlib/mpl-data/fonts/ttf/STIXSizThreeSymReg.ttf', index=0, name='STIXSizeThreeSym', style='normal', variant='normal', weight=400, stretch='normal', size='scalable')) = 10.05
2026-07-21 14:55:57 runnervm3jd5f matplotlib.font_manager[2874] DEBUG findfont: score(FontEntry(fname='/home/runner/micromamba/envs/trajan/lib/python3.14/site-packages/matplotlib/mpl-data/fonts/ttf/STIXNonUniBolIta.ttf', index=0, name='STIXNonUnicode', style='italic', variant='normal', weight=700, stretch='normal', size='scalable')) = 11.335
2026-07-21 14:55:57 runnervm3jd5f matplotlib.font_manager[2874] DEBUG findfont: score(FontEntry(fname='/home/runner/micromamba/envs/trajan/lib/python3.14/site-packages/matplotlib/mpl-data/fonts/ttf/DejaVuSerifDisplay.ttf', index=0, name='DejaVu Serif Display', style='normal', variant='normal', weight=400, stretch='normal', size='scalable')) = 10.05
2026-07-21 14:55:57 runnervm3jd5f matplotlib.font_manager[2874] DEBUG findfont: score(FontEntry(fname='/home/runner/micromamba/envs/trajan/lib/python3.14/site-packages/matplotlib/mpl-data/fonts/ttf/cmss10.ttf', index=0, name='cmss10', style='normal', variant='normal', weight=400, stretch='normal', size='scalable')) = 10.05
2026-07-21 14:55:57 runnervm3jd5f matplotlib.font_manager[2874] DEBUG findfont: score(FontEntry(fname='/home/runner/micromamba/envs/trajan/lib/python3.14/site-packages/matplotlib/mpl-data/fonts/ttf/STIXGeneralBolIta.ttf', index=0, name='STIXGeneral', style='italic', variant='normal', weight=700, stretch='normal', size='scalable')) = 11.335
2026-07-21 14:55:57 runnervm3jd5f matplotlib.font_manager[2874] DEBUG findfont: score(FontEntry(fname='/home/runner/micromamba/envs/trajan/lib/python3.14/site-packages/matplotlib/mpl-data/fonts/ttf/cmtt10.ttf', index=0, name='cmtt10', style='normal', variant='normal', weight=400, stretch='normal', size='scalable')) = 10.05
2026-07-21 14:55:57 runnervm3jd5f matplotlib.font_manager[2874] DEBUG findfont: score(FontEntry(fname='/home/runner/micromamba/envs/trajan/lib/python3.14/site-packages/matplotlib/mpl-data/fonts/ttf/cmsy10.ttf', index=0, name='cmsy10', style='normal', variant='normal', weight=400, stretch='normal', size='scalable')) = 10.05
2026-07-21 14:55:57 runnervm3jd5f matplotlib.font_manager[2874] DEBUG findfont: score(FontEntry(fname='/home/runner/micromamba/envs/trajan/lib/python3.14/site-packages/matplotlib/mpl-data/fonts/ttf/DejaVuSansMono-Oblique.ttf', index=0, name='DejaVu Sans Mono', style='oblique', variant='normal', weight=400, stretch='normal', size='scalable')) = 1.05
2026-07-21 14:55:57 runnervm3jd5f matplotlib.font_manager[2874] DEBUG findfont: score(FontEntry(fname='/home/runner/micromamba/envs/trajan/lib/python3.14/site-packages/matplotlib/mpl-data/fonts/ttf/STIXNonUniIta.ttf', index=0, name='STIXNonUnicode', style='italic', variant='normal', weight=400, stretch='normal', size='scalable')) = 11.05
2026-07-21 14:55:57 runnervm3jd5f matplotlib.font_manager[2874] DEBUG findfont: score(FontEntry(fname='/home/runner/micromamba/envs/trajan/lib/python3.14/site-packages/matplotlib/mpl-data/fonts/ttf/STIXGeneral.ttf', index=0, name='STIXGeneral', style='normal', variant='normal', weight=400, stretch='normal', size='scalable')) = 10.05
2026-07-21 14:55:57 runnervm3jd5f matplotlib.font_manager[2874] DEBUG findfont: score(FontEntry(fname='/home/runner/micromamba/envs/trajan/lib/python3.14/site-packages/matplotlib/mpl-data/fonts/ttf/cmti10.ttf', index=0, name='cmti10', style='normal', variant='normal', weight=400, stretch='normal', size='scalable')) = 10.05
2026-07-21 14:55:57 runnervm3jd5f matplotlib.font_manager[2874] DEBUG findfont: score(FontEntry(fname='/home/runner/micromamba/envs/trajan/lib/python3.14/site-packages/matplotlib/mpl-data/fonts/ttf/DejaVuSansMono-BoldOblique.ttf', index=0, name='DejaVu Sans Mono', style='oblique', variant='normal', weight=700, stretch='normal', size='scalable')) = 1.335
2026-07-21 14:55:57 runnervm3jd5f matplotlib.font_manager[2874] DEBUG findfont: score(FontEntry(fname='/home/runner/micromamba/envs/trajan/lib/python3.14/site-packages/matplotlib/mpl-data/fonts/ttf/DejaVuSerif.ttf', index=0, name='DejaVu Serif', style='normal', variant='normal', weight=400, stretch='normal', size='scalable')) = 10.05
2026-07-21 14:55:57 runnervm3jd5f matplotlib.font_manager[2874] DEBUG findfont: score(FontEntry(fname='/home/runner/micromamba/envs/trajan/lib/python3.14/site-packages/matplotlib/mpl-data/fonts/ttf/LastResortHE-Regular.ttf', index=0, name='Last Resort High-Efficiency', style='normal', variant='normal', weight=400, stretch='normal', size='scalable')) = 10.05
2026-07-21 14:55:57 runnervm3jd5f matplotlib.font_manager[2874] DEBUG findfont: score(FontEntry(fname='/home/runner/micromamba/envs/trajan/lib/python3.14/site-packages/matplotlib/mpl-data/fonts/ttf/cmex10.ttf', index=0, name='cmex10', style='normal', variant='normal', weight=400, stretch='normal', size='scalable')) = 10.05
2026-07-21 14:55:57 runnervm3jd5f matplotlib.font_manager[2874] DEBUG findfont: score(FontEntry(fname='/home/runner/micromamba/envs/trajan/lib/python3.14/site-packages/matplotlib/mpl-data/fonts/ttf/STIXSizFiveSymReg.ttf', index=0, name='STIXSizeFiveSym', style='normal', variant='normal', weight=400, stretch='normal', size='scalable')) = 10.05
2026-07-21 14:55:57 runnervm3jd5f matplotlib.font_manager[2874] DEBUG findfont: score(FontEntry(fname='/home/runner/micromamba/envs/trajan/lib/python3.14/site-packages/matplotlib/mpl-data/fonts/ttf/STIXNonUniBol.ttf', index=0, name='STIXNonUnicode', style='normal', variant='normal', weight=700, stretch='normal', size='scalable')) = 10.335
2026-07-21 14:55:57 runnervm3jd5f matplotlib.font_manager[2874] DEBUG findfont: score(FontEntry(fname='/home/runner/micromamba/envs/trajan/lib/python3.14/site-packages/matplotlib/mpl-data/fonts/ttf/DejaVuSansDisplay.ttf', index=0, name='DejaVu Sans Display', style='normal', variant='normal', weight=400, stretch='normal', size='scalable')) = 10.05
2026-07-21 14:55:57 runnervm3jd5f matplotlib.font_manager[2874] DEBUG findfont: score(FontEntry(fname='/home/runner/micromamba/envs/trajan/lib/python3.14/site-packages/matplotlib/mpl-data/fonts/ttf/DejaVuSansMono.ttf', index=0, name='DejaVu Sans Mono', style='normal', variant='normal', weight=400, stretch='normal', size='scalable')) = 0.05
2026-07-21 14:55:57 runnervm3jd5f matplotlib.font_manager[2874] DEBUG findfont: score(FontEntry(fname='/home/runner/micromamba/envs/trajan/lib/python3.14/site-packages/matplotlib/mpl-data/fonts/ttf/cmb10.ttf', index=0, name='cmb10', style='normal', variant='normal', weight=400, stretch='normal', size='scalable')) = 10.05
2026-07-21 14:55:57 runnervm3jd5f matplotlib.font_manager[2874] DEBUG findfont: score(FontEntry(fname='/home/runner/micromamba/envs/trajan/lib/python3.14/site-packages/matplotlib/mpl-data/fonts/ttf/STIXSizTwoSymReg.ttf', index=0, name='STIXSizeTwoSym', style='normal', variant='normal', weight=400, stretch='normal', size='scalable')) = 10.05
2026-07-21 14:55:57 runnervm3jd5f matplotlib.font_manager[2874] DEBUG findfont: score(FontEntry(fname='/home/runner/micromamba/envs/trajan/lib/python3.14/site-packages/matplotlib/mpl-data/fonts/ttf/DejaVuSans.ttf', index=0, name='DejaVu Sans', style='normal', variant='normal', weight=400, stretch='normal', size='scalable')) = 10.05
2026-07-21 14:55:57 runnervm3jd5f matplotlib.font_manager[2874] DEBUG findfont: score(FontEntry(fname='/home/runner/micromamba/envs/trajan/lib/python3.14/site-packages/matplotlib/mpl-data/fonts/ttf/STIXNonUni.ttf', index=0, name='STIXNonUnicode', style='normal', variant='normal', weight=400, stretch='normal', size='scalable')) = 10.05
2026-07-21 14:55:57 runnervm3jd5f matplotlib.font_manager[2874] DEBUG findfont: score(FontEntry(fname='/home/runner/micromamba/envs/trajan/lib/python3.14/site-packages/matplotlib/mpl-data/fonts/ttf/STIXGeneralItalic.ttf', index=0, name='STIXGeneral', style='italic', variant='normal', weight=400, stretch='normal', size='scalable')) = 11.05
2026-07-21 14:55:57 runnervm3jd5f matplotlib.font_manager[2874] DEBUG findfont: score(FontEntry(fname='/home/runner/micromamba/envs/trajan/lib/python3.14/site-packages/matplotlib/mpl-data/fonts/ttf/STIXSizOneSymBol.ttf', index=0, name='STIXSizeOneSym', style='normal', variant='normal', weight=700, stretch='normal', size='scalable')) = 10.335
2026-07-21 14:55:57 runnervm3jd5f matplotlib.font_manager[2874] DEBUG findfont: score(FontEntry(fname='/home/runner/micromamba/envs/trajan/lib/python3.14/site-packages/matplotlib/mpl-data/fonts/ttf/DejaVuSansMono-Bold.ttf', index=0, name='DejaVu Sans Mono', style='normal', variant='normal', weight=700, stretch='normal', size='scalable')) = 0.33499999999999996
2026-07-21 14:55:57 runnervm3jd5f matplotlib.font_manager[2874] DEBUG findfont: score(FontEntry(fname='/home/runner/micromamba/envs/trajan/lib/python3.14/site-packages/matplotlib/mpl-data/fonts/ttf/STIXSizTwoSymBol.ttf', index=0, name='STIXSizeTwoSym', style='normal', variant='normal', weight=700, stretch='normal', size='scalable')) = 10.335
2026-07-21 14:55:57 runnervm3jd5f matplotlib.font_manager[2874] DEBUG findfont: score(FontEntry(fname='/home/runner/micromamba/envs/trajan/lib/python3.14/site-packages/matplotlib/mpl-data/fonts/ttf/STIXSizThreeSymBol.ttf', index=0, name='STIXSizeThreeSym', style='normal', variant='normal', weight=700, stretch='normal', size='scalable')) = 10.335
2026-07-21 14:55:57 runnervm3jd5f matplotlib.font_manager[2874] DEBUG findfont: score(FontEntry(fname='/home/runner/micromamba/envs/trajan/lib/python3.14/site-packages/matplotlib/mpl-data/fonts/ttf/DejaVuSerif-BoldItalic.ttf', index=0, name='DejaVu Serif', style='italic', variant='normal', weight=700, stretch='normal', size='scalable')) = 11.335
2026-07-21 14:55:57 runnervm3jd5f matplotlib.font_manager[2874] DEBUG findfont: score(FontEntry(fname='/home/runner/micromamba/envs/trajan/lib/python3.14/site-packages/matplotlib/mpl-data/fonts/ttf/DejaVuSerif-Italic.ttf', index=0, name='DejaVu Serif', style='italic', variant='normal', weight=400, stretch='normal', size='scalable')) = 11.05
2026-07-21 14:55:57 runnervm3jd5f matplotlib.font_manager[2874] DEBUG findfont: score(FontEntry(fname='/home/runner/micromamba/envs/trajan/lib/python3.14/site-packages/matplotlib/mpl-data/fonts/ttf/DejaVuSans-Bold.ttf', index=0, name='DejaVu Sans', style='normal', variant='normal', weight=700, stretch='normal', size='scalable')) = 10.335
2026-07-21 14:55:57 runnervm3jd5f matplotlib.font_manager[2874] DEBUG findfont: score(FontEntry(fname='/home/runner/micromamba/envs/trajan/lib/python3.14/site-packages/matplotlib/mpl-data/fonts/ttf/STIXSizFourSymBol.ttf', index=0, name='STIXSizeFourSym', style='normal', variant='normal', weight=700, stretch='normal', size='scalable')) = 10.335
2026-07-21 14:55:57 runnervm3jd5f matplotlib.font_manager[2874] DEBUG findfont: score(FontEntry(fname='/home/runner/micromamba/envs/trajan/lib/python3.14/site-packages/matplotlib/mpl-data/fonts/ttf/STIXSizOneSymReg.ttf', index=0, name='STIXSizeOneSym', style='normal', variant='normal', weight=400, stretch='normal', size='scalable')) = 10.05
2026-07-21 14:55:57 runnervm3jd5f matplotlib.font_manager[2874] DEBUG findfont: score(FontEntry(fname='/home/runner/micromamba/envs/trajan/lib/python3.14/site-packages/matplotlib/mpl-data/fonts/ttf/cmr10.ttf', index=0, name='cmr10', style='normal', variant='normal', weight=400, stretch='normal', size='scalable')) = 10.05
2026-07-21 14:55:57 runnervm3jd5f matplotlib.font_manager[2874] DEBUG findfont: score(FontEntry(fname='/home/runner/micromamba/envs/trajan/lib/python3.14/site-packages/matplotlib/mpl-data/fonts/ttf/STIXGeneralBol.ttf', index=0, name='STIXGeneral', style='normal', variant='normal', weight=700, stretch='normal', size='scalable')) = 10.335
2026-07-21 14:55:57 runnervm3jd5f matplotlib.font_manager[2874] DEBUG findfont: score(FontEntry(fname='/home/runner/micromamba/envs/trajan/lib/python3.14/site-packages/matplotlib/mpl-data/fonts/ttf/DejaVuSans-BoldOblique.ttf', index=0, name='DejaVu Sans', style='oblique', variant='normal', weight=700, stretch='normal', size='scalable')) = 11.335
2026-07-21 14:55:57 runnervm3jd5f matplotlib.font_manager[2874] DEBUG findfont: score(FontEntry(fname='/home/runner/micromamba/envs/trajan/lib/python3.14/site-packages/matplotlib/mpl-data/fonts/ttf/STIXSizFourSymReg.ttf', index=0, name='STIXSizeFourSym', style='normal', variant='normal', weight=400, stretch='normal', size='scalable')) = 10.05
2026-07-21 14:55:57 runnervm3jd5f matplotlib.font_manager[2874] DEBUG findfont: score(FontEntry(fname='/usr/share/fonts/truetype/lato/Lato-Black.ttf', index=0, name='Lato', style='normal', variant='normal', weight=900, stretch='normal', size='scalable')) = 10.525
2026-07-21 14:55:57 runnervm3jd5f matplotlib.font_manager[2874] DEBUG findfont: score(FontEntry(fname='/usr/share/fonts/truetype/lato/Lato-Black.ttf', index=0, name='Lato Black', style='normal', variant='normal', weight=400, stretch='normal', size='scalable')) = 10.05
2026-07-21 14:55:57 runnervm3jd5f matplotlib.font_manager[2874] DEBUG findfont: score(FontEntry(fname='/usr/share/fonts/truetype/liberation/LiberationSerif-Regular.ttf', index=0, name='Liberation Serif', style='normal', variant='normal', weight=400, stretch='normal', size='scalable')) = 10.05
2026-07-21 14:55:57 runnervm3jd5f matplotlib.font_manager[2874] DEBUG findfont: score(FontEntry(fname='/usr/share/fonts/truetype/dejavu/DejaVuSerifCondensed.ttf', index=0, name='DejaVu Serif', style='normal', variant='normal', weight=400, stretch='condensed', size='scalable')) = 10.25
2026-07-21 14:55:57 runnervm3jd5f matplotlib.font_manager[2874] DEBUG findfont: score(FontEntry(fname='/usr/share/fonts/truetype/dejavu/DejaVuSerifCondensed.ttf', index=0, name='DejaVu Serif Condensed', style='normal', variant='normal', weight=380, stretch='condensed', size='scalable')) = 10.269
2026-07-21 14:55:57 runnervm3jd5f matplotlib.font_manager[2874] DEBUG findfont: score(FontEntry(fname='/home/runner/micromamba/envs/trajan/fonts/UbuntuMono-BI.ttf', index=0, name='Ubuntu Mono', style='italic', variant='normal', weight=700, stretch='normal', size='scalable')) = 11.335
2026-07-21 14:55:57 runnervm3jd5f matplotlib.font_manager[2874] DEBUG findfont: score(FontEntry(fname='/usr/share/fonts/truetype/dejavu/DejaVuSans.ttf', index=0, name='DejaVu Sans', style='normal', variant='normal', weight=400, stretch='normal', size='scalable')) = 10.05
2026-07-21 14:55:57 runnervm3jd5f matplotlib.font_manager[2874] DEBUG findfont: score(FontEntry(fname='/usr/share/fonts/truetype/lato/Lato-Italic.ttf', index=0, name='Lato', style='italic', variant='normal', weight=400, stretch='normal', size='scalable')) = 11.05
2026-07-21 14:55:57 runnervm3jd5f matplotlib.font_manager[2874] DEBUG findfont: score(FontEntry(fname='/usr/share/fonts/truetype/liberation/LiberationSans-Italic.ttf', index=0, name='Liberation Sans', style='italic', variant='normal', weight=400, stretch='normal', size='scalable')) = 11.05
2026-07-21 14:55:57 runnervm3jd5f matplotlib.font_manager[2874] DEBUG findfont: score(FontEntry(fname='/home/runner/micromamba/envs/trajan/fonts/Ubuntu-B.ttf', index=0, name='Ubuntu', style='normal', variant='normal', weight=700, stretch='normal', size='scalable')) = 10.335
2026-07-21 14:55:57 runnervm3jd5f matplotlib.font_manager[2874] DEBUG findfont: score(FontEntry(fname='/home/runner/micromamba/envs/trajan/fonts/SourceCodePro-Semibold.ttf', index=0, name='Source Code Pro', style='normal', variant='normal', weight=600, stretch='normal', size='scalable')) = 10.24
2026-07-21 14:55:57 runnervm3jd5f matplotlib.font_manager[2874] DEBUG findfont: score(FontEntry(fname='/home/runner/micromamba/envs/trajan/fonts/SourceCodePro-Semibold.ttf', index=0, name='Source Code Pro Semibold', style='normal', variant='normal', weight=400, stretch='normal', size='scalable')) = 10.05
2026-07-21 14:55:57 runnervm3jd5f matplotlib.font_manager[2874] DEBUG findfont: score(FontEntry(fname='/home/runner/micromamba/envs/trajan/fonts/SourceCodePro-Bold.ttf', index=0, name='Source Code Pro', style='normal', variant='normal', weight=700, stretch='normal', size='scalable')) = 10.335
2026-07-21 14:55:57 runnervm3jd5f matplotlib.font_manager[2874] DEBUG findfont: score(FontEntry(fname='/home/runner/micromamba/envs/trajan/fonts/Ubuntu-MI.ttf', index=0, name='Ubuntu', style='italic', variant='normal', weight=500, stretch='normal', size='scalable')) = 11.145
2026-07-21 14:55:57 runnervm3jd5f matplotlib.font_manager[2874] DEBUG findfont: score(FontEntry(fname='/home/runner/micromamba/envs/trajan/fonts/Ubuntu-MI.ttf', index=0, name='Ubuntu Light', style='italic', variant='normal', weight=700, stretch='normal', size='scalable')) = 11.335
2026-07-21 14:55:57 runnervm3jd5f matplotlib.font_manager[2874] DEBUG findfont: score(FontEntry(fname='/usr/share/fonts/truetype/lato/Lato-Regular.ttf', index=0, name='Lato', style='normal', variant='normal', weight=400, stretch='normal', size='scalable')) = 10.05
2026-07-21 14:55:57 runnervm3jd5f matplotlib.font_manager[2874] DEBUG findfont: score(FontEntry(fname='/usr/share/fonts/truetype/lato/Lato-ThinItalic.ttf', index=0, name='Lato', style='italic', variant='normal', weight=275, stretch='normal', size='scalable')) = 11.16875
2026-07-21 14:55:57 runnervm3jd5f matplotlib.font_manager[2874] DEBUG findfont: score(FontEntry(fname='/usr/share/fonts/truetype/lato/Lato-ThinItalic.ttf', index=0, name='Lato Thin', style='italic', variant='normal', weight=400, stretch='normal', size='scalable')) = 11.05
2026-07-21 14:55:57 runnervm3jd5f matplotlib.font_manager[2874] DEBUG findfont: score(FontEntry(fname='/usr/share/fonts/truetype/lato/Lato-BlackItalic.ttf', index=0, name='Lato', style='italic', variant='normal', weight=900, stretch='normal', size='scalable')) = 11.525
2026-07-21 14:55:57 runnervm3jd5f matplotlib.font_manager[2874] DEBUG findfont: score(FontEntry(fname='/usr/share/fonts/truetype/lato/Lato-BlackItalic.ttf', index=0, name='Lato Black', style='italic', variant='normal', weight=400, stretch='normal', size='scalable')) = 11.05
2026-07-21 14:55:57 runnervm3jd5f matplotlib.font_manager[2874] DEBUG findfont: score(FontEntry(fname='/usr/share/fonts/truetype/dejavu/DejaVuSerifCondensed-Italic.ttf', index=0, name='DejaVu Serif', style='italic', variant='normal', weight=400, stretch='condensed', size='scalable')) = 11.25
2026-07-21 14:55:57 runnervm3jd5f matplotlib.font_manager[2874] DEBUG findfont: score(FontEntry(fname='/usr/share/fonts/truetype/dejavu/DejaVuSerifCondensed-Italic.ttf', index=0, name='DejaVu Serif Condensed', style='italic', variant='normal', weight=400, stretch='condensed', size='scalable')) = 11.25
2026-07-21 14:55:57 runnervm3jd5f matplotlib.font_manager[2874] DEBUG findfont: score(FontEntry(fname='/usr/share/fonts/truetype/dejavu/DejaVuSans-Bold.ttf', index=0, name='DejaVu Sans', style='normal', variant='normal', weight=700, stretch='normal', size='scalable')) = 10.335
2026-07-21 14:55:57 runnervm3jd5f matplotlib.font_manager[2874] DEBUG findfont: score(FontEntry(fname='/home/runner/micromamba/envs/trajan/fonts/UbuntuMono-R.ttf', index=0, name='Ubuntu Mono', style='normal', variant='normal', weight=400, stretch='normal', size='scalable')) = 10.05
2026-07-21 14:55:57 runnervm3jd5f matplotlib.font_manager[2874] DEBUG findfont: score(FontEntry(fname='/usr/share/fonts/truetype/dejavu/DejaVuSerif-BoldItalic.ttf', index=0, name='DejaVu Serif', style='italic', variant='normal', weight=700, stretch='normal', size='scalable')) = 11.335
2026-07-21 14:55:57 runnervm3jd5f matplotlib.font_manager[2874] DEBUG findfont: score(FontEntry(fname='/usr/share/fonts/truetype/lato/Lato-Hairline.ttf', index=0, name='Lato', style='normal', variant='normal', weight=250, stretch='normal', size='scalable')) = 10.1925
2026-07-21 14:55:57 runnervm3jd5f matplotlib.font_manager[2874] DEBUG findfont: score(FontEntry(fname='/usr/share/fonts/truetype/lato/Lato-Hairline.ttf', index=0, name='Lato Hairline', style='normal', variant='normal', weight=400, stretch='normal', size='scalable')) = 10.05
2026-07-21 14:55:57 runnervm3jd5f matplotlib.font_manager[2874] DEBUG findfont: score(FontEntry(fname='/usr/share/fonts/truetype/lato/Lato-LightItalic.ttf', index=0, name='Lato', style='italic', variant='normal', weight=300, stretch='normal', size='scalable')) = 11.145
2026-07-21 14:55:57 runnervm3jd5f matplotlib.font_manager[2874] DEBUG findfont: score(FontEntry(fname='/usr/share/fonts/truetype/lato/Lato-LightItalic.ttf', index=0, name='Lato Light', style='italic', variant='normal', weight=400, stretch='normal', size='scalable')) = 11.05
2026-07-21 14:55:57 runnervm3jd5f matplotlib.font_manager[2874] DEBUG findfont: score(FontEntry(fname='/usr/share/fonts/truetype/dejavu/DejaVuSansCondensed-BoldOblique.ttf', index=0, name='DejaVu Sans', style='oblique', variant='normal', weight=700, stretch='condensed', size='scalable')) = 11.535
2026-07-21 14:55:57 runnervm3jd5f matplotlib.font_manager[2874] DEBUG findfont: score(FontEntry(fname='/usr/share/fonts/truetype/dejavu/DejaVuSansCondensed-BoldOblique.ttf', index=0, name='DejaVu Sans Condensed', style='oblique', variant='normal', weight=700, stretch='condensed', size='scalable')) = 11.535
2026-07-21 14:55:57 runnervm3jd5f matplotlib.font_manager[2874] DEBUG findfont: score(FontEntry(fname='/home/runner/micromamba/envs/trajan/fonts/SourceCodePro-It.ttf', index=0, name='Source Code Pro', style='italic', variant='normal', weight=400, stretch='normal', size='scalable')) = 11.05
2026-07-21 14:55:57 runnervm3jd5f matplotlib.font_manager[2874] DEBUG findfont: score(FontEntry(fname='/home/runner/micromamba/envs/trajan/fonts/SourceCodePro-ExtraLightIt.ttf', index=0, name='Source Code Pro', style='italic', variant='normal', weight=200, stretch='normal', size='scalable')) = 11.24
2026-07-21 14:55:57 runnervm3jd5f matplotlib.font_manager[2874] DEBUG findfont: score(FontEntry(fname='/home/runner/micromamba/envs/trajan/fonts/SourceCodePro-ExtraLightIt.ttf', index=0, name='Source Code Pro ExtraLight', style='italic', variant='normal', weight=400, stretch='normal', size='scalable')) = 11.05
2026-07-21 14:55:57 runnervm3jd5f matplotlib.font_manager[2874] DEBUG findfont: score(FontEntry(fname='/usr/share/fonts/truetype/lato/Lato-Medium.ttf', index=0, name='Lato', style='normal', variant='normal', weight=500, stretch='normal', size='scalable')) = 10.145
2026-07-21 14:55:57 runnervm3jd5f matplotlib.font_manager[2874] DEBUG findfont: score(FontEntry(fname='/usr/share/fonts/truetype/lato/Lato-Medium.ttf', index=0, name='Lato Medium', style='normal', variant='normal', weight=400, stretch='normal', size='scalable')) = 10.05
2026-07-21 14:55:57 runnervm3jd5f matplotlib.font_manager[2874] DEBUG findfont: score(FontEntry(fname='/usr/share/fonts/truetype/lato/Lato-BoldItalic.ttf', index=0, name='Lato', style='italic', variant='normal', weight=700, stretch='normal', size='scalable')) = 11.335
2026-07-21 14:55:57 runnervm3jd5f matplotlib.font_manager[2874] DEBUG findfont: score(FontEntry(fname='/home/runner/micromamba/envs/trajan/fonts/DejaVuSans.ttf', index=0, name='DejaVu Sans', style='normal', variant='normal', weight=400, stretch='normal', size='scalable')) = 10.05
2026-07-21 14:55:57 runnervm3jd5f matplotlib.font_manager[2874] DEBUG findfont: score(FontEntry(fname='/home/runner/micromamba/envs/trajan/fonts/UbuntuMono-B.ttf', index=0, name='Ubuntu Mono', style='normal', variant='normal', weight=700, stretch='normal', size='scalable')) = 10.335
2026-07-21 14:55:57 runnervm3jd5f matplotlib.font_manager[2874] DEBUG findfont: score(FontEntry(fname='/home/runner/micromamba/envs/trajan/fonts/SourceCodePro-LightIt.ttf', index=0, name='Source Code Pro', style='italic', variant='normal', weight=300, stretch='normal', size='scalable')) = 11.145
2026-07-21 14:55:57 runnervm3jd5f matplotlib.font_manager[2874] DEBUG findfont: score(FontEntry(fname='/home/runner/micromamba/envs/trajan/fonts/SourceCodePro-LightIt.ttf', index=0, name='Source Code Pro Light', style='italic', variant='normal', weight=400, stretch='normal', size='scalable')) = 11.05
2026-07-21 14:55:57 runnervm3jd5f matplotlib.font_manager[2874] DEBUG findfont: score(FontEntry(fname='/usr/share/fonts/truetype/liberation/LiberationSans-BoldItalic.ttf', index=0, name='Liberation Sans', style='italic', variant='normal', weight=700, stretch='normal', size='scalable')) = 11.335
2026-07-21 14:55:57 runnervm3jd5f matplotlib.font_manager[2874] DEBUG findfont: score(FontEntry(fname='/usr/share/fonts/truetype/liberation/LiberationSans-Regular.ttf', index=0, name='Liberation Sans', style='normal', variant='normal', weight=400, stretch='normal', size='scalable')) = 10.05
2026-07-21 14:55:57 runnervm3jd5f matplotlib.font_manager[2874] DEBUG findfont: score(FontEntry(fname='/usr/share/fonts/truetype/dejavu/DejaVuSansMono-Bold.ttf', index=0, name='DejaVu Sans Mono', style='normal', variant='normal', weight=700, stretch='normal', size='scalable')) = 0.33499999999999996
2026-07-21 14:55:57 runnervm3jd5f matplotlib.font_manager[2874] DEBUG findfont: score(FontEntry(fname='/home/runner/micromamba/envs/trajan/fonts/SourceCodePro-BoldIt.ttf', index=0, name='Source Code Pro', style='italic', variant='normal', weight=700, stretch='normal', size='scalable')) = 11.335
2026-07-21 14:55:57 runnervm3jd5f matplotlib.font_manager[2874] DEBUG findfont: score(FontEntry(fname='/usr/share/fonts/truetype/lato/Lato-Bold.ttf', index=0, name='Lato', style='normal', variant='normal', weight=700, stretch='normal', size='scalable')) = 10.335
2026-07-21 14:55:57 runnervm3jd5f matplotlib.font_manager[2874] DEBUG findfont: score(FontEntry(fname='/usr/share/fonts/truetype/dejavu/DejaVuSansCondensed.ttf', index=0, name='DejaVu Sans', style='normal', variant='normal', weight=400, stretch='condensed', size='scalable')) = 10.25
2026-07-21 14:55:57 runnervm3jd5f matplotlib.font_manager[2874] DEBUG findfont: score(FontEntry(fname='/usr/share/fonts/truetype/dejavu/DejaVuSansCondensed.ttf', index=0, name='DejaVu Sans Condensed', style='normal', variant='normal', weight=380, stretch='condensed', size='scalable')) = 10.269
2026-07-21 14:55:57 runnervm3jd5f matplotlib.font_manager[2874] DEBUG findfont: score(FontEntry(fname='/usr/share/fonts/truetype/lato/Lato-MediumItalic.ttf', index=0, name='Lato', style='italic', variant='normal', weight=500, stretch='normal', size='scalable')) = 11.145
2026-07-21 14:55:57 runnervm3jd5f matplotlib.font_manager[2874] DEBUG findfont: score(FontEntry(fname='/usr/share/fonts/truetype/lato/Lato-MediumItalic.ttf', index=0, name='Lato Medium', style='italic', variant='normal', weight=400, stretch='normal', size='scalable')) = 11.05
2026-07-21 14:55:57 runnervm3jd5f matplotlib.font_manager[2874] DEBUG findfont: score(FontEntry(fname='/usr/share/fonts/truetype/liberation/LiberationSans-Bold.ttf', index=0, name='Liberation Sans', style='normal', variant='normal', weight=700, stretch='normal', size='scalable')) = 10.335
2026-07-21 14:55:57 runnervm3jd5f matplotlib.font_manager[2874] DEBUG findfont: score(FontEntry(fname='/usr/share/fonts/truetype/dejavu/DejaVuSerifCondensed-BoldItalic.ttf', index=0, name='DejaVu Serif', style='italic', variant='normal', weight=700, stretch='condensed', size='scalable')) = 11.535
2026-07-21 14:55:57 runnervm3jd5f matplotlib.font_manager[2874] DEBUG findfont: score(FontEntry(fname='/usr/share/fonts/truetype/dejavu/DejaVuSerifCondensed-BoldItalic.ttf', index=0, name='DejaVu Serif Condensed', style='italic', variant='normal', weight=700, stretch='condensed', size='scalable')) = 11.535
2026-07-21 14:55:57 runnervm3jd5f matplotlib.font_manager[2874] DEBUG findfont: score(FontEntry(fname='/home/runner/micromamba/envs/trajan/fonts/Ubuntu-R.ttf', index=0, name='Ubuntu', style='normal', variant='normal', weight=400, stretch='normal', size='scalable')) = 10.05
2026-07-21 14:55:57 runnervm3jd5f matplotlib.font_manager[2874] DEBUG findfont: score(FontEntry(fname='/usr/share/fonts/truetype/lato/Lato-Light.ttf', index=0, name='Lato', style='normal', variant='normal', weight=300, stretch='normal', size='scalable')) = 10.145
2026-07-21 14:55:57 runnervm3jd5f matplotlib.font_manager[2874] DEBUG findfont: score(FontEntry(fname='/usr/share/fonts/truetype/lato/Lato-Light.ttf', index=0, name='Lato Light', style='normal', variant='normal', weight=400, stretch='normal', size='scalable')) = 10.05
2026-07-21 14:55:57 runnervm3jd5f matplotlib.font_manager[2874] DEBUG findfont: score(FontEntry(fname='/usr/share/fonts/truetype/liberation/LiberationSerif-BoldItalic.ttf', index=0, name='Liberation Serif', style='italic', variant='normal', weight=700, stretch='normal', size='scalable')) = 11.335
2026-07-21 14:55:57 runnervm3jd5f matplotlib.font_manager[2874] DEBUG findfont: score(FontEntry(fname='/home/runner/micromamba/envs/trajan/fonts/Ubuntu-Th.ttf', index=0, name='Ubuntu', style='normal', variant='normal', weight=250, stretch='normal', size='scalable')) = 10.1925
2026-07-21 14:55:57 runnervm3jd5f matplotlib.font_manager[2874] DEBUG findfont: score(FontEntry(fname='/home/runner/micromamba/envs/trajan/fonts/Ubuntu-Th.ttf', index=0, name='Ubuntu Thin', style='normal', variant='normal', weight=400, stretch='normal', size='scalable')) = 10.05
2026-07-21 14:55:57 runnervm3jd5f matplotlib.font_manager[2874] DEBUG findfont: score(FontEntry(fname='/home/runner/micromamba/envs/trajan/fonts/SourceCodePro-ExtraLight.ttf', index=0, name='Source Code Pro', style='normal', variant='normal', weight=200, stretch='normal', size='scalable')) = 10.24
2026-07-21 14:55:57 runnervm3jd5f matplotlib.font_manager[2874] DEBUG findfont: score(FontEntry(fname='/home/runner/micromamba/envs/trajan/fonts/SourceCodePro-ExtraLight.ttf', index=0, name='Source Code Pro ExtraLight', style='normal', variant='normal', weight=400, stretch='normal', size='scalable')) = 10.05
2026-07-21 14:55:57 runnervm3jd5f matplotlib.font_manager[2874] DEBUG findfont: score(FontEntry(fname='/usr/share/fonts/truetype/lato/Lato-Thin.ttf', index=0, name='Lato', style='normal', variant='normal', weight=275, stretch='normal', size='scalable')) = 10.16875
2026-07-21 14:55:57 runnervm3jd5f matplotlib.font_manager[2874] DEBUG findfont: score(FontEntry(fname='/usr/share/fonts/truetype/lato/Lato-Thin.ttf', index=0, name='Lato Thin', style='normal', variant='normal', weight=400, stretch='normal', size='scalable')) = 10.05
2026-07-21 14:55:57 runnervm3jd5f matplotlib.font_manager[2874] DEBUG findfont: score(FontEntry(fname='/usr/share/fonts/truetype/liberation/LiberationSerif-Bold.ttf', index=0, name='Liberation Serif', style='normal', variant='normal', weight=700, stretch='normal', size='scalable')) = 10.335
2026-07-21 14:55:57 runnervm3jd5f matplotlib.font_manager[2874] DEBUG findfont: score(FontEntry(fname='/home/runner/micromamba/envs/trajan/fonts/Inconsolata-Regular.ttf', index=0, name='Inconsolata', style='normal', variant='normal', weight=400, stretch='normal', size='scalable')) = 10.05
2026-07-21 14:55:57 runnervm3jd5f matplotlib.font_manager[2874] DEBUG findfont: score(FontEntry(fname='/home/runner/micromamba/envs/trajan/fonts/Ubuntu-C.ttf', index=0, name='Ubuntu Condensed', style='normal', variant='normal', weight=400, stretch='condensed', size='scalable')) = 10.25
2026-07-21 14:55:57 runnervm3jd5f matplotlib.font_manager[2874] DEBUG findfont: score(FontEntry(fname='/usr/share/fonts/truetype/dejavu/DejaVuSansCondensed-Bold.ttf', index=0, name='DejaVu Sans', style='normal', variant='normal', weight=700, stretch='condensed', size='scalable')) = 10.535
2026-07-21 14:55:57 runnervm3jd5f matplotlib.font_manager[2874] DEBUG findfont: score(FontEntry(fname='/usr/share/fonts/truetype/dejavu/DejaVuSansCondensed-Bold.ttf', index=0, name='DejaVu Sans Condensed', style='normal', variant='normal', weight=700, stretch='condensed', size='scalable')) = 10.535
2026-07-21 14:55:57 runnervm3jd5f matplotlib.font_manager[2874] DEBUG findfont: score(FontEntry(fname='/usr/share/fonts/truetype/liberation/LiberationMono-Bold.ttf', index=0, name='Liberation Mono', style='normal', variant='normal', weight=700, stretch='normal', size='scalable')) = 10.335
2026-07-21 14:55:57 runnervm3jd5f matplotlib.font_manager[2874] DEBUG findfont: score(FontEntry(fname='/home/runner/micromamba/envs/trajan/fonts/SourceCodePro-Black.ttf', index=0, name='Source Code Pro', style='normal', variant='normal', weight=900, stretch='normal', size='scalable')) = 10.525
2026-07-21 14:55:57 runnervm3jd5f matplotlib.font_manager[2874] DEBUG findfont: score(FontEntry(fname='/home/runner/micromamba/envs/trajan/fonts/SourceCodePro-Black.ttf', index=0, name='Source Code Pro Black', style='normal', variant='normal', weight=400, stretch='normal', size='scalable')) = 10.05
2026-07-21 14:55:57 runnervm3jd5f matplotlib.font_manager[2874] DEBUG findfont: score(FontEntry(fname='/home/runner/micromamba/envs/trajan/fonts/SourceCodePro-BlackIt.ttf', index=0, name='Source Code Pro', style='italic', variant='normal', weight=900, stretch='normal', size='scalable')) = 11.525
2026-07-21 14:55:57 runnervm3jd5f matplotlib.font_manager[2874] DEBUG findfont: score(FontEntry(fname='/home/runner/micromamba/envs/trajan/fonts/SourceCodePro-BlackIt.ttf', index=0, name='Source Code Pro Black', style='italic', variant='normal', weight=400, stretch='normal', size='scalable')) = 11.05
2026-07-21 14:55:57 runnervm3jd5f matplotlib.font_manager[2874] DEBUG findfont: score(FontEntry(fname='/home/runner/micromamba/envs/trajan/fonts/Ubuntu-LI.ttf', index=0, name='Ubuntu', style='italic', variant='normal', weight=300, stretch='normal', size='scalable')) = 11.145
2026-07-21 14:55:57 runnervm3jd5f matplotlib.font_manager[2874] DEBUG findfont: score(FontEntry(fname='/home/runner/micromamba/envs/trajan/fonts/Ubuntu-LI.ttf', index=0, name='Ubuntu Light', style='italic', variant='normal', weight=400, stretch='normal', size='scalable')) = 11.05
2026-07-21 14:55:57 runnervm3jd5f matplotlib.font_manager[2874] DEBUG findfont: score(FontEntry(fname='/usr/share/fonts/truetype/liberation/LiberationMono-Regular.ttf', index=0, name='Liberation Mono', style='normal', variant='normal', weight=400, stretch='normal', size='scalable')) = 10.05
2026-07-21 14:55:57 runnervm3jd5f matplotlib.font_manager[2874] DEBUG findfont: score(FontEntry(fname='/home/runner/micromamba/envs/trajan/fonts/UbuntuMono-RI.ttf', index=0, name='Ubuntu Mono', style='italic', variant='normal', weight=400, stretch='normal', size='scalable')) = 11.05
2026-07-21 14:55:57 runnervm3jd5f matplotlib.font_manager[2874] DEBUG findfont: score(FontEntry(fname='/usr/share/fonts/truetype/lato/Lato-Heavy.ttf', index=0, name='Lato', style='normal', variant='normal', weight=800, stretch='normal', size='scalable')) = 10.43
2026-07-21 14:55:57 runnervm3jd5f matplotlib.font_manager[2874] DEBUG findfont: score(FontEntry(fname='/usr/share/fonts/truetype/lato/Lato-Heavy.ttf', index=0, name='Lato Heavy', style='normal', variant='normal', weight=400, stretch='normal', size='scalable')) = 10.05
2026-07-21 14:55:57 runnervm3jd5f matplotlib.font_manager[2874] DEBUG findfont: score(FontEntry(fname='/usr/share/fonts/truetype/lato/Lato-HairlineItalic.ttf', index=0, name='Lato', style='italic', variant='normal', weight=250, stretch='normal', size='scalable')) = 11.1925
2026-07-21 14:55:57 runnervm3jd5f matplotlib.font_manager[2874] DEBUG findfont: score(FontEntry(fname='/usr/share/fonts/truetype/lato/Lato-HairlineItalic.ttf', index=0, name='Lato Hairline', style='italic', variant='normal', weight=400, stretch='normal', size='scalable')) = 11.05
2026-07-21 14:55:57 runnervm3jd5f matplotlib.font_manager[2874] DEBUG findfont: score(FontEntry(fname='/usr/share/fonts/truetype/dejavu/DejaVuSerifCondensed-Bold.ttf', index=0, name='DejaVu Serif', style='normal', variant='normal', weight=700, stretch='condensed', size='scalable')) = 10.535
2026-07-21 14:55:57 runnervm3jd5f matplotlib.font_manager[2874] DEBUG findfont: score(FontEntry(fname='/usr/share/fonts/truetype/dejavu/DejaVuSerifCondensed-Bold.ttf', index=0, name='DejaVu Serif Condensed', style='normal', variant='normal', weight=700, stretch='condensed', size='scalable')) = 10.535
2026-07-21 14:55:57 runnervm3jd5f matplotlib.font_manager[2874] DEBUG findfont: score(FontEntry(fname='/usr/share/fonts/truetype/dejavu/DejaVuSansCondensed-Oblique.ttf', index=0, name='DejaVu Sans', style='oblique', variant='normal', weight=400, stretch='condensed', size='scalable')) = 11.25
2026-07-21 14:55:57 runnervm3jd5f matplotlib.font_manager[2874] DEBUG findfont: score(FontEntry(fname='/usr/share/fonts/truetype/dejavu/DejaVuSansCondensed-Oblique.ttf', index=0, name='DejaVu Sans Condensed', style='oblique', variant='normal', weight=400, stretch='condensed', size='scalable')) = 11.25
2026-07-21 14:55:57 runnervm3jd5f matplotlib.font_manager[2874] DEBUG findfont: score(FontEntry(fname='/usr/share/fonts/truetype/lato/Lato-SemiboldItalic.ttf', index=0, name='Lato', style='italic', variant='normal', weight=600, stretch='normal', size='scalable')) = 11.24
2026-07-21 14:55:57 runnervm3jd5f matplotlib.font_manager[2874] DEBUG findfont: score(FontEntry(fname='/usr/share/fonts/truetype/lato/Lato-SemiboldItalic.ttf', index=0, name='Lato Semibold', style='italic', variant='normal', weight=400, stretch='normal', size='scalable')) = 11.05
2026-07-21 14:55:57 runnervm3jd5f matplotlib.font_manager[2874] DEBUG findfont: score(FontEntry(fname='/usr/share/fonts/truetype/lato/Lato-Semibold.ttf', index=0, name='Lato', style='normal', variant='normal', weight=600, stretch='normal', size='scalable')) = 10.24
2026-07-21 14:55:57 runnervm3jd5f matplotlib.font_manager[2874] DEBUG findfont: score(FontEntry(fname='/usr/share/fonts/truetype/lato/Lato-Semibold.ttf', index=0, name='Lato Semibold', style='normal', variant='normal', weight=400, stretch='normal', size='scalable')) = 10.05
2026-07-21 14:55:57 runnervm3jd5f matplotlib.font_manager[2874] DEBUG findfont: score(FontEntry(fname='/home/runner/micromamba/envs/trajan/fonts/Inconsolata-Bold.ttf', index=0, name='Inconsolata', style='normal', variant='normal', weight=700, stretch='normal', size='scalable')) = 10.335
2026-07-21 14:55:57 runnervm3jd5f matplotlib.font_manager[2874] DEBUG findfont: score(FontEntry(fname='/usr/share/fonts/truetype/dejavu/DejaVuSans-ExtraLight.ttf', index=0, name='DejaVu Sans', style='normal', variant='normal', weight=200, stretch='normal', size='scalable')) = 10.24
2026-07-21 14:55:57 runnervm3jd5f matplotlib.font_manager[2874] DEBUG findfont: score(FontEntry(fname='/usr/share/fonts/truetype/dejavu/DejaVuSans-ExtraLight.ttf', index=0, name='DejaVu Sans Light', style='normal', variant='normal', weight=200, stretch='normal', size='scalable')) = 10.24
2026-07-21 14:55:57 runnervm3jd5f matplotlib.font_manager[2874] DEBUG findfont: score(FontEntry(fname='/home/runner/micromamba/envs/trajan/fonts/Ubuntu-BI.ttf', index=0, name='Ubuntu', style='italic', variant='normal', weight=700, stretch='normal', size='scalable')) = 11.335
2026-07-21 14:55:57 runnervm3jd5f matplotlib.font_manager[2874] DEBUG findfont: score(FontEntry(fname='/usr/share/fonts/truetype/dejavu/DejaVuSans-BoldOblique.ttf', index=0, name='DejaVu Sans', style='oblique', variant='normal', weight=700, stretch='normal', size='scalable')) = 11.335
2026-07-21 14:55:57 runnervm3jd5f matplotlib.font_manager[2874] DEBUG findfont: score(FontEntry(fname='/home/runner/micromamba/envs/trajan/fonts/Ubuntu-RI.ttf', index=0, name='Ubuntu', style='italic', variant='normal', weight=400, stretch='normal', size='scalable')) = 11.05
2026-07-21 14:55:57 runnervm3jd5f matplotlib.font_manager[2874] DEBUG findfont: score(FontEntry(fname='/usr/share/fonts/truetype/dejavu/DejaVuSerif-Italic.ttf', index=0, name='DejaVu Serif', style='italic', variant='normal', weight=400, stretch='normal', size='scalable')) = 11.05
2026-07-21 14:55:57 runnervm3jd5f matplotlib.font_manager[2874] DEBUG findfont: score(FontEntry(fname='/home/runner/micromamba/envs/trajan/fonts/SourceCodePro-Medium.ttf', index=0, name='Source Code Pro', style='normal', variant='normal', weight=500, stretch='normal', size='scalable')) = 10.145
2026-07-21 14:55:57 runnervm3jd5f matplotlib.font_manager[2874] DEBUG findfont: score(FontEntry(fname='/home/runner/micromamba/envs/trajan/fonts/SourceCodePro-Medium.ttf', index=0, name='Source Code Pro Medium', style='normal', variant='normal', weight=400, stretch='normal', size='scalable')) = 10.05
2026-07-21 14:55:57 runnervm3jd5f matplotlib.font_manager[2874] DEBUG findfont: score(FontEntry(fname='/usr/share/fonts/truetype/lato/Lato-HeavyItalic.ttf', index=0, name='Lato', style='italic', variant='normal', weight=800, stretch='normal', size='scalable')) = 11.43
2026-07-21 14:55:57 runnervm3jd5f matplotlib.font_manager[2874] DEBUG findfont: score(FontEntry(fname='/usr/share/fonts/truetype/lato/Lato-HeavyItalic.ttf', index=0, name='Lato Heavy', style='italic', variant='normal', weight=400, stretch='normal', size='scalable')) = 11.05
2026-07-21 14:55:57 runnervm3jd5f matplotlib.font_manager[2874] DEBUG findfont: score(FontEntry(fname='/usr/share/fonts/truetype/dejavu/DejaVuSans-Oblique.ttf', index=0, name='DejaVu Sans', style='oblique', variant='normal', weight=400, stretch='normal', size='scalable')) = 11.05
2026-07-21 14:55:57 runnervm3jd5f matplotlib.font_manager[2874] DEBUG findfont: score(FontEntry(fname='/home/runner/micromamba/envs/trajan/fonts/Ubuntu-M.ttf', index=0, name='Ubuntu', style='normal', variant='normal', weight=500, stretch='normal', size='scalable')) = 10.145
2026-07-21 14:55:57 runnervm3jd5f matplotlib.font_manager[2874] DEBUG findfont: score(FontEntry(fname='/home/runner/micromamba/envs/trajan/fonts/Ubuntu-M.ttf', index=0, name='Ubuntu Light', style='normal', variant='normal', weight=700, stretch='normal', size='scalable')) = 10.335
2026-07-21 14:55:57 runnervm3jd5f matplotlib.font_manager[2874] DEBUG findfont: score(FontEntry(fname='/usr/share/fonts/truetype/liberation/LiberationMono-BoldItalic.ttf', index=0, name='Liberation Mono', style='italic', variant='normal', weight=700, stretch='normal', size='scalable')) = 11.335
2026-07-21 14:55:57 runnervm3jd5f matplotlib.font_manager[2874] DEBUG findfont: score(FontEntry(fname='/usr/share/fonts/truetype/dejavu/DejaVuSansMono.ttf', index=0, name='DejaVu Sans Mono', style='normal', variant='normal', weight=400, stretch='normal', size='scalable')) = 0.05
2026-07-21 14:55:57 runnervm3jd5f matplotlib.font_manager[2874] DEBUG findfont: score(FontEntry(fname='/usr/share/fonts/truetype/dejavu/DejaVuMathTeXGyre.ttf', index=0, name='DejaVu Math TeX Gyre', style='normal', variant='normal', weight=400, stretch='normal', size='scalable')) = 10.05
2026-07-21 14:55:57 runnervm3jd5f matplotlib.font_manager[2874] DEBUG findfont: score(FontEntry(fname='/usr/share/fonts/truetype/dejavu/DejaVuSansMono-Oblique.ttf', index=0, name='DejaVu Sans Mono', style='oblique', variant='normal', weight=400, stretch='normal', size='scalable')) = 1.05
2026-07-21 14:55:57 runnervm3jd5f matplotlib.font_manager[2874] DEBUG findfont: score(FontEntry(fname='/home/runner/micromamba/envs/trajan/fonts/Ubuntu-L.ttf', index=0, name='Ubuntu', style='normal', variant='normal', weight=300, stretch='normal', size='scalable')) = 10.145
2026-07-21 14:55:57 runnervm3jd5f matplotlib.font_manager[2874] DEBUG findfont: score(FontEntry(fname='/home/runner/micromamba/envs/trajan/fonts/Ubuntu-L.ttf', index=0, name='Ubuntu Light', style='normal', variant='normal', weight=400, stretch='normal', size='scalable')) = 10.05
2026-07-21 14:55:57 runnervm3jd5f matplotlib.font_manager[2874] DEBUG findfont: score(FontEntry(fname='/home/runner/micromamba/envs/trajan/fonts/SourceCodePro-MediumIt.ttf', index=0, name='Source Code Pro', style='italic', variant='normal', weight=500, stretch='normal', size='scalable')) = 11.145
2026-07-21 14:55:57 runnervm3jd5f matplotlib.font_manager[2874] DEBUG findfont: score(FontEntry(fname='/home/runner/micromamba/envs/trajan/fonts/SourceCodePro-MediumIt.ttf', index=0, name='Source Code Pro Medium', style='italic', variant='normal', weight=400, stretch='normal', size='scalable')) = 11.05
2026-07-21 14:55:57 runnervm3jd5f matplotlib.font_manager[2874] DEBUG findfont: score(FontEntry(fname='/home/runner/micromamba/envs/trajan/fonts/SourceCodePro-Regular.ttf', index=0, name='Source Code Pro', style='normal', variant='normal', weight=400, stretch='normal', size='scalable')) = 10.05
2026-07-21 14:55:57 runnervm3jd5f matplotlib.font_manager[2874] DEBUG findfont: score(FontEntry(fname='/home/runner/micromamba/envs/trajan/fonts/SourceCodePro-SemiboldIt.ttf', index=0, name='Source Code Pro', style='italic', variant='normal', weight=600, stretch='normal', size='scalable')) = 11.24
2026-07-21 14:55:57 runnervm3jd5f matplotlib.font_manager[2874] DEBUG findfont: score(FontEntry(fname='/home/runner/micromamba/envs/trajan/fonts/SourceCodePro-SemiboldIt.ttf', index=0, name='Source Code Pro Semibold', style='italic', variant='normal', weight=400, stretch='normal', size='scalable')) = 11.05
2026-07-21 14:55:57 runnervm3jd5f matplotlib.font_manager[2874] DEBUG findfont: score(FontEntry(fname='/usr/share/fonts/truetype/dejavu/DejaVuSerif.ttf', index=0, name='DejaVu Serif', style='normal', variant='normal', weight=400, stretch='normal', size='scalable')) = 10.05
2026-07-21 14:55:57 runnervm3jd5f matplotlib.font_manager[2874] DEBUG findfont: score(FontEntry(fname='/usr/share/fonts/truetype/dejavu/DejaVuSerif-Bold.ttf', index=0, name='DejaVu Serif', style='normal', variant='normal', weight=700, stretch='normal', size='scalable')) = 10.335
2026-07-21 14:55:57 runnervm3jd5f matplotlib.font_manager[2874] DEBUG findfont: score(FontEntry(fname='/usr/share/fonts/truetype/liberation/LiberationSerif-Italic.ttf', index=0, name='Liberation Serif', style='italic', variant='normal', weight=400, stretch='normal', size='scalable')) = 11.05
2026-07-21 14:55:57 runnervm3jd5f matplotlib.font_manager[2874] DEBUG findfont: score(FontEntry(fname='/usr/share/fonts/truetype/dejavu/DejaVuSansMono-BoldOblique.ttf', index=0, name='DejaVu Sans Mono', style='oblique', variant='normal', weight=700, stretch='normal', size='scalable')) = 1.335
2026-07-21 14:55:57 runnervm3jd5f matplotlib.font_manager[2874] DEBUG findfont: score(FontEntry(fname='/home/runner/micromamba/envs/trajan/fonts/SourceCodePro-Light.ttf', index=0, name='Source Code Pro', style='normal', variant='normal', weight=300, stretch='normal', size='scalable')) = 10.145
2026-07-21 14:55:57 runnervm3jd5f matplotlib.font_manager[2874] DEBUG findfont: score(FontEntry(fname='/home/runner/micromamba/envs/trajan/fonts/SourceCodePro-Light.ttf', index=0, name='Source Code Pro Light', style='normal', variant='normal', weight=400, stretch='normal', size='scalable')) = 10.05
2026-07-21 14:55:57 runnervm3jd5f matplotlib.font_manager[2874] DEBUG findfont: score(FontEntry(fname='/usr/share/fonts/truetype/liberation/LiberationMono-Italic.ttf', index=0, name='Liberation Mono', style='italic', variant='normal', weight=400, stretch='normal', size='scalable')) = 11.05
2026-07-21 14:55:57 runnervm3jd5f matplotlib.font_manager[2874] DEBUG findfont: Matching DejaVu Sans Mono:style=normal:variant=normal:weight=normal:stretch=normal:size=10.0 to DejaVu Sans Mono ('/home/runner/micromamba/envs/trajan/lib/python3.14/site-packages/matplotlib/mpl-data/fonts/ttf/DejaVuSansMono.ttf') with score of 0.050000.
2026-07-21 14:55:57 runnervm3jd5f matplotlib.font_manager[2874] DEBUG findfont: Matching DejaVu Sans Display:style=normal:variant=normal:weight=normal:stretch=normal:size=10.0.
2026-07-21 14:55:57 runnervm3jd5f matplotlib.font_manager[2874] DEBUG findfont: score(FontEntry(fname='/home/runner/micromamba/envs/trajan/lib/python3.14/site-packages/matplotlib/mpl-data/fonts/ttf/cmmi10.ttf', index=0, name='cmmi10', style='normal', variant='normal', weight=400, stretch='normal', size='scalable')) = 10.05
2026-07-21 14:55:57 runnervm3jd5f matplotlib.font_manager[2874] DEBUG findfont: score(FontEntry(fname='/home/runner/micromamba/envs/trajan/lib/python3.14/site-packages/matplotlib/mpl-data/fonts/ttf/DejaVuSerif-Bold.ttf', index=0, name='DejaVu Serif', style='normal', variant='normal', weight=700, stretch='normal', size='scalable')) = 10.335
2026-07-21 14:55:57 runnervm3jd5f matplotlib.font_manager[2874] DEBUG findfont: score(FontEntry(fname='/home/runner/micromamba/envs/trajan/lib/python3.14/site-packages/matplotlib/mpl-data/fonts/ttf/DejaVuSans-Oblique.ttf', index=0, name='DejaVu Sans', style='oblique', variant='normal', weight=400, stretch='normal', size='scalable')) = 11.05
2026-07-21 14:55:57 runnervm3jd5f matplotlib.font_manager[2874] DEBUG findfont: score(FontEntry(fname='/home/runner/micromamba/envs/trajan/lib/python3.14/site-packages/matplotlib/mpl-data/fonts/ttf/STIXSizThreeSymReg.ttf', index=0, name='STIXSizeThreeSym', style='normal', variant='normal', weight=400, stretch='normal', size='scalable')) = 10.05
2026-07-21 14:55:57 runnervm3jd5f matplotlib.font_manager[2874] DEBUG findfont: score(FontEntry(fname='/home/runner/micromamba/envs/trajan/lib/python3.14/site-packages/matplotlib/mpl-data/fonts/ttf/STIXNonUniBolIta.ttf', index=0, name='STIXNonUnicode', style='italic', variant='normal', weight=700, stretch='normal', size='scalable')) = 11.335
2026-07-21 14:55:57 runnervm3jd5f matplotlib.font_manager[2874] DEBUG findfont: score(FontEntry(fname='/home/runner/micromamba/envs/trajan/lib/python3.14/site-packages/matplotlib/mpl-data/fonts/ttf/DejaVuSerifDisplay.ttf', index=0, name='DejaVu Serif Display', style='normal', variant='normal', weight=400, stretch='normal', size='scalable')) = 10.05
2026-07-21 14:55:57 runnervm3jd5f matplotlib.font_manager[2874] DEBUG findfont: score(FontEntry(fname='/home/runner/micromamba/envs/trajan/lib/python3.14/site-packages/matplotlib/mpl-data/fonts/ttf/cmss10.ttf', index=0, name='cmss10', style='normal', variant='normal', weight=400, stretch='normal', size='scalable')) = 10.05
2026-07-21 14:55:57 runnervm3jd5f matplotlib.font_manager[2874] DEBUG findfont: score(FontEntry(fname='/home/runner/micromamba/envs/trajan/lib/python3.14/site-packages/matplotlib/mpl-data/fonts/ttf/STIXGeneralBolIta.ttf', index=0, name='STIXGeneral', style='italic', variant='normal', weight=700, stretch='normal', size='scalable')) = 11.335
2026-07-21 14:55:57 runnervm3jd5f matplotlib.font_manager[2874] DEBUG findfont: score(FontEntry(fname='/home/runner/micromamba/envs/trajan/lib/python3.14/site-packages/matplotlib/mpl-data/fonts/ttf/cmtt10.ttf', index=0, name='cmtt10', style='normal', variant='normal', weight=400, stretch='normal', size='scalable')) = 10.05
2026-07-21 14:55:57 runnervm3jd5f matplotlib.font_manager[2874] DEBUG findfont: score(FontEntry(fname='/home/runner/micromamba/envs/trajan/lib/python3.14/site-packages/matplotlib/mpl-data/fonts/ttf/cmsy10.ttf', index=0, name='cmsy10', style='normal', variant='normal', weight=400, stretch='normal', size='scalable')) = 10.05
2026-07-21 14:55:57 runnervm3jd5f matplotlib.font_manager[2874] DEBUG findfont: score(FontEntry(fname='/home/runner/micromamba/envs/trajan/lib/python3.14/site-packages/matplotlib/mpl-data/fonts/ttf/DejaVuSansMono-Oblique.ttf', index=0, name='DejaVu Sans Mono', style='oblique', variant='normal', weight=400, stretch='normal', size='scalable')) = 11.05
2026-07-21 14:55:57 runnervm3jd5f matplotlib.font_manager[2874] DEBUG findfont: score(FontEntry(fname='/home/runner/micromamba/envs/trajan/lib/python3.14/site-packages/matplotlib/mpl-data/fonts/ttf/STIXNonUniIta.ttf', index=0, name='STIXNonUnicode', style='italic', variant='normal', weight=400, stretch='normal', size='scalable')) = 11.05
2026-07-21 14:55:57 runnervm3jd5f matplotlib.font_manager[2874] DEBUG findfont: score(FontEntry(fname='/home/runner/micromamba/envs/trajan/lib/python3.14/site-packages/matplotlib/mpl-data/fonts/ttf/STIXGeneral.ttf', index=0, name='STIXGeneral', style='normal', variant='normal', weight=400, stretch='normal', size='scalable')) = 10.05
2026-07-21 14:55:57 runnervm3jd5f matplotlib.font_manager[2874] DEBUG findfont: score(FontEntry(fname='/home/runner/micromamba/envs/trajan/lib/python3.14/site-packages/matplotlib/mpl-data/fonts/ttf/cmti10.ttf', index=0, name='cmti10', style='normal', variant='normal', weight=400, stretch='normal', size='scalable')) = 10.05
2026-07-21 14:55:57 runnervm3jd5f matplotlib.font_manager[2874] DEBUG findfont: score(FontEntry(fname='/home/runner/micromamba/envs/trajan/lib/python3.14/site-packages/matplotlib/mpl-data/fonts/ttf/DejaVuSansMono-BoldOblique.ttf', index=0, name='DejaVu Sans Mono', style='oblique', variant='normal', weight=700, stretch='normal', size='scalable')) = 11.335
2026-07-21 14:55:57 runnervm3jd5f matplotlib.font_manager[2874] DEBUG findfont: score(FontEntry(fname='/home/runner/micromamba/envs/trajan/lib/python3.14/site-packages/matplotlib/mpl-data/fonts/ttf/DejaVuSerif.ttf', index=0, name='DejaVu Serif', style='normal', variant='normal', weight=400, stretch='normal', size='scalable')) = 10.05
2026-07-21 14:55:57 runnervm3jd5f matplotlib.font_manager[2874] DEBUG findfont: score(FontEntry(fname='/home/runner/micromamba/envs/trajan/lib/python3.14/site-packages/matplotlib/mpl-data/fonts/ttf/LastResortHE-Regular.ttf', index=0, name='Last Resort High-Efficiency', style='normal', variant='normal', weight=400, stretch='normal', size='scalable')) = 10.05
2026-07-21 14:55:57 runnervm3jd5f matplotlib.font_manager[2874] DEBUG findfont: score(FontEntry(fname='/home/runner/micromamba/envs/trajan/lib/python3.14/site-packages/matplotlib/mpl-data/fonts/ttf/cmex10.ttf', index=0, name='cmex10', style='normal', variant='normal', weight=400, stretch='normal', size='scalable')) = 10.05
2026-07-21 14:55:57 runnervm3jd5f matplotlib.font_manager[2874] DEBUG findfont: score(FontEntry(fname='/home/runner/micromamba/envs/trajan/lib/python3.14/site-packages/matplotlib/mpl-data/fonts/ttf/STIXSizFiveSymReg.ttf', index=0, name='STIXSizeFiveSym', style='normal', variant='normal', weight=400, stretch='normal', size='scalable')) = 10.05
2026-07-21 14:55:57 runnervm3jd5f matplotlib.font_manager[2874] DEBUG findfont: score(FontEntry(fname='/home/runner/micromamba/envs/trajan/lib/python3.14/site-packages/matplotlib/mpl-data/fonts/ttf/STIXNonUniBol.ttf', index=0, name='STIXNonUnicode', style='normal', variant='normal', weight=700, stretch='normal', size='scalable')) = 10.335
2026-07-21 14:55:57 runnervm3jd5f matplotlib.font_manager[2874] DEBUG findfont: score(FontEntry(fname='/home/runner/micromamba/envs/trajan/lib/python3.14/site-packages/matplotlib/mpl-data/fonts/ttf/DejaVuSansDisplay.ttf', index=0, name='DejaVu Sans Display', style='normal', variant='normal', weight=400, stretch='normal', size='scalable')) = 0.05
2026-07-21 14:55:57 runnervm3jd5f matplotlib.font_manager[2874] DEBUG findfont: score(FontEntry(fname='/home/runner/micromamba/envs/trajan/lib/python3.14/site-packages/matplotlib/mpl-data/fonts/ttf/DejaVuSansMono.ttf', index=0, name='DejaVu Sans Mono', style='normal', variant='normal', weight=400, stretch='normal', size='scalable')) = 10.05
2026-07-21 14:55:57 runnervm3jd5f matplotlib.font_manager[2874] DEBUG findfont: score(FontEntry(fname='/home/runner/micromamba/envs/trajan/lib/python3.14/site-packages/matplotlib/mpl-data/fonts/ttf/cmb10.ttf', index=0, name='cmb10', style='normal', variant='normal', weight=400, stretch='normal', size='scalable')) = 10.05
2026-07-21 14:55:57 runnervm3jd5f matplotlib.font_manager[2874] DEBUG findfont: score(FontEntry(fname='/home/runner/micromamba/envs/trajan/lib/python3.14/site-packages/matplotlib/mpl-data/fonts/ttf/STIXSizTwoSymReg.ttf', index=0, name='STIXSizeTwoSym', style='normal', variant='normal', weight=400, stretch='normal', size='scalable')) = 10.05
2026-07-21 14:55:57 runnervm3jd5f matplotlib.font_manager[2874] DEBUG findfont: score(FontEntry(fname='/home/runner/micromamba/envs/trajan/lib/python3.14/site-packages/matplotlib/mpl-data/fonts/ttf/DejaVuSans.ttf', index=0, name='DejaVu Sans', style='normal', variant='normal', weight=400, stretch='normal', size='scalable')) = 10.05
2026-07-21 14:55:57 runnervm3jd5f matplotlib.font_manager[2874] DEBUG findfont: score(FontEntry(fname='/home/runner/micromamba/envs/trajan/lib/python3.14/site-packages/matplotlib/mpl-data/fonts/ttf/STIXNonUni.ttf', index=0, name='STIXNonUnicode', style='normal', variant='normal', weight=400, stretch='normal', size='scalable')) = 10.05
2026-07-21 14:55:57 runnervm3jd5f matplotlib.font_manager[2874] DEBUG findfont: score(FontEntry(fname='/home/runner/micromamba/envs/trajan/lib/python3.14/site-packages/matplotlib/mpl-data/fonts/ttf/STIXGeneralItalic.ttf', index=0, name='STIXGeneral', style='italic', variant='normal', weight=400, stretch='normal', size='scalable')) = 11.05
2026-07-21 14:55:57 runnervm3jd5f matplotlib.font_manager[2874] DEBUG findfont: score(FontEntry(fname='/home/runner/micromamba/envs/trajan/lib/python3.14/site-packages/matplotlib/mpl-data/fonts/ttf/STIXSizOneSymBol.ttf', index=0, name='STIXSizeOneSym', style='normal', variant='normal', weight=700, stretch='normal', size='scalable')) = 10.335
2026-07-21 14:55:57 runnervm3jd5f matplotlib.font_manager[2874] DEBUG findfont: score(FontEntry(fname='/home/runner/micromamba/envs/trajan/lib/python3.14/site-packages/matplotlib/mpl-data/fonts/ttf/DejaVuSansMono-Bold.ttf', index=0, name='DejaVu Sans Mono', style='normal', variant='normal', weight=700, stretch='normal', size='scalable')) = 10.335
2026-07-21 14:55:57 runnervm3jd5f matplotlib.font_manager[2874] DEBUG findfont: score(FontEntry(fname='/home/runner/micromamba/envs/trajan/lib/python3.14/site-packages/matplotlib/mpl-data/fonts/ttf/STIXSizTwoSymBol.ttf', index=0, name='STIXSizeTwoSym', style='normal', variant='normal', weight=700, stretch='normal', size='scalable')) = 10.335
2026-07-21 14:55:57 runnervm3jd5f matplotlib.font_manager[2874] DEBUG findfont: score(FontEntry(fname='/home/runner/micromamba/envs/trajan/lib/python3.14/site-packages/matplotlib/mpl-data/fonts/ttf/STIXSizThreeSymBol.ttf', index=0, name='STIXSizeThreeSym', style='normal', variant='normal', weight=700, stretch='normal', size='scalable')) = 10.335
2026-07-21 14:55:57 runnervm3jd5f matplotlib.font_manager[2874] DEBUG findfont: score(FontEntry(fname='/home/runner/micromamba/envs/trajan/lib/python3.14/site-packages/matplotlib/mpl-data/fonts/ttf/DejaVuSerif-BoldItalic.ttf', index=0, name='DejaVu Serif', style='italic', variant='normal', weight=700, stretch='normal', size='scalable')) = 11.335
2026-07-21 14:55:57 runnervm3jd5f matplotlib.font_manager[2874] DEBUG findfont: score(FontEntry(fname='/home/runner/micromamba/envs/trajan/lib/python3.14/site-packages/matplotlib/mpl-data/fonts/ttf/DejaVuSerif-Italic.ttf', index=0, name='DejaVu Serif', style='italic', variant='normal', weight=400, stretch='normal', size='scalable')) = 11.05
2026-07-21 14:55:57 runnervm3jd5f matplotlib.font_manager[2874] DEBUG findfont: score(FontEntry(fname='/home/runner/micromamba/envs/trajan/lib/python3.14/site-packages/matplotlib/mpl-data/fonts/ttf/DejaVuSans-Bold.ttf', index=0, name='DejaVu Sans', style='normal', variant='normal', weight=700, stretch='normal', size='scalable')) = 10.335
2026-07-21 14:55:57 runnervm3jd5f matplotlib.font_manager[2874] DEBUG findfont: score(FontEntry(fname='/home/runner/micromamba/envs/trajan/lib/python3.14/site-packages/matplotlib/mpl-data/fonts/ttf/STIXSizFourSymBol.ttf', index=0, name='STIXSizeFourSym', style='normal', variant='normal', weight=700, stretch='normal', size='scalable')) = 10.335
2026-07-21 14:55:57 runnervm3jd5f matplotlib.font_manager[2874] DEBUG findfont: score(FontEntry(fname='/home/runner/micromamba/envs/trajan/lib/python3.14/site-packages/matplotlib/mpl-data/fonts/ttf/STIXSizOneSymReg.ttf', index=0, name='STIXSizeOneSym', style='normal', variant='normal', weight=400, stretch='normal', size='scalable')) = 10.05
2026-07-21 14:55:57 runnervm3jd5f matplotlib.font_manager[2874] DEBUG findfont: score(FontEntry(fname='/home/runner/micromamba/envs/trajan/lib/python3.14/site-packages/matplotlib/mpl-data/fonts/ttf/cmr10.ttf', index=0, name='cmr10', style='normal', variant='normal', weight=400, stretch='normal', size='scalable')) = 10.05
2026-07-21 14:55:57 runnervm3jd5f matplotlib.font_manager[2874] DEBUG findfont: score(FontEntry(fname='/home/runner/micromamba/envs/trajan/lib/python3.14/site-packages/matplotlib/mpl-data/fonts/ttf/STIXGeneralBol.ttf', index=0, name='STIXGeneral', style='normal', variant='normal', weight=700, stretch='normal', size='scalable')) = 10.335
2026-07-21 14:55:57 runnervm3jd5f matplotlib.font_manager[2874] DEBUG findfont: score(FontEntry(fname='/home/runner/micromamba/envs/trajan/lib/python3.14/site-packages/matplotlib/mpl-data/fonts/ttf/DejaVuSans-BoldOblique.ttf', index=0, name='DejaVu Sans', style='oblique', variant='normal', weight=700, stretch='normal', size='scalable')) = 11.335
2026-07-21 14:55:57 runnervm3jd5f matplotlib.font_manager[2874] DEBUG findfont: score(FontEntry(fname='/home/runner/micromamba/envs/trajan/lib/python3.14/site-packages/matplotlib/mpl-data/fonts/ttf/STIXSizFourSymReg.ttf', index=0, name='STIXSizeFourSym', style='normal', variant='normal', weight=400, stretch='normal', size='scalable')) = 10.05
2026-07-21 14:55:57 runnervm3jd5f matplotlib.font_manager[2874] DEBUG findfont: score(FontEntry(fname='/usr/share/fonts/truetype/lato/Lato-Black.ttf', index=0, name='Lato', style='normal', variant='normal', weight=900, stretch='normal', size='scalable')) = 10.525
2026-07-21 14:55:57 runnervm3jd5f matplotlib.font_manager[2874] DEBUG findfont: score(FontEntry(fname='/usr/share/fonts/truetype/lato/Lato-Black.ttf', index=0, name='Lato Black', style='normal', variant='normal', weight=400, stretch='normal', size='scalable')) = 10.05
2026-07-21 14:55:57 runnervm3jd5f matplotlib.font_manager[2874] DEBUG findfont: score(FontEntry(fname='/usr/share/fonts/truetype/liberation/LiberationSerif-Regular.ttf', index=0, name='Liberation Serif', style='normal', variant='normal', weight=400, stretch='normal', size='scalable')) = 10.05
2026-07-21 14:55:57 runnervm3jd5f matplotlib.font_manager[2874] DEBUG findfont: score(FontEntry(fname='/usr/share/fonts/truetype/dejavu/DejaVuSerifCondensed.ttf', index=0, name='DejaVu Serif', style='normal', variant='normal', weight=400, stretch='condensed', size='scalable')) = 10.25
2026-07-21 14:55:57 runnervm3jd5f matplotlib.font_manager[2874] DEBUG findfont: score(FontEntry(fname='/usr/share/fonts/truetype/dejavu/DejaVuSerifCondensed.ttf', index=0, name='DejaVu Serif Condensed', style='normal', variant='normal', weight=380, stretch='condensed', size='scalable')) = 10.269
2026-07-21 14:55:57 runnervm3jd5f matplotlib.font_manager[2874] DEBUG findfont: score(FontEntry(fname='/home/runner/micromamba/envs/trajan/fonts/UbuntuMono-BI.ttf', index=0, name='Ubuntu Mono', style='italic', variant='normal', weight=700, stretch='normal', size='scalable')) = 11.335
2026-07-21 14:55:57 runnervm3jd5f matplotlib.font_manager[2874] DEBUG findfont: score(FontEntry(fname='/usr/share/fonts/truetype/dejavu/DejaVuSans.ttf', index=0, name='DejaVu Sans', style='normal', variant='normal', weight=400, stretch='normal', size='scalable')) = 10.05
2026-07-21 14:55:57 runnervm3jd5f matplotlib.font_manager[2874] DEBUG findfont: score(FontEntry(fname='/usr/share/fonts/truetype/lato/Lato-Italic.ttf', index=0, name='Lato', style='italic', variant='normal', weight=400, stretch='normal', size='scalable')) = 11.05
2026-07-21 14:55:57 runnervm3jd5f matplotlib.font_manager[2874] DEBUG findfont: score(FontEntry(fname='/usr/share/fonts/truetype/liberation/LiberationSans-Italic.ttf', index=0, name='Liberation Sans', style='italic', variant='normal', weight=400, stretch='normal', size='scalable')) = 11.05
2026-07-21 14:55:57 runnervm3jd5f matplotlib.font_manager[2874] DEBUG findfont: score(FontEntry(fname='/home/runner/micromamba/envs/trajan/fonts/Ubuntu-B.ttf', index=0, name='Ubuntu', style='normal', variant='normal', weight=700, stretch='normal', size='scalable')) = 10.335
2026-07-21 14:55:57 runnervm3jd5f matplotlib.font_manager[2874] DEBUG findfont: score(FontEntry(fname='/home/runner/micromamba/envs/trajan/fonts/SourceCodePro-Semibold.ttf', index=0, name='Source Code Pro', style='normal', variant='normal', weight=600, stretch='normal', size='scalable')) = 10.24
2026-07-21 14:55:57 runnervm3jd5f matplotlib.font_manager[2874] DEBUG findfont: score(FontEntry(fname='/home/runner/micromamba/envs/trajan/fonts/SourceCodePro-Semibold.ttf', index=0, name='Source Code Pro Semibold', style='normal', variant='normal', weight=400, stretch='normal', size='scalable')) = 10.05
2026-07-21 14:55:57 runnervm3jd5f matplotlib.font_manager[2874] DEBUG findfont: score(FontEntry(fname='/home/runner/micromamba/envs/trajan/fonts/SourceCodePro-Bold.ttf', index=0, name='Source Code Pro', style='normal', variant='normal', weight=700, stretch='normal', size='scalable')) = 10.335
2026-07-21 14:55:57 runnervm3jd5f matplotlib.font_manager[2874] DEBUG findfont: score(FontEntry(fname='/home/runner/micromamba/envs/trajan/fonts/Ubuntu-MI.ttf', index=0, name='Ubuntu', style='italic', variant='normal', weight=500, stretch='normal', size='scalable')) = 11.145
2026-07-21 14:55:57 runnervm3jd5f matplotlib.font_manager[2874] DEBUG findfont: score(FontEntry(fname='/home/runner/micromamba/envs/trajan/fonts/Ubuntu-MI.ttf', index=0, name='Ubuntu Light', style='italic', variant='normal', weight=700, stretch='normal', size='scalable')) = 11.335
2026-07-21 14:55:57 runnervm3jd5f matplotlib.font_manager[2874] DEBUG findfont: score(FontEntry(fname='/usr/share/fonts/truetype/lato/Lato-Regular.ttf', index=0, name='Lato', style='normal', variant='normal', weight=400, stretch='normal', size='scalable')) = 10.05
2026-07-21 14:55:57 runnervm3jd5f matplotlib.font_manager[2874] DEBUG findfont: score(FontEntry(fname='/usr/share/fonts/truetype/lato/Lato-ThinItalic.ttf', index=0, name='Lato', style='italic', variant='normal', weight=275, stretch='normal', size='scalable')) = 11.16875
2026-07-21 14:55:57 runnervm3jd5f matplotlib.font_manager[2874] DEBUG findfont: score(FontEntry(fname='/usr/share/fonts/truetype/lato/Lato-ThinItalic.ttf', index=0, name='Lato Thin', style='italic', variant='normal', weight=400, stretch='normal', size='scalable')) = 11.05
2026-07-21 14:55:57 runnervm3jd5f matplotlib.font_manager[2874] DEBUG findfont: score(FontEntry(fname='/usr/share/fonts/truetype/lato/Lato-BlackItalic.ttf', index=0, name='Lato', style='italic', variant='normal', weight=900, stretch='normal', size='scalable')) = 11.525
2026-07-21 14:55:57 runnervm3jd5f matplotlib.font_manager[2874] DEBUG findfont: score(FontEntry(fname='/usr/share/fonts/truetype/lato/Lato-BlackItalic.ttf', index=0, name='Lato Black', style='italic', variant='normal', weight=400, stretch='normal', size='scalable')) = 11.05
2026-07-21 14:55:57 runnervm3jd5f matplotlib.font_manager[2874] DEBUG findfont: score(FontEntry(fname='/usr/share/fonts/truetype/dejavu/DejaVuSerifCondensed-Italic.ttf', index=0, name='DejaVu Serif', style='italic', variant='normal', weight=400, stretch='condensed', size='scalable')) = 11.25
2026-07-21 14:55:57 runnervm3jd5f matplotlib.font_manager[2874] DEBUG findfont: score(FontEntry(fname='/usr/share/fonts/truetype/dejavu/DejaVuSerifCondensed-Italic.ttf', index=0, name='DejaVu Serif Condensed', style='italic', variant='normal', weight=400, stretch='condensed', size='scalable')) = 11.25
2026-07-21 14:55:57 runnervm3jd5f matplotlib.font_manager[2874] DEBUG findfont: score(FontEntry(fname='/usr/share/fonts/truetype/dejavu/DejaVuSans-Bold.ttf', index=0, name='DejaVu Sans', style='normal', variant='normal', weight=700, stretch='normal', size='scalable')) = 10.335
2026-07-21 14:55:57 runnervm3jd5f matplotlib.font_manager[2874] DEBUG findfont: score(FontEntry(fname='/home/runner/micromamba/envs/trajan/fonts/UbuntuMono-R.ttf', index=0, name='Ubuntu Mono', style='normal', variant='normal', weight=400, stretch='normal', size='scalable')) = 10.05
2026-07-21 14:55:57 runnervm3jd5f matplotlib.font_manager[2874] DEBUG findfont: score(FontEntry(fname='/usr/share/fonts/truetype/dejavu/DejaVuSerif-BoldItalic.ttf', index=0, name='DejaVu Serif', style='italic', variant='normal', weight=700, stretch='normal', size='scalable')) = 11.335
2026-07-21 14:55:57 runnervm3jd5f matplotlib.font_manager[2874] DEBUG findfont: score(FontEntry(fname='/usr/share/fonts/truetype/lato/Lato-Hairline.ttf', index=0, name='Lato', style='normal', variant='normal', weight=250, stretch='normal', size='scalable')) = 10.1925
2026-07-21 14:55:57 runnervm3jd5f matplotlib.font_manager[2874] DEBUG findfont: score(FontEntry(fname='/usr/share/fonts/truetype/lato/Lato-Hairline.ttf', index=0, name='Lato Hairline', style='normal', variant='normal', weight=400, stretch='normal', size='scalable')) = 10.05
2026-07-21 14:55:57 runnervm3jd5f matplotlib.font_manager[2874] DEBUG findfont: score(FontEntry(fname='/usr/share/fonts/truetype/lato/Lato-LightItalic.ttf', index=0, name='Lato', style='italic', variant='normal', weight=300, stretch='normal', size='scalable')) = 11.145
2026-07-21 14:55:57 runnervm3jd5f matplotlib.font_manager[2874] DEBUG findfont: score(FontEntry(fname='/usr/share/fonts/truetype/lato/Lato-LightItalic.ttf', index=0, name='Lato Light', style='italic', variant='normal', weight=400, stretch='normal', size='scalable')) = 11.05
2026-07-21 14:55:57 runnervm3jd5f matplotlib.font_manager[2874] DEBUG findfont: score(FontEntry(fname='/usr/share/fonts/truetype/dejavu/DejaVuSansCondensed-BoldOblique.ttf', index=0, name='DejaVu Sans', style='oblique', variant='normal', weight=700, stretch='condensed', size='scalable')) = 11.535
2026-07-21 14:55:57 runnervm3jd5f matplotlib.font_manager[2874] DEBUG findfont: score(FontEntry(fname='/usr/share/fonts/truetype/dejavu/DejaVuSansCondensed-BoldOblique.ttf', index=0, name='DejaVu Sans Condensed', style='oblique', variant='normal', weight=700, stretch='condensed', size='scalable')) = 11.535
2026-07-21 14:55:57 runnervm3jd5f matplotlib.font_manager[2874] DEBUG findfont: score(FontEntry(fname='/home/runner/micromamba/envs/trajan/fonts/SourceCodePro-It.ttf', index=0, name='Source Code Pro', style='italic', variant='normal', weight=400, stretch='normal', size='scalable')) = 11.05
2026-07-21 14:55:57 runnervm3jd5f matplotlib.font_manager[2874] DEBUG findfont: score(FontEntry(fname='/home/runner/micromamba/envs/trajan/fonts/SourceCodePro-ExtraLightIt.ttf', index=0, name='Source Code Pro', style='italic', variant='normal', weight=200, stretch='normal', size='scalable')) = 11.24
2026-07-21 14:55:57 runnervm3jd5f matplotlib.font_manager[2874] DEBUG findfont: score(FontEntry(fname='/home/runner/micromamba/envs/trajan/fonts/SourceCodePro-ExtraLightIt.ttf', index=0, name='Source Code Pro ExtraLight', style='italic', variant='normal', weight=400, stretch='normal', size='scalable')) = 11.05
2026-07-21 14:55:57 runnervm3jd5f matplotlib.font_manager[2874] DEBUG findfont: score(FontEntry(fname='/usr/share/fonts/truetype/lato/Lato-Medium.ttf', index=0, name='Lato', style='normal', variant='normal', weight=500, stretch='normal', size='scalable')) = 10.145
2026-07-21 14:55:57 runnervm3jd5f matplotlib.font_manager[2874] DEBUG findfont: score(FontEntry(fname='/usr/share/fonts/truetype/lato/Lato-Medium.ttf', index=0, name='Lato Medium', style='normal', variant='normal', weight=400, stretch='normal', size='scalable')) = 10.05
2026-07-21 14:55:57 runnervm3jd5f matplotlib.font_manager[2874] DEBUG findfont: score(FontEntry(fname='/usr/share/fonts/truetype/lato/Lato-BoldItalic.ttf', index=0, name='Lato', style='italic', variant='normal', weight=700, stretch='normal', size='scalable')) = 11.335
2026-07-21 14:55:57 runnervm3jd5f matplotlib.font_manager[2874] DEBUG findfont: score(FontEntry(fname='/home/runner/micromamba/envs/trajan/fonts/DejaVuSans.ttf', index=0, name='DejaVu Sans', style='normal', variant='normal', weight=400, stretch='normal', size='scalable')) = 10.05
2026-07-21 14:55:57 runnervm3jd5f matplotlib.font_manager[2874] DEBUG findfont: score(FontEntry(fname='/home/runner/micromamba/envs/trajan/fonts/UbuntuMono-B.ttf', index=0, name='Ubuntu Mono', style='normal', variant='normal', weight=700, stretch='normal', size='scalable')) = 10.335
2026-07-21 14:55:57 runnervm3jd5f matplotlib.font_manager[2874] DEBUG findfont: score(FontEntry(fname='/home/runner/micromamba/envs/trajan/fonts/SourceCodePro-LightIt.ttf', index=0, name='Source Code Pro', style='italic', variant='normal', weight=300, stretch='normal', size='scalable')) = 11.145
2026-07-21 14:55:57 runnervm3jd5f matplotlib.font_manager[2874] DEBUG findfont: score(FontEntry(fname='/home/runner/micromamba/envs/trajan/fonts/SourceCodePro-LightIt.ttf', index=0, name='Source Code Pro Light', style='italic', variant='normal', weight=400, stretch='normal', size='scalable')) = 11.05
2026-07-21 14:55:57 runnervm3jd5f matplotlib.font_manager[2874] DEBUG findfont: score(FontEntry(fname='/usr/share/fonts/truetype/liberation/LiberationSans-BoldItalic.ttf', index=0, name='Liberation Sans', style='italic', variant='normal', weight=700, stretch='normal', size='scalable')) = 11.335
2026-07-21 14:55:57 runnervm3jd5f matplotlib.font_manager[2874] DEBUG findfont: score(FontEntry(fname='/usr/share/fonts/truetype/liberation/LiberationSans-Regular.ttf', index=0, name='Liberation Sans', style='normal', variant='normal', weight=400, stretch='normal', size='scalable')) = 10.05
2026-07-21 14:55:57 runnervm3jd5f matplotlib.font_manager[2874] DEBUG findfont: score(FontEntry(fname='/usr/share/fonts/truetype/dejavu/DejaVuSansMono-Bold.ttf', index=0, name='DejaVu Sans Mono', style='normal', variant='normal', weight=700, stretch='normal', size='scalable')) = 10.335
2026-07-21 14:55:57 runnervm3jd5f matplotlib.font_manager[2874] DEBUG findfont: score(FontEntry(fname='/home/runner/micromamba/envs/trajan/fonts/SourceCodePro-BoldIt.ttf', index=0, name='Source Code Pro', style='italic', variant='normal', weight=700, stretch='normal', size='scalable')) = 11.335
2026-07-21 14:55:57 runnervm3jd5f matplotlib.font_manager[2874] DEBUG findfont: score(FontEntry(fname='/usr/share/fonts/truetype/lato/Lato-Bold.ttf', index=0, name='Lato', style='normal', variant='normal', weight=700, stretch='normal', size='scalable')) = 10.335
2026-07-21 14:55:57 runnervm3jd5f matplotlib.font_manager[2874] DEBUG findfont: score(FontEntry(fname='/usr/share/fonts/truetype/dejavu/DejaVuSansCondensed.ttf', index=0, name='DejaVu Sans', style='normal', variant='normal', weight=400, stretch='condensed', size='scalable')) = 10.25
2026-07-21 14:55:57 runnervm3jd5f matplotlib.font_manager[2874] DEBUG findfont: score(FontEntry(fname='/usr/share/fonts/truetype/dejavu/DejaVuSansCondensed.ttf', index=0, name='DejaVu Sans Condensed', style='normal', variant='normal', weight=380, stretch='condensed', size='scalable')) = 10.269
2026-07-21 14:55:57 runnervm3jd5f matplotlib.font_manager[2874] DEBUG findfont: score(FontEntry(fname='/usr/share/fonts/truetype/lato/Lato-MediumItalic.ttf', index=0, name='Lato', style='italic', variant='normal', weight=500, stretch='normal', size='scalable')) = 11.145
2026-07-21 14:55:57 runnervm3jd5f matplotlib.font_manager[2874] DEBUG findfont: score(FontEntry(fname='/usr/share/fonts/truetype/lato/Lato-MediumItalic.ttf', index=0, name='Lato Medium', style='italic', variant='normal', weight=400, stretch='normal', size='scalable')) = 11.05
2026-07-21 14:55:57 runnervm3jd5f matplotlib.font_manager[2874] DEBUG findfont: score(FontEntry(fname='/usr/share/fonts/truetype/liberation/LiberationSans-Bold.ttf', index=0, name='Liberation Sans', style='normal', variant='normal', weight=700, stretch='normal', size='scalable')) = 10.335
2026-07-21 14:55:57 runnervm3jd5f matplotlib.font_manager[2874] DEBUG findfont: score(FontEntry(fname='/usr/share/fonts/truetype/dejavu/DejaVuSerifCondensed-BoldItalic.ttf', index=0, name='DejaVu Serif', style='italic', variant='normal', weight=700, stretch='condensed', size='scalable')) = 11.535
2026-07-21 14:55:57 runnervm3jd5f matplotlib.font_manager[2874] DEBUG findfont: score(FontEntry(fname='/usr/share/fonts/truetype/dejavu/DejaVuSerifCondensed-BoldItalic.ttf', index=0, name='DejaVu Serif Condensed', style='italic', variant='normal', weight=700, stretch='condensed', size='scalable')) = 11.535
2026-07-21 14:55:57 runnervm3jd5f matplotlib.font_manager[2874] DEBUG findfont: score(FontEntry(fname='/home/runner/micromamba/envs/trajan/fonts/Ubuntu-R.ttf', index=0, name='Ubuntu', style='normal', variant='normal', weight=400, stretch='normal', size='scalable')) = 10.05
2026-07-21 14:55:57 runnervm3jd5f matplotlib.font_manager[2874] DEBUG findfont: score(FontEntry(fname='/usr/share/fonts/truetype/lato/Lato-Light.ttf', index=0, name='Lato', style='normal', variant='normal', weight=300, stretch='normal', size='scalable')) = 10.145
2026-07-21 14:55:57 runnervm3jd5f matplotlib.font_manager[2874] DEBUG findfont: score(FontEntry(fname='/usr/share/fonts/truetype/lato/Lato-Light.ttf', index=0, name='Lato Light', style='normal', variant='normal', weight=400, stretch='normal', size='scalable')) = 10.05
2026-07-21 14:55:57 runnervm3jd5f matplotlib.font_manager[2874] DEBUG findfont: score(FontEntry(fname='/usr/share/fonts/truetype/liberation/LiberationSerif-BoldItalic.ttf', index=0, name='Liberation Serif', style='italic', variant='normal', weight=700, stretch='normal', size='scalable')) = 11.335
2026-07-21 14:55:57 runnervm3jd5f matplotlib.font_manager[2874] DEBUG findfont: score(FontEntry(fname='/home/runner/micromamba/envs/trajan/fonts/Ubuntu-Th.ttf', index=0, name='Ubuntu', style='normal', variant='normal', weight=250, stretch='normal', size='scalable')) = 10.1925
2026-07-21 14:55:57 runnervm3jd5f matplotlib.font_manager[2874] DEBUG findfont: score(FontEntry(fname='/home/runner/micromamba/envs/trajan/fonts/Ubuntu-Th.ttf', index=0, name='Ubuntu Thin', style='normal', variant='normal', weight=400, stretch='normal', size='scalable')) = 10.05
2026-07-21 14:55:57 runnervm3jd5f matplotlib.font_manager[2874] DEBUG findfont: score(FontEntry(fname='/home/runner/micromamba/envs/trajan/fonts/SourceCodePro-ExtraLight.ttf', index=0, name='Source Code Pro', style='normal', variant='normal', weight=200, stretch='normal', size='scalable')) = 10.24
2026-07-21 14:55:57 runnervm3jd5f matplotlib.font_manager[2874] DEBUG findfont: score(FontEntry(fname='/home/runner/micromamba/envs/trajan/fonts/SourceCodePro-ExtraLight.ttf', index=0, name='Source Code Pro ExtraLight', style='normal', variant='normal', weight=400, stretch='normal', size='scalable')) = 10.05
2026-07-21 14:55:57 runnervm3jd5f matplotlib.font_manager[2874] DEBUG findfont: score(FontEntry(fname='/usr/share/fonts/truetype/lato/Lato-Thin.ttf', index=0, name='Lato', style='normal', variant='normal', weight=275, stretch='normal', size='scalable')) = 10.16875
2026-07-21 14:55:57 runnervm3jd5f matplotlib.font_manager[2874] DEBUG findfont: score(FontEntry(fname='/usr/share/fonts/truetype/lato/Lato-Thin.ttf', index=0, name='Lato Thin', style='normal', variant='normal', weight=400, stretch='normal', size='scalable')) = 10.05
2026-07-21 14:55:57 runnervm3jd5f matplotlib.font_manager[2874] DEBUG findfont: score(FontEntry(fname='/usr/share/fonts/truetype/liberation/LiberationSerif-Bold.ttf', index=0, name='Liberation Serif', style='normal', variant='normal', weight=700, stretch='normal', size='scalable')) = 10.335
2026-07-21 14:55:57 runnervm3jd5f matplotlib.font_manager[2874] DEBUG findfont: score(FontEntry(fname='/home/runner/micromamba/envs/trajan/fonts/Inconsolata-Regular.ttf', index=0, name='Inconsolata', style='normal', variant='normal', weight=400, stretch='normal', size='scalable')) = 10.05
2026-07-21 14:55:57 runnervm3jd5f matplotlib.font_manager[2874] DEBUG findfont: score(FontEntry(fname='/home/runner/micromamba/envs/trajan/fonts/Ubuntu-C.ttf', index=0, name='Ubuntu Condensed', style='normal', variant='normal', weight=400, stretch='condensed', size='scalable')) = 10.25
2026-07-21 14:55:57 runnervm3jd5f matplotlib.font_manager[2874] DEBUG findfont: score(FontEntry(fname='/usr/share/fonts/truetype/dejavu/DejaVuSansCondensed-Bold.ttf', index=0, name='DejaVu Sans', style='normal', variant='normal', weight=700, stretch='condensed', size='scalable')) = 10.535
2026-07-21 14:55:57 runnervm3jd5f matplotlib.font_manager[2874] DEBUG findfont: score(FontEntry(fname='/usr/share/fonts/truetype/dejavu/DejaVuSansCondensed-Bold.ttf', index=0, name='DejaVu Sans Condensed', style='normal', variant='normal', weight=700, stretch='condensed', size='scalable')) = 10.535
2026-07-21 14:55:57 runnervm3jd5f matplotlib.font_manager[2874] DEBUG findfont: score(FontEntry(fname='/usr/share/fonts/truetype/liberation/LiberationMono-Bold.ttf', index=0, name='Liberation Mono', style='normal', variant='normal', weight=700, stretch='normal', size='scalable')) = 10.335
2026-07-21 14:55:57 runnervm3jd5f matplotlib.font_manager[2874] DEBUG findfont: score(FontEntry(fname='/home/runner/micromamba/envs/trajan/fonts/SourceCodePro-Black.ttf', index=0, name='Source Code Pro', style='normal', variant='normal', weight=900, stretch='normal', size='scalable')) = 10.525
2026-07-21 14:55:57 runnervm3jd5f matplotlib.font_manager[2874] DEBUG findfont: score(FontEntry(fname='/home/runner/micromamba/envs/trajan/fonts/SourceCodePro-Black.ttf', index=0, name='Source Code Pro Black', style='normal', variant='normal', weight=400, stretch='normal', size='scalable')) = 10.05
2026-07-21 14:55:57 runnervm3jd5f matplotlib.font_manager[2874] DEBUG findfont: score(FontEntry(fname='/home/runner/micromamba/envs/trajan/fonts/SourceCodePro-BlackIt.ttf', index=0, name='Source Code Pro', style='italic', variant='normal', weight=900, stretch='normal', size='scalable')) = 11.525
2026-07-21 14:55:57 runnervm3jd5f matplotlib.font_manager[2874] DEBUG findfont: score(FontEntry(fname='/home/runner/micromamba/envs/trajan/fonts/SourceCodePro-BlackIt.ttf', index=0, name='Source Code Pro Black', style='italic', variant='normal', weight=400, stretch='normal', size='scalable')) = 11.05
2026-07-21 14:55:57 runnervm3jd5f matplotlib.font_manager[2874] DEBUG findfont: score(FontEntry(fname='/home/runner/micromamba/envs/trajan/fonts/Ubuntu-LI.ttf', index=0, name='Ubuntu', style='italic', variant='normal', weight=300, stretch='normal', size='scalable')) = 11.145
2026-07-21 14:55:57 runnervm3jd5f matplotlib.font_manager[2874] DEBUG findfont: score(FontEntry(fname='/home/runner/micromamba/envs/trajan/fonts/Ubuntu-LI.ttf', index=0, name='Ubuntu Light', style='italic', variant='normal', weight=400, stretch='normal', size='scalable')) = 11.05
2026-07-21 14:55:57 runnervm3jd5f matplotlib.font_manager[2874] DEBUG findfont: score(FontEntry(fname='/usr/share/fonts/truetype/liberation/LiberationMono-Regular.ttf', index=0, name='Liberation Mono', style='normal', variant='normal', weight=400, stretch='normal', size='scalable')) = 10.05
2026-07-21 14:55:57 runnervm3jd5f matplotlib.font_manager[2874] DEBUG findfont: score(FontEntry(fname='/home/runner/micromamba/envs/trajan/fonts/UbuntuMono-RI.ttf', index=0, name='Ubuntu Mono', style='italic', variant='normal', weight=400, stretch='normal', size='scalable')) = 11.05
2026-07-21 14:55:57 runnervm3jd5f matplotlib.font_manager[2874] DEBUG findfont: score(FontEntry(fname='/usr/share/fonts/truetype/lato/Lato-Heavy.ttf', index=0, name='Lato', style='normal', variant='normal', weight=800, stretch='normal', size='scalable')) = 10.43
2026-07-21 14:55:57 runnervm3jd5f matplotlib.font_manager[2874] DEBUG findfont: score(FontEntry(fname='/usr/share/fonts/truetype/lato/Lato-Heavy.ttf', index=0, name='Lato Heavy', style='normal', variant='normal', weight=400, stretch='normal', size='scalable')) = 10.05
2026-07-21 14:55:57 runnervm3jd5f matplotlib.font_manager[2874] DEBUG findfont: score(FontEntry(fname='/usr/share/fonts/truetype/lato/Lato-HairlineItalic.ttf', index=0, name='Lato', style='italic', variant='normal', weight=250, stretch='normal', size='scalable')) = 11.1925
2026-07-21 14:55:57 runnervm3jd5f matplotlib.font_manager[2874] DEBUG findfont: score(FontEntry(fname='/usr/share/fonts/truetype/lato/Lato-HairlineItalic.ttf', index=0, name='Lato Hairline', style='italic', variant='normal', weight=400, stretch='normal', size='scalable')) = 11.05
2026-07-21 14:55:57 runnervm3jd5f matplotlib.font_manager[2874] DEBUG findfont: score(FontEntry(fname='/usr/share/fonts/truetype/dejavu/DejaVuSerifCondensed-Bold.ttf', index=0, name='DejaVu Serif', style='normal', variant='normal', weight=700, stretch='condensed', size='scalable')) = 10.535
2026-07-21 14:55:57 runnervm3jd5f matplotlib.font_manager[2874] DEBUG findfont: score(FontEntry(fname='/usr/share/fonts/truetype/dejavu/DejaVuSerifCondensed-Bold.ttf', index=0, name='DejaVu Serif Condensed', style='normal', variant='normal', weight=700, stretch='condensed', size='scalable')) = 10.535
2026-07-21 14:55:57 runnervm3jd5f matplotlib.font_manager[2874] DEBUG findfont: score(FontEntry(fname='/usr/share/fonts/truetype/dejavu/DejaVuSansCondensed-Oblique.ttf', index=0, name='DejaVu Sans', style='oblique', variant='normal', weight=400, stretch='condensed', size='scalable')) = 11.25
2026-07-21 14:55:57 runnervm3jd5f matplotlib.font_manager[2874] DEBUG findfont: score(FontEntry(fname='/usr/share/fonts/truetype/dejavu/DejaVuSansCondensed-Oblique.ttf', index=0, name='DejaVu Sans Condensed', style='oblique', variant='normal', weight=400, stretch='condensed', size='scalable')) = 11.25
2026-07-21 14:55:57 runnervm3jd5f matplotlib.font_manager[2874] DEBUG findfont: score(FontEntry(fname='/usr/share/fonts/truetype/lato/Lato-SemiboldItalic.ttf', index=0, name='Lato', style='italic', variant='normal', weight=600, stretch='normal', size='scalable')) = 11.24
2026-07-21 14:55:57 runnervm3jd5f matplotlib.font_manager[2874] DEBUG findfont: score(FontEntry(fname='/usr/share/fonts/truetype/lato/Lato-SemiboldItalic.ttf', index=0, name='Lato Semibold', style='italic', variant='normal', weight=400, stretch='normal', size='scalable')) = 11.05
2026-07-21 14:55:57 runnervm3jd5f matplotlib.font_manager[2874] DEBUG findfont: score(FontEntry(fname='/usr/share/fonts/truetype/lato/Lato-Semibold.ttf', index=0, name='Lato', style='normal', variant='normal', weight=600, stretch='normal', size='scalable')) = 10.24
2026-07-21 14:55:57 runnervm3jd5f matplotlib.font_manager[2874] DEBUG findfont: score(FontEntry(fname='/usr/share/fonts/truetype/lato/Lato-Semibold.ttf', index=0, name='Lato Semibold', style='normal', variant='normal', weight=400, stretch='normal', size='scalable')) = 10.05
2026-07-21 14:55:57 runnervm3jd5f matplotlib.font_manager[2874] DEBUG findfont: score(FontEntry(fname='/home/runner/micromamba/envs/trajan/fonts/Inconsolata-Bold.ttf', index=0, name='Inconsolata', style='normal', variant='normal', weight=700, stretch='normal', size='scalable')) = 10.335
2026-07-21 14:55:57 runnervm3jd5f matplotlib.font_manager[2874] DEBUG findfont: score(FontEntry(fname='/usr/share/fonts/truetype/dejavu/DejaVuSans-ExtraLight.ttf', index=0, name='DejaVu Sans', style='normal', variant='normal', weight=200, stretch='normal', size='scalable')) = 10.24
2026-07-21 14:55:57 runnervm3jd5f matplotlib.font_manager[2874] DEBUG findfont: score(FontEntry(fname='/usr/share/fonts/truetype/dejavu/DejaVuSans-ExtraLight.ttf', index=0, name='DejaVu Sans Light', style='normal', variant='normal', weight=200, stretch='normal', size='scalable')) = 10.24
2026-07-21 14:55:57 runnervm3jd5f matplotlib.font_manager[2874] DEBUG findfont: score(FontEntry(fname='/home/runner/micromamba/envs/trajan/fonts/Ubuntu-BI.ttf', index=0, name='Ubuntu', style='italic', variant='normal', weight=700, stretch='normal', size='scalable')) = 11.335
2026-07-21 14:55:57 runnervm3jd5f matplotlib.font_manager[2874] DEBUG findfont: score(FontEntry(fname='/usr/share/fonts/truetype/dejavu/DejaVuSans-BoldOblique.ttf', index=0, name='DejaVu Sans', style='oblique', variant='normal', weight=700, stretch='normal', size='scalable')) = 11.335
2026-07-21 14:55:57 runnervm3jd5f matplotlib.font_manager[2874] DEBUG findfont: score(FontEntry(fname='/home/runner/micromamba/envs/trajan/fonts/Ubuntu-RI.ttf', index=0, name='Ubuntu', style='italic', variant='normal', weight=400, stretch='normal', size='scalable')) = 11.05
2026-07-21 14:55:57 runnervm3jd5f matplotlib.font_manager[2874] DEBUG findfont: score(FontEntry(fname='/usr/share/fonts/truetype/dejavu/DejaVuSerif-Italic.ttf', index=0, name='DejaVu Serif', style='italic', variant='normal', weight=400, stretch='normal', size='scalable')) = 11.05
2026-07-21 14:55:57 runnervm3jd5f matplotlib.font_manager[2874] DEBUG findfont: score(FontEntry(fname='/home/runner/micromamba/envs/trajan/fonts/SourceCodePro-Medium.ttf', index=0, name='Source Code Pro', style='normal', variant='normal', weight=500, stretch='normal', size='scalable')) = 10.145
2026-07-21 14:55:57 runnervm3jd5f matplotlib.font_manager[2874] DEBUG findfont: score(FontEntry(fname='/home/runner/micromamba/envs/trajan/fonts/SourceCodePro-Medium.ttf', index=0, name='Source Code Pro Medium', style='normal', variant='normal', weight=400, stretch='normal', size='scalable')) = 10.05
2026-07-21 14:55:57 runnervm3jd5f matplotlib.font_manager[2874] DEBUG findfont: score(FontEntry(fname='/usr/share/fonts/truetype/lato/Lato-HeavyItalic.ttf', index=0, name='Lato', style='italic', variant='normal', weight=800, stretch='normal', size='scalable')) = 11.43
2026-07-21 14:55:57 runnervm3jd5f matplotlib.font_manager[2874] DEBUG findfont: score(FontEntry(fname='/usr/share/fonts/truetype/lato/Lato-HeavyItalic.ttf', index=0, name='Lato Heavy', style='italic', variant='normal', weight=400, stretch='normal', size='scalable')) = 11.05
2026-07-21 14:55:57 runnervm3jd5f matplotlib.font_manager[2874] DEBUG findfont: score(FontEntry(fname='/usr/share/fonts/truetype/dejavu/DejaVuSans-Oblique.ttf', index=0, name='DejaVu Sans', style='oblique', variant='normal', weight=400, stretch='normal', size='scalable')) = 11.05
2026-07-21 14:55:57 runnervm3jd5f matplotlib.font_manager[2874] DEBUG findfont: score(FontEntry(fname='/home/runner/micromamba/envs/trajan/fonts/Ubuntu-M.ttf', index=0, name='Ubuntu', style='normal', variant='normal', weight=500, stretch='normal', size='scalable')) = 10.145
2026-07-21 14:55:57 runnervm3jd5f matplotlib.font_manager[2874] DEBUG findfont: score(FontEntry(fname='/home/runner/micromamba/envs/trajan/fonts/Ubuntu-M.ttf', index=0, name='Ubuntu Light', style='normal', variant='normal', weight=700, stretch='normal', size='scalable')) = 10.335
2026-07-21 14:55:57 runnervm3jd5f matplotlib.font_manager[2874] DEBUG findfont: score(FontEntry(fname='/usr/share/fonts/truetype/liberation/LiberationMono-BoldItalic.ttf', index=0, name='Liberation Mono', style='italic', variant='normal', weight=700, stretch='normal', size='scalable')) = 11.335
2026-07-21 14:55:57 runnervm3jd5f matplotlib.font_manager[2874] DEBUG findfont: score(FontEntry(fname='/usr/share/fonts/truetype/dejavu/DejaVuSansMono.ttf', index=0, name='DejaVu Sans Mono', style='normal', variant='normal', weight=400, stretch='normal', size='scalable')) = 10.05
2026-07-21 14:55:57 runnervm3jd5f matplotlib.font_manager[2874] DEBUG findfont: score(FontEntry(fname='/usr/share/fonts/truetype/dejavu/DejaVuMathTeXGyre.ttf', index=0, name='DejaVu Math TeX Gyre', style='normal', variant='normal', weight=400, stretch='normal', size='scalable')) = 10.05
2026-07-21 14:55:57 runnervm3jd5f matplotlib.font_manager[2874] DEBUG findfont: score(FontEntry(fname='/usr/share/fonts/truetype/dejavu/DejaVuSansMono-Oblique.ttf', index=0, name='DejaVu Sans Mono', style='oblique', variant='normal', weight=400, stretch='normal', size='scalable')) = 11.05
2026-07-21 14:55:57 runnervm3jd5f matplotlib.font_manager[2874] DEBUG findfont: score(FontEntry(fname='/home/runner/micromamba/envs/trajan/fonts/Ubuntu-L.ttf', index=0, name='Ubuntu', style='normal', variant='normal', weight=300, stretch='normal', size='scalable')) = 10.145
2026-07-21 14:55:57 runnervm3jd5f matplotlib.font_manager[2874] DEBUG findfont: score(FontEntry(fname='/home/runner/micromamba/envs/trajan/fonts/Ubuntu-L.ttf', index=0, name='Ubuntu Light', style='normal', variant='normal', weight=400, stretch='normal', size='scalable')) = 10.05
2026-07-21 14:55:57 runnervm3jd5f matplotlib.font_manager[2874] DEBUG findfont: score(FontEntry(fname='/home/runner/micromamba/envs/trajan/fonts/SourceCodePro-MediumIt.ttf', index=0, name='Source Code Pro', style='italic', variant='normal', weight=500, stretch='normal', size='scalable')) = 11.145
2026-07-21 14:55:57 runnervm3jd5f matplotlib.font_manager[2874] DEBUG findfont: score(FontEntry(fname='/home/runner/micromamba/envs/trajan/fonts/SourceCodePro-MediumIt.ttf', index=0, name='Source Code Pro Medium', style='italic', variant='normal', weight=400, stretch='normal', size='scalable')) = 11.05
2026-07-21 14:55:57 runnervm3jd5f matplotlib.font_manager[2874] DEBUG findfont: score(FontEntry(fname='/home/runner/micromamba/envs/trajan/fonts/SourceCodePro-Regular.ttf', index=0, name='Source Code Pro', style='normal', variant='normal', weight=400, stretch='normal', size='scalable')) = 10.05
2026-07-21 14:55:57 runnervm3jd5f matplotlib.font_manager[2874] DEBUG findfont: score(FontEntry(fname='/home/runner/micromamba/envs/trajan/fonts/SourceCodePro-SemiboldIt.ttf', index=0, name='Source Code Pro', style='italic', variant='normal', weight=600, stretch='normal', size='scalable')) = 11.24
2026-07-21 14:55:57 runnervm3jd5f matplotlib.font_manager[2874] DEBUG findfont: score(FontEntry(fname='/home/runner/micromamba/envs/trajan/fonts/SourceCodePro-SemiboldIt.ttf', index=0, name='Source Code Pro Semibold', style='italic', variant='normal', weight=400, stretch='normal', size='scalable')) = 11.05
2026-07-21 14:55:57 runnervm3jd5f matplotlib.font_manager[2874] DEBUG findfont: score(FontEntry(fname='/usr/share/fonts/truetype/dejavu/DejaVuSerif.ttf', index=0, name='DejaVu Serif', style='normal', variant='normal', weight=400, stretch='normal', size='scalable')) = 10.05
2026-07-21 14:55:57 runnervm3jd5f matplotlib.font_manager[2874] DEBUG findfont: score(FontEntry(fname='/usr/share/fonts/truetype/dejavu/DejaVuSerif-Bold.ttf', index=0, name='DejaVu Serif', style='normal', variant='normal', weight=700, stretch='normal', size='scalable')) = 10.335
2026-07-21 14:55:57 runnervm3jd5f matplotlib.font_manager[2874] DEBUG findfont: score(FontEntry(fname='/usr/share/fonts/truetype/liberation/LiberationSerif-Italic.ttf', index=0, name='Liberation Serif', style='italic', variant='normal', weight=400, stretch='normal', size='scalable')) = 11.05
2026-07-21 14:55:57 runnervm3jd5f matplotlib.font_manager[2874] DEBUG findfont: score(FontEntry(fname='/usr/share/fonts/truetype/dejavu/DejaVuSansMono-BoldOblique.ttf', index=0, name='DejaVu Sans Mono', style='oblique', variant='normal', weight=700, stretch='normal', size='scalable')) = 11.335
2026-07-21 14:55:57 runnervm3jd5f matplotlib.font_manager[2874] DEBUG findfont: score(FontEntry(fname='/home/runner/micromamba/envs/trajan/fonts/SourceCodePro-Light.ttf', index=0, name='Source Code Pro', style='normal', variant='normal', weight=300, stretch='normal', size='scalable')) = 10.145
2026-07-21 14:55:57 runnervm3jd5f matplotlib.font_manager[2874] DEBUG findfont: score(FontEntry(fname='/home/runner/micromamba/envs/trajan/fonts/SourceCodePro-Light.ttf', index=0, name='Source Code Pro Light', style='normal', variant='normal', weight=400, stretch='normal', size='scalable')) = 10.05
2026-07-21 14:55:57 runnervm3jd5f matplotlib.font_manager[2874] DEBUG findfont: score(FontEntry(fname='/usr/share/fonts/truetype/liberation/LiberationMono-Italic.ttf', index=0, name='Liberation Mono', style='italic', variant='normal', weight=400, stretch='normal', size='scalable')) = 11.05
2026-07-21 14:55:57 runnervm3jd5f matplotlib.font_manager[2874] DEBUG findfont: Matching DejaVu Sans Display:style=normal:variant=normal:weight=normal:stretch=normal:size=10.0 to DejaVu Sans Display ('/home/runner/micromamba/envs/trajan/lib/python3.14/site-packages/matplotlib/mpl-data/fonts/ttf/DejaVuSansDisplay.ttf') with score of 0.050000.
# it is also possible to provide an axis on which to plot
# in this case, this will likely be part of a larger figure, and the user will likely want to put the
# labels etc themselves; remember to switch off decoration

# a plot with 3 lines, 2 columns
fig, ax = plt.subplots(3, 2)

ax_out, pclr = xr_data.isel(trajectory=0).processed_elevation_energy_spectrum.wave.plot(
    xr_data.isel(trajectory=0).time_waves_imu.squeeze(),
    # plot on the second line, first column
    ax=ax[1, 0],
    decorate=False,
    )

# the user can make the plot to their liking
ax[1, 0].set_xticks(ax[1, 0].get_xticks(), ax[1, 0].get_xticklabels(), rotation=45, ha='right')
ax[1,0].set_ylim([0.05, 0.25])
ax[1,0].set_ylabel("f [Hz]")

plt.tight_layout()

cbar = plt.colorbar(pclr, ax=ax, orientation='vertical', shrink=0.8)
cbar.set_label('log$_{10}$(S) [m$^2$/Hz]')

plt.show()
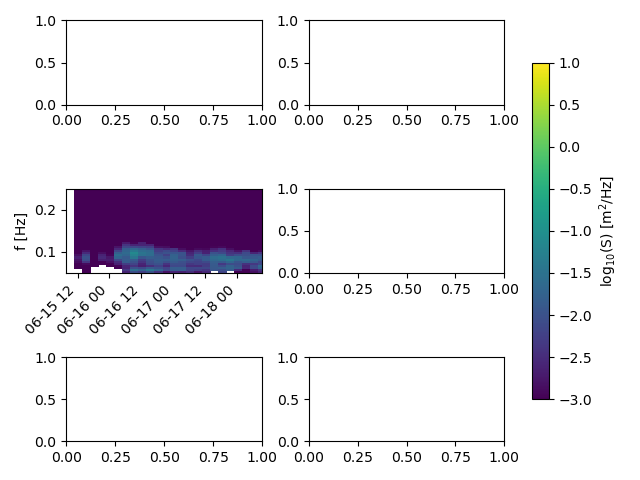
2026-07-21 14:55:57 runnervm3jd5f trajan.waves[2874] DEBUG Setting up new plot object.
2026-07-21 14:55:57 runnervm3jd5f matplotlib.colorbar[2874] DEBUG locator: <matplotlib.ticker.AutoLocator object at 0x7f5586fc20f0>
Total running time of the script: (0 minutes 0.721 seconds)