Note
Go to the end to download the full example code.
Analysing output from Parcels (Zarr format)#
import matplotlib.pyplot as plt
import xarray as xr
import trajan as ta

ds = xr.open_dataset('../tests/test_data/parcels.zarr', engine='zarr')
2025-09-09 15:16:23 runnervmf4ws1 numcodecs[2509] DEBUG Registering codec 'zlib'
2025-09-09 15:16:23 runnervmf4ws1 numcodecs[2509] DEBUG Registering codec 'gzip'
2025-09-09 15:16:23 runnervmf4ws1 numcodecs[2509] DEBUG Registering codec 'bz2'
2025-09-09 15:16:23 runnervmf4ws1 numcodecs[2509] DEBUG Registering codec 'lzma'
2025-09-09 15:16:23 runnervmf4ws1 numcodecs[2509] DEBUG Registering codec 'blosc'
2025-09-09 15:16:23 runnervmf4ws1 numcodecs[2509] DEBUG Registering codec 'zstd'
2025-09-09 15:16:23 runnervmf4ws1 numcodecs[2509] DEBUG Registering codec 'lz4'
2025-09-09 15:16:23 runnervmf4ws1 numcodecs[2509] DEBUG Registering codec 'astype'
2025-09-09 15:16:23 runnervmf4ws1 numcodecs[2509] DEBUG Registering codec 'delta'
2025-09-09 15:16:23 runnervmf4ws1 numcodecs[2509] DEBUG Registering codec 'quantize'
2025-09-09 15:16:23 runnervmf4ws1 numcodecs[2509] DEBUG Registering codec 'fixedscaleoffset'
2025-09-09 15:16:23 runnervmf4ws1 numcodecs[2509] DEBUG Registering codec 'packbits'
2025-09-09 15:16:23 runnervmf4ws1 numcodecs[2509] DEBUG Registering codec 'categorize'
2025-09-09 15:16:23 runnervmf4ws1 numcodecs[2509] DEBUG Registering codec 'pickle'
2025-09-09 15:16:23 runnervmf4ws1 numcodecs[2509] DEBUG Registering codec 'base64'
2025-09-09 15:16:23 runnervmf4ws1 numcodecs[2509] DEBUG Registering codec 'shuffle'
2025-09-09 15:16:23 runnervmf4ws1 numcodecs[2509] DEBUG Registering codec 'bitround'
2025-09-09 15:16:23 runnervmf4ws1 numcodecs[2509] DEBUG Registering codec 'crc32'
2025-09-09 15:16:23 runnervmf4ws1 numcodecs[2509] DEBUG Registering codec 'adler32'
2025-09-09 15:16:23 runnervmf4ws1 numcodecs[2509] DEBUG Registering codec 'jenkins_lookup3'
2025-09-09 15:16:23 runnervmf4ws1 numcodecs[2509] DEBUG Registering codec 'json2'
2025-09-09 15:16:23 runnervmf4ws1 numcodecs[2509] DEBUG Registering codec 'vlen-utf8'
2025-09-09 15:16:23 runnervmf4ws1 numcodecs[2509] DEBUG Registering codec 'vlen-bytes'
2025-09-09 15:16:23 runnervmf4ws1 numcodecs[2509] DEBUG Registering codec 'vlen-array'
2025-09-09 15:16:23 runnervmf4ws1 numcodecs[2509] DEBUG Registering codec 'fletcher32'
2025-09-09 15:16:23 runnervmf4ws1 numcodecs[2509] DEBUG Registering codec 'msgpack2'
2025-09-09 15:16:23 runnervmf4ws1 numcodecs[2509] DEBUG Registering codec 'crc32c'
2025-09-09 15:16:23 runnervmf4ws1 zarr.core.sync[2509] DEBUG Creating Zarr event loop
2025-09-09 15:16:23 runnervmf4ws1 asyncio[2509] DEBUG Using selector: EpollSelector
Print Xarray dataset
print(ds)
<xarray.Dataset> Size: 123kB
Dimensions:     (trajectory: 100, obs: 61)
Coordinates:
  * obs         (obs) int32 244B 0 1 2 3 4 5 6 7 8 ... 53 54 55 56 57 58 59 60
  * trajectory  (trajectory) int64 800B 700 701 702 703 704 ... 796 797 798 799
Data variables:
    lat         (trajectory, obs) float32 24kB ...
    lon         (trajectory, obs) float32 24kB ...
    time        (trajectory, obs) datetime64[ns] 49kB ...
    z           (trajectory, obs) float32 24kB ...
Attributes:
    Conventions:            CF-1.6/CF-1.7
    feature_type:           trajectory
    ncei_template_version:  NCEI_NetCDF_Trajectory_Template_v2.0
    parcels_mesh:           spherical
    parcels_version:        2.4.0
Print trajectory specific information about dataset
print(ds.traj)
2025-09-09 15:16:23 runnervmf4ws1 trajan.accessor[2509] DEBUG Detecting trajectory dimension
2025-09-09 15:16:23 runnervmf4ws1 trajan.accessor[2509] DEBUG No trajectory_id attribute/variable found, trying to identify by name.
2025-09-09 15:16:23 runnervmf4ws1 trajan.accessor[2509] DEBUG Detecting time-variable for "obs"..
2025-09-09 15:16:23 runnervmf4ws1 trajan.accessor[2509] DEBUG Detected obs-dim: obs, detected time-variable: time.
2025-09-09 15:16:23 runnervmf4ws1 trajan.accessor[2509] DEBUG Detected un-structured (2D) trajectory dataset
=======================
TrajAn info:
------------
100 trajectories  [trajectory_dim: trajectory]
61 timesteps      [obs_dim: obs]
Time variable:    time['trajectory', 'obs']   (2D)
Timestep:       4:00:00
Time coverage:  2022-10-12T18:00:00.000000000 - 2022-10-22T18:00:00.000000000
Longitude span: 39.88391876220703 to 40.14458084106445
Latitude span:  17.2540340423584 to 17.726621627807617
Variables:
    lat  [latitude]
    lon  [longitude]
    time  [time]
    z  [depth]
=======================
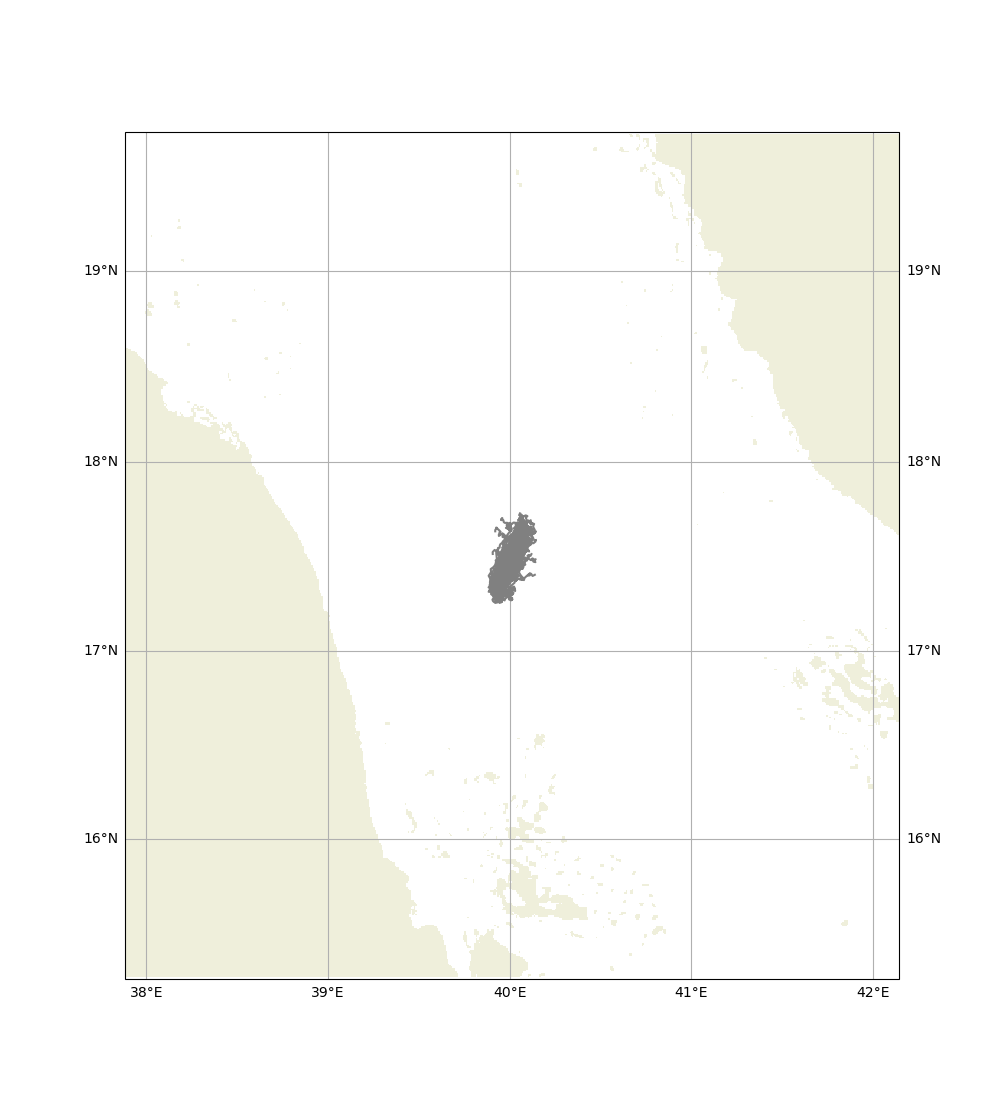
Basic plot
ds.traj.plot(land='mask', margin=1)

# TODO: we must allow no time dimension for the below to work
#ds.mean('trajectory', skipna=True).traj.plot(color='r', label='Mean trajectory')
# In the meantime, we regrid to a regular 1D dataset to allow plotting a mean trajectory
ds = ds.traj.gridtime('4h')
ds.mean('trajectory').traj.plot(color='r', label='Mean trajectory')
plt.legend()
plt.show()

2025-09-09 15:16:23 runnervmf4ws1 trajan.traj[2509] DEBUG Setting up new plot object.
2025-09-09 15:16:23 runnervmf4ws1 trajan.plot[2509] DEBUG Plotting lines
2025-09-09 15:16:23 runnervmf4ws1 trajan.traj[2509] DEBUG No grid-mapping specified, checking if coordinates are lon/lat..
2025-09-09 15:16:23 runnervmf4ws1 trajan.traj[2509] DEBUG No grid-mapping specified, checking if coordinates are lon/lat..
2025-09-09 15:16:23 runnervmf4ws1 trajan.traj[2509] DEBUG No grid-mapping specified, checking if coordinates are lon/lat..
2025-09-09 15:16:23 runnervmf4ws1 trajan.traj[2509] DEBUG No grid-mapping specified, checking if coordinates are lon/lat..
2025-09-09 15:16:23 runnervmf4ws1 trajan.traj[2509] DEBUG No grid-mapping specified, checking if coordinates are lon/lat..
2025-09-09 15:16:23 runnervmf4ws1 trajan.plot[2509] DEBUG Creating new figure and axes..
2025-09-09 15:16:23 runnervmf4ws1 trajan.traj[2509] DEBUG No grid-mapping specified, checking if coordinates are lon/lat..
2025-09-09 15:16:23 runnervmf4ws1 trajan.traj[2509] DEBUG No grid-mapping specified, checking if coordinates are lon/lat..
2025-09-09 15:16:27 runnervmf4ws1 trajan.accessor[2509] DEBUG Detecting trajectory dimension
2025-09-09 15:16:27 runnervmf4ws1 trajan.accessor[2509] DEBUG No trajectory_id attribute/variable found, trying to identify by name.
2025-09-09 15:16:27 runnervmf4ws1 trajan.accessor[2509] DEBUG Creating new trajectory dimension "trajectory"
2025-09-09 15:16:27 runnervmf4ws1 trajan.accessor[2509] DEBUG Detected obs-dim: time, detected time-variable: time.
2025-09-09 15:16:27 runnervmf4ws1 trajan.accessor[2509] DEBUG Detected structured (1D) trajectory dataset
2025-09-09 15:16:27 runnervmf4ws1 trajan.traj[2509] DEBUG Setting up new plot object.
2025-09-09 15:16:27 runnervmf4ws1 trajan.plot[2509] DEBUG Plotting lines
2025-09-09 15:16:27 runnervmf4ws1 trajan.accessor[2509] DEBUG Detecting trajectory dimension
2025-09-09 15:16:27 runnervmf4ws1 trajan.accessor[2509] DEBUG No trajectory_id attribute/variable found, trying to identify by name.
2025-09-09 15:16:27 runnervmf4ws1 trajan.accessor[2509] DEBUG Detected obs-dim: time, detected time-variable: time.
2025-09-09 15:16:27 runnervmf4ws1 trajan.accessor[2509] DEBUG Detected structured (1D) trajectory dataset
2025-09-09 15:16:27 runnervmf4ws1 trajan.traj[2509] DEBUG No grid-mapping specified, checking if coordinates are lon/lat..
2025-09-09 15:16:27 runnervmf4ws1 trajan.traj[2509] DEBUG No grid-mapping specified, checking if coordinates are lon/lat..
2025-09-09 15:16:27 runnervmf4ws1 trajan.traj[2509] DEBUG No grid-mapping specified, checking if coordinates are lon/lat..
2025-09-09 15:16:27 runnervmf4ws1 trajan.traj[2509] DEBUG No grid-mapping specified, checking if coordinates are lon/lat..
2025-09-09 15:16:27 runnervmf4ws1 trajan.traj[2509] DEBUG No grid-mapping specified, checking if coordinates are lon/lat..
2025-09-09 15:16:27 runnervmf4ws1 trajan.plot[2509] DEBUG Axes already exist on existing figure.
2025-09-09 15:16:27 runnervmf4ws1 trajan.traj[2509] DEBUG No grid-mapping specified, checking if coordinates are lon/lat..
2025-09-09 15:16:27 runnervmf4ws1 trajan.traj[2509] DEBUG No grid-mapping specified, checking if coordinates are lon/lat..
Calculating and plotting the concentration of elements, after 6 and 24 hours
grid = ds.traj.make_grid(dx=3000)
ds_conc = ds.traj.concentration(grid)
plt.subplot(1,2,1)
ds_conc.number.isel(time=6).plot(vmin=0, vmax=20)
plt.scatter(ds.isel(time=6).lon, ds.isel(time=6).lat, s=1, color='black')
plt.subplot(1,2,2)
ds_conc.number.isel(time=24).plot(vmin=0, vmax=20)
plt.scatter(ds.isel(time=24).lon, ds.isel(time=24).lat, s=1, color='black')
plt.show()

2025-09-09 15:16:27 runnervmf4ws1 trajan.accessor[2509] DEBUG Detecting trajectory dimension
2025-09-09 15:16:27 runnervmf4ws1 trajan.accessor[2509] DEBUG No trajectory_id attribute/variable found, trying to identify by name.
2025-09-09 15:16:27 runnervmf4ws1 trajan.accessor[2509] DEBUG Detected obs-dim: time, detected time-variable: time.
2025-09-09 15:16:27 runnervmf4ws1 trajan.accessor[2509] DEBUG Detected structured (1D) trajectory dataset
2025-09-09 15:16:27 runnervmf4ws1 trajan.traj[2509] DEBUG No grid-mapping specified, checking if coordinates are lon/lat..
2025-09-09 15:16:28 runnervmf4ws1 matplotlib.colorbar[2509] DEBUG locator: <matplotlib.ticker.AutoLocator object at 0x7f5e1ed8c950>
2025-09-09 15:16:28 runnervmf4ws1 matplotlib.colorbar[2509] DEBUG locator: <matplotlib.ticker.AutoLocator object at 0x7f5e1ed8db50>
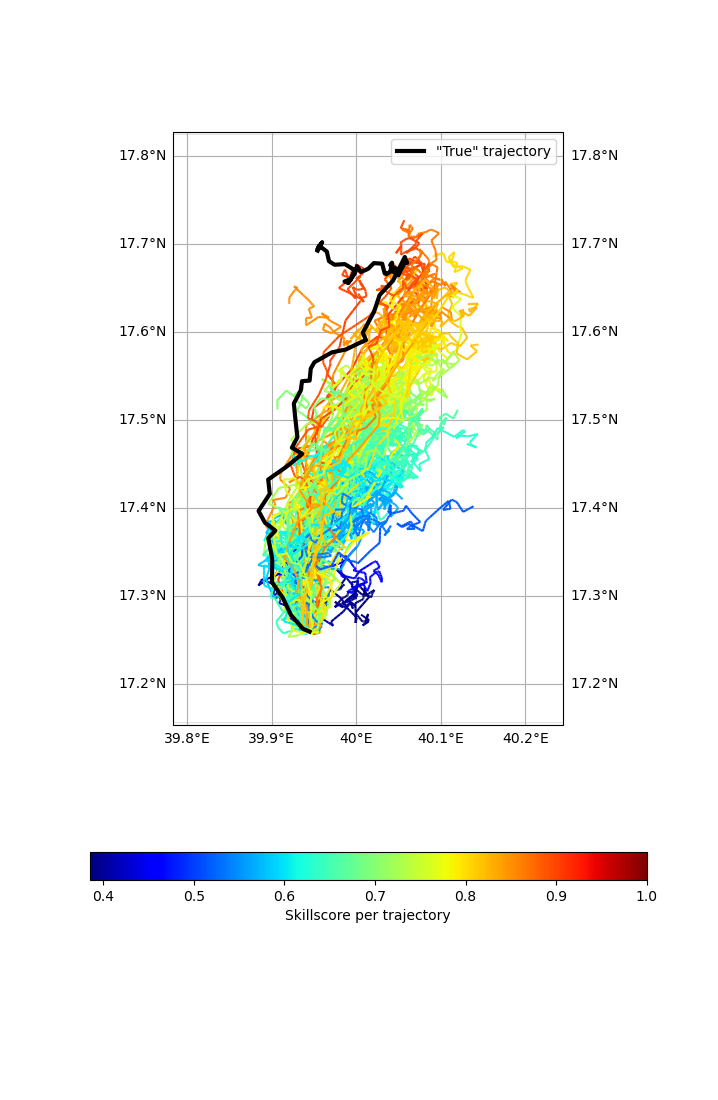
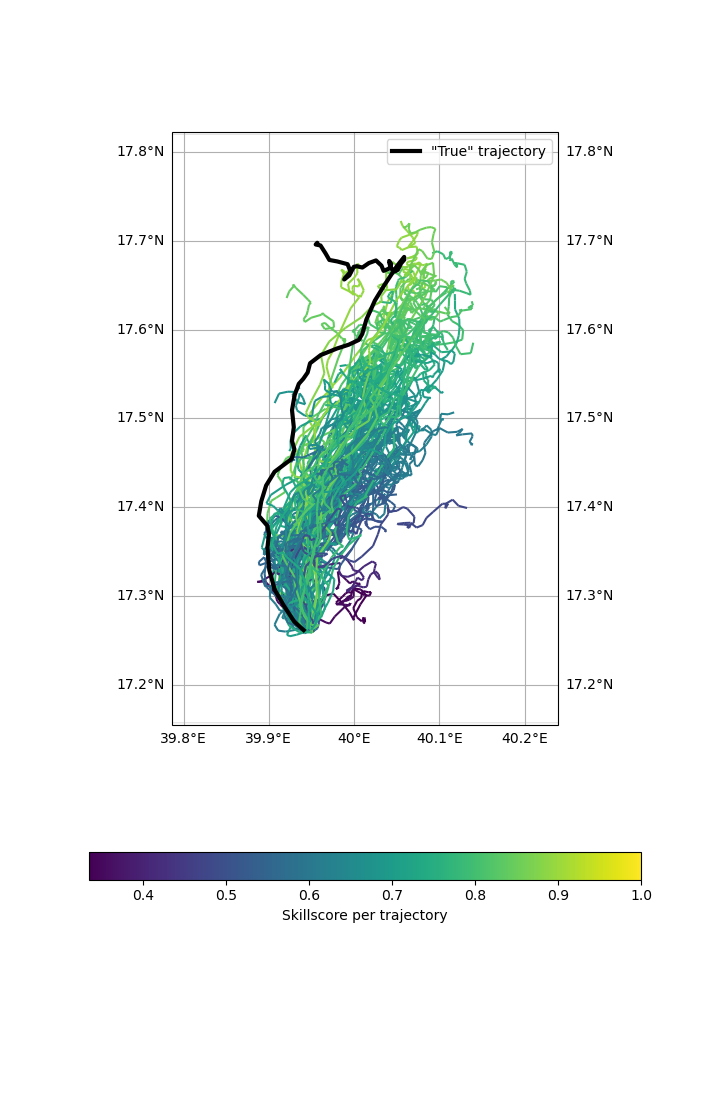
Calculating skillscore Defining the first trajectory to be the “true”
ds_true = ds.isel(trajectory=0)
skillscore = ds.traj.skill(expected=ds_true, method='liu-weissberg', tolerance_threshold=1)
2025-09-09 15:16:28 runnervmf4ws1 trajan.accessor[2509] DEBUG Detecting trajectory dimension
2025-09-09 15:16:28 runnervmf4ws1 trajan.accessor[2509] DEBUG No trajectory_id attribute/variable found, trying to identify by name.
2025-09-09 15:16:28 runnervmf4ws1 trajan.accessor[2509] DEBUG Creating new trajectory dimension "trajectory"
2025-09-09 15:16:28 runnervmf4ws1 trajan.accessor[2509] DEBUG Detected obs-dim: time, detected time-variable: time.
2025-09-09 15:16:28 runnervmf4ws1 trajan.accessor[2509] DEBUG Detected structured (1D) trajectory dataset
2025-09-09 15:16:28 runnervmf4ws1 trajan.accessor[2509] DEBUG Detecting trajectory dimension
2025-09-09 15:16:28 runnervmf4ws1 trajan.accessor[2509] DEBUG No trajectory_id attribute/variable found, trying to identify by name.
2025-09-09 15:16:28 runnervmf4ws1 trajan.accessor[2509] DEBUG Detected obs-dim: time, detected time-variable: time.
2025-09-09 15:16:28 runnervmf4ws1 trajan.accessor[2509] DEBUG Detected structured (1D) trajectory dataset
2025-09-09 15:16:28 runnervmf4ws1 trajan.traj[2509] DEBUG No grid-mapping specified, checking if coordinates are lon/lat..
2025-09-09 15:16:28 runnervmf4ws1 trajan.traj[2509] DEBUG No grid-mapping specified, checking if coordinates are lon/lat..
Plotting trajectories, colored by their skillscore, compared to the “true” trajectory (black)
mappable = ds.traj.plot(land='mask', color=skillscore)
ds_true.traj.plot(color='k', linewidth=3, label='"True" trajectory')
plt.colorbar(mappable=mappable, orientation='horizontal', label='Skillscore per trajectory')
plt.legend()
plt.show()

2025-09-09 15:16:28 runnervmf4ws1 trajan.traj[2509] DEBUG Setting up new plot object.
2025-09-09 15:16:28 runnervmf4ws1 trajan.plot[2509] DEBUG Plotting lines
2025-09-09 15:16:28 runnervmf4ws1 trajan.traj[2509] DEBUG No grid-mapping specified, checking if coordinates are lon/lat..
2025-09-09 15:16:28 runnervmf4ws1 trajan.traj[2509] DEBUG No grid-mapping specified, checking if coordinates are lon/lat..
2025-09-09 15:16:28 runnervmf4ws1 trajan.traj[2509] DEBUG No grid-mapping specified, checking if coordinates are lon/lat..
2025-09-09 15:16:28 runnervmf4ws1 trajan.traj[2509] DEBUG No grid-mapping specified, checking if coordinates are lon/lat..
2025-09-09 15:16:28 runnervmf4ws1 trajan.traj[2509] DEBUG No grid-mapping specified, checking if coordinates are lon/lat..
2025-09-09 15:16:28 runnervmf4ws1 trajan.plot[2509] DEBUG Creating new figure and axes..
2025-09-09 15:16:29 runnervmf4ws1 trajan.traj[2509] DEBUG No grid-mapping specified, checking if coordinates are lon/lat..
2025-09-09 15:16:29 runnervmf4ws1 trajan.traj[2509] DEBUG No grid-mapping specified, checking if coordinates are lon/lat..
2025-09-09 15:16:29 runnervmf4ws1 trajan.plot[2509] DEBUG Plotting trajectory 0 of 100 with color
2025-09-09 15:16:29 runnervmf4ws1 trajan.plot[2509] DEBUG Plotting trajectory 1 of 100 with color
2025-09-09 15:16:29 runnervmf4ws1 trajan.plot[2509] DEBUG Plotting trajectory 2 of 100 with color
2025-09-09 15:16:29 runnervmf4ws1 trajan.plot[2509] DEBUG Plotting trajectory 3 of 100 with color
2025-09-09 15:16:29 runnervmf4ws1 trajan.plot[2509] DEBUG Plotting trajectory 4 of 100 with color
2025-09-09 15:16:29 runnervmf4ws1 trajan.plot[2509] DEBUG Plotting trajectory 5 of 100 with color
2025-09-09 15:16:29 runnervmf4ws1 trajan.plot[2509] DEBUG Plotting trajectory 6 of 100 with color
2025-09-09 15:16:29 runnervmf4ws1 trajan.plot[2509] DEBUG Plotting trajectory 7 of 100 with color
2025-09-09 15:16:29 runnervmf4ws1 trajan.plot[2509] DEBUG Plotting trajectory 8 of 100 with color
2025-09-09 15:16:29 runnervmf4ws1 trajan.plot[2509] DEBUG Plotting trajectory 9 of 100 with color
2025-09-09 15:16:29 runnervmf4ws1 trajan.plot[2509] DEBUG Plotting trajectory 10 of 100 with color
2025-09-09 15:16:29 runnervmf4ws1 trajan.plot[2509] DEBUG Plotting trajectory 11 of 100 with color
2025-09-09 15:16:29 runnervmf4ws1 trajan.plot[2509] DEBUG Plotting trajectory 12 of 100 with color
2025-09-09 15:16:29 runnervmf4ws1 trajan.plot[2509] DEBUG Plotting trajectory 13 of 100 with color
2025-09-09 15:16:29 runnervmf4ws1 trajan.plot[2509] DEBUG Plotting trajectory 14 of 100 with color
2025-09-09 15:16:29 runnervmf4ws1 trajan.plot[2509] DEBUG Plotting trajectory 15 of 100 with color
2025-09-09 15:16:29 runnervmf4ws1 trajan.plot[2509] DEBUG Plotting trajectory 16 of 100 with color
2025-09-09 15:16:29 runnervmf4ws1 trajan.plot[2509] DEBUG Plotting trajectory 17 of 100 with color
2025-09-09 15:16:29 runnervmf4ws1 trajan.plot[2509] DEBUG Plotting trajectory 18 of 100 with color
2025-09-09 15:16:29 runnervmf4ws1 trajan.plot[2509] DEBUG Plotting trajectory 19 of 100 with color
2025-09-09 15:16:29 runnervmf4ws1 trajan.plot[2509] DEBUG Plotting trajectory 20 of 100 with color
2025-09-09 15:16:29 runnervmf4ws1 trajan.plot[2509] DEBUG Plotting trajectory 21 of 100 with color
2025-09-09 15:16:29 runnervmf4ws1 trajan.plot[2509] DEBUG Plotting trajectory 22 of 100 with color
2025-09-09 15:16:29 runnervmf4ws1 trajan.plot[2509] DEBUG Plotting trajectory 23 of 100 with color
2025-09-09 15:16:29 runnervmf4ws1 trajan.plot[2509] DEBUG Plotting trajectory 24 of 100 with color
2025-09-09 15:16:29 runnervmf4ws1 trajan.plot[2509] DEBUG Plotting trajectory 25 of 100 with color
2025-09-09 15:16:29 runnervmf4ws1 trajan.plot[2509] DEBUG Plotting trajectory 26 of 100 with color
2025-09-09 15:16:29 runnervmf4ws1 trajan.plot[2509] DEBUG Plotting trajectory 27 of 100 with color
2025-09-09 15:16:29 runnervmf4ws1 trajan.plot[2509] DEBUG Plotting trajectory 28 of 100 with color
2025-09-09 15:16:29 runnervmf4ws1 trajan.plot[2509] DEBUG Plotting trajectory 29 of 100 with color
2025-09-09 15:16:29 runnervmf4ws1 trajan.plot[2509] DEBUG Plotting trajectory 30 of 100 with color
2025-09-09 15:16:29 runnervmf4ws1 trajan.plot[2509] DEBUG Plotting trajectory 31 of 100 with color
2025-09-09 15:16:29 runnervmf4ws1 trajan.plot[2509] DEBUG Plotting trajectory 32 of 100 with color
2025-09-09 15:16:29 runnervmf4ws1 trajan.plot[2509] DEBUG Plotting trajectory 33 of 100 with color
2025-09-09 15:16:29 runnervmf4ws1 trajan.plot[2509] DEBUG Plotting trajectory 34 of 100 with color
2025-09-09 15:16:29 runnervmf4ws1 trajan.plot[2509] DEBUG Plotting trajectory 35 of 100 with color
2025-09-09 15:16:30 runnervmf4ws1 trajan.plot[2509] DEBUG Plotting trajectory 36 of 100 with color
2025-09-09 15:16:30 runnervmf4ws1 trajan.plot[2509] DEBUG Plotting trajectory 37 of 100 with color
2025-09-09 15:16:30 runnervmf4ws1 trajan.plot[2509] DEBUG Plotting trajectory 38 of 100 with color
2025-09-09 15:16:30 runnervmf4ws1 trajan.plot[2509] DEBUG Plotting trajectory 39 of 100 with color
2025-09-09 15:16:30 runnervmf4ws1 trajan.plot[2509] DEBUG Plotting trajectory 40 of 100 with color
2025-09-09 15:16:30 runnervmf4ws1 trajan.plot[2509] DEBUG Plotting trajectory 41 of 100 with color
2025-09-09 15:16:30 runnervmf4ws1 trajan.plot[2509] DEBUG Plotting trajectory 42 of 100 with color
2025-09-09 15:16:30 runnervmf4ws1 trajan.plot[2509] DEBUG Plotting trajectory 43 of 100 with color
2025-09-09 15:16:30 runnervmf4ws1 trajan.plot[2509] DEBUG Plotting trajectory 44 of 100 with color
2025-09-09 15:16:30 runnervmf4ws1 trajan.plot[2509] DEBUG Plotting trajectory 45 of 100 with color
2025-09-09 15:16:30 runnervmf4ws1 trajan.plot[2509] DEBUG Plotting trajectory 46 of 100 with color
2025-09-09 15:16:30 runnervmf4ws1 trajan.plot[2509] DEBUG Plotting trajectory 47 of 100 with color
2025-09-09 15:16:30 runnervmf4ws1 trajan.plot[2509] DEBUG Plotting trajectory 48 of 100 with color
2025-09-09 15:16:30 runnervmf4ws1 trajan.plot[2509] DEBUG Plotting trajectory 49 of 100 with color
2025-09-09 15:16:30 runnervmf4ws1 trajan.plot[2509] DEBUG Plotting trajectory 50 of 100 with color
2025-09-09 15:16:30 runnervmf4ws1 trajan.plot[2509] DEBUG Plotting trajectory 51 of 100 with color
2025-09-09 15:16:30 runnervmf4ws1 trajan.plot[2509] DEBUG Plotting trajectory 52 of 100 with color
2025-09-09 15:16:30 runnervmf4ws1 trajan.plot[2509] DEBUG Plotting trajectory 53 of 100 with color
2025-09-09 15:16:30 runnervmf4ws1 trajan.plot[2509] DEBUG Plotting trajectory 54 of 100 with color
2025-09-09 15:16:30 runnervmf4ws1 trajan.plot[2509] DEBUG Plotting trajectory 55 of 100 with color
2025-09-09 15:16:30 runnervmf4ws1 trajan.plot[2509] DEBUG Plotting trajectory 56 of 100 with color
2025-09-09 15:16:30 runnervmf4ws1 trajan.plot[2509] DEBUG Plotting trajectory 57 of 100 with color
2025-09-09 15:16:30 runnervmf4ws1 trajan.plot[2509] DEBUG Plotting trajectory 58 of 100 with color
2025-09-09 15:16:30 runnervmf4ws1 trajan.plot[2509] DEBUG Plotting trajectory 59 of 100 with color
2025-09-09 15:16:30 runnervmf4ws1 trajan.plot[2509] DEBUG Plotting trajectory 60 of 100 with color
2025-09-09 15:16:30 runnervmf4ws1 trajan.plot[2509] DEBUG Plotting trajectory 61 of 100 with color
2025-09-09 15:16:30 runnervmf4ws1 trajan.plot[2509] DEBUG Plotting trajectory 62 of 100 with color
2025-09-09 15:16:30 runnervmf4ws1 trajan.plot[2509] DEBUG Plotting trajectory 63 of 100 with color
2025-09-09 15:16:30 runnervmf4ws1 trajan.plot[2509] DEBUG Plotting trajectory 64 of 100 with color
2025-09-09 15:16:30 runnervmf4ws1 trajan.plot[2509] DEBUG Plotting trajectory 65 of 100 with color
2025-09-09 15:16:30 runnervmf4ws1 trajan.plot[2509] DEBUG Plotting trajectory 66 of 100 with color
2025-09-09 15:16:30 runnervmf4ws1 trajan.plot[2509] DEBUG Plotting trajectory 67 of 100 with color
2025-09-09 15:16:30 runnervmf4ws1 trajan.plot[2509] DEBUG Plotting trajectory 68 of 100 with color
2025-09-09 15:16:30 runnervmf4ws1 trajan.plot[2509] DEBUG Plotting trajectory 69 of 100 with color
2025-09-09 15:16:30 runnervmf4ws1 trajan.plot[2509] DEBUG Plotting trajectory 70 of 100 with color
2025-09-09 15:16:30 runnervmf4ws1 trajan.plot[2509] DEBUG Plotting trajectory 71 of 100 with color
2025-09-09 15:16:30 runnervmf4ws1 trajan.plot[2509] DEBUG Plotting trajectory 72 of 100 with color
2025-09-09 15:16:30 runnervmf4ws1 trajan.plot[2509] DEBUG Plotting trajectory 73 of 100 with color
2025-09-09 15:16:30 runnervmf4ws1 trajan.plot[2509] DEBUG Plotting trajectory 74 of 100 with color
2025-09-09 15:16:30 runnervmf4ws1 trajan.plot[2509] DEBUG Plotting trajectory 75 of 100 with color
2025-09-09 15:16:30 runnervmf4ws1 trajan.plot[2509] DEBUG Plotting trajectory 76 of 100 with color
2025-09-09 15:16:30 runnervmf4ws1 trajan.plot[2509] DEBUG Plotting trajectory 77 of 100 with color
2025-09-09 15:16:30 runnervmf4ws1 trajan.plot[2509] DEBUG Plotting trajectory 78 of 100 with color
2025-09-09 15:16:30 runnervmf4ws1 trajan.plot[2509] DEBUG Plotting trajectory 79 of 100 with color
2025-09-09 15:16:30 runnervmf4ws1 trajan.plot[2509] DEBUG Plotting trajectory 80 of 100 with color
2025-09-09 15:16:30 runnervmf4ws1 trajan.plot[2509] DEBUG Plotting trajectory 81 of 100 with color
2025-09-09 15:16:30 runnervmf4ws1 trajan.plot[2509] DEBUG Plotting trajectory 82 of 100 with color
2025-09-09 15:16:30 runnervmf4ws1 trajan.plot[2509] DEBUG Plotting trajectory 83 of 100 with color
2025-09-09 15:16:30 runnervmf4ws1 trajan.plot[2509] DEBUG Plotting trajectory 84 of 100 with color
2025-09-09 15:16:30 runnervmf4ws1 trajan.plot[2509] DEBUG Plotting trajectory 85 of 100 with color
2025-09-09 15:16:30 runnervmf4ws1 trajan.plot[2509] DEBUG Plotting trajectory 86 of 100 with color
2025-09-09 15:16:31 runnervmf4ws1 trajan.plot[2509] DEBUG Plotting trajectory 87 of 100 with color
2025-09-09 15:16:31 runnervmf4ws1 trajan.plot[2509] DEBUG Plotting trajectory 88 of 100 with color
2025-09-09 15:16:31 runnervmf4ws1 trajan.plot[2509] DEBUG Plotting trajectory 89 of 100 with color
2025-09-09 15:16:31 runnervmf4ws1 trajan.plot[2509] DEBUG Plotting trajectory 90 of 100 with color
2025-09-09 15:16:31 runnervmf4ws1 trajan.plot[2509] DEBUG Plotting trajectory 91 of 100 with color
2025-09-09 15:16:31 runnervmf4ws1 trajan.plot[2509] DEBUG Plotting trajectory 92 of 100 with color
2025-09-09 15:16:31 runnervmf4ws1 trajan.plot[2509] DEBUG Plotting trajectory 93 of 100 with color
2025-09-09 15:16:31 runnervmf4ws1 trajan.plot[2509] DEBUG Plotting trajectory 94 of 100 with color
2025-09-09 15:16:31 runnervmf4ws1 trajan.plot[2509] DEBUG Plotting trajectory 95 of 100 with color
2025-09-09 15:16:31 runnervmf4ws1 trajan.plot[2509] DEBUG Plotting trajectory 96 of 100 with color
2025-09-09 15:16:31 runnervmf4ws1 trajan.plot[2509] DEBUG Plotting trajectory 97 of 100 with color
2025-09-09 15:16:31 runnervmf4ws1 trajan.plot[2509] DEBUG Plotting trajectory 98 of 100 with color
2025-09-09 15:16:31 runnervmf4ws1 trajan.plot[2509] DEBUG Plotting trajectory 99 of 100 with color
2025-09-09 15:16:31 runnervmf4ws1 trajan.traj[2509] DEBUG Setting up new plot object.
2025-09-09 15:16:31 runnervmf4ws1 trajan.plot[2509] DEBUG Plotting lines
2025-09-09 15:16:31 runnervmf4ws1 trajan.accessor[2509] DEBUG Detecting trajectory dimension
2025-09-09 15:16:31 runnervmf4ws1 trajan.accessor[2509] DEBUG Detected obs-dim: time, detected time-variable: time.
2025-09-09 15:16:31 runnervmf4ws1 trajan.accessor[2509] DEBUG Detected structured (1D) trajectory dataset
2025-09-09 15:16:31 runnervmf4ws1 trajan.traj[2509] DEBUG No grid-mapping specified, checking if coordinates are lon/lat..
2025-09-09 15:16:31 runnervmf4ws1 trajan.traj[2509] DEBUG No grid-mapping specified, checking if coordinates are lon/lat..
2025-09-09 15:16:31 runnervmf4ws1 trajan.traj[2509] DEBUG No grid-mapping specified, checking if coordinates are lon/lat..
2025-09-09 15:16:31 runnervmf4ws1 trajan.traj[2509] DEBUG No grid-mapping specified, checking if coordinates are lon/lat..
2025-09-09 15:16:31 runnervmf4ws1 trajan.traj[2509] DEBUG No grid-mapping specified, checking if coordinates are lon/lat..
2025-09-09 15:16:31 runnervmf4ws1 trajan.plot[2509] DEBUG Axes already exist on existing figure.
2025-09-09 15:16:31 runnervmf4ws1 trajan.traj[2509] DEBUG No grid-mapping specified, checking if coordinates are lon/lat..
2025-09-09 15:16:31 runnervmf4ws1 trajan.traj[2509] DEBUG No grid-mapping specified, checking if coordinates are lon/lat..
2025-09-09 15:16:31 runnervmf4ws1 matplotlib.colorbar[2509] DEBUG locator: <matplotlib.ticker.AutoLocator object at 0x7f5e1ed8c290>
Total running time of the script: (0 minutes 8.650 seconds)