Note
Go to the end to download the full example code.
Read a position log from a CSV file and convert it to a CF-compatible dataset#
import pandas as pd
import trajan as ta
import matplotlib.pyplot as plt
Use the read_csv function:
ds = ta.read_csv('bug05_pos.csv.xz', lon='Longitude', lat='Latitude', time='Time', name='Device')
print(ds)

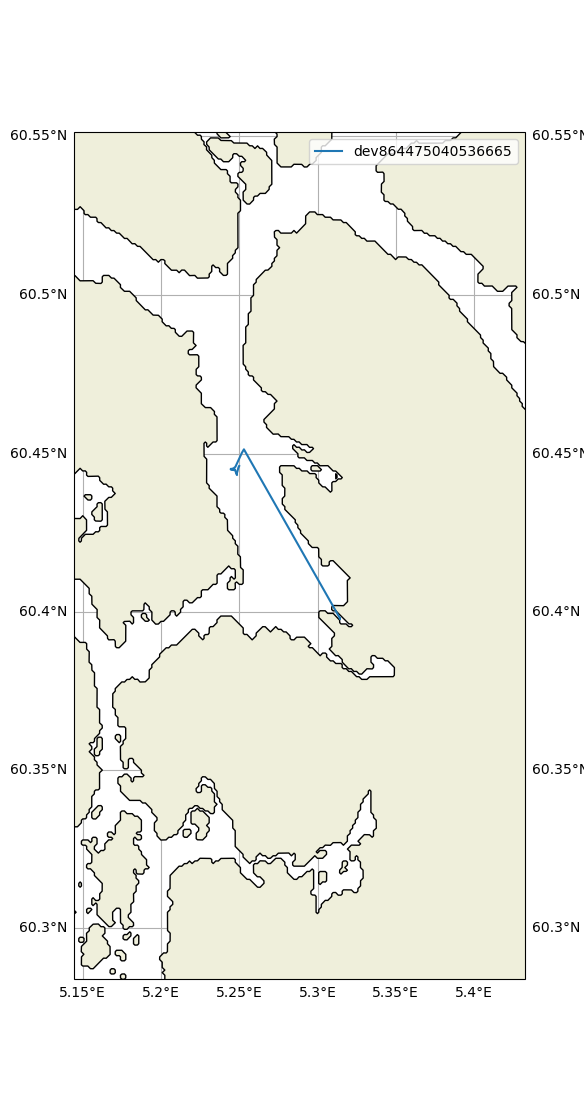
ds.traj.plot(color=None, label=ds.trajectory.values)
plt.legend()
plt.show()

<xarray.Dataset> Size: 27kB
Dimensions:     (trajectory: 1, obs: 844)
Coordinates:
  * trajectory  (trajectory) <U18 72B 'dev864475040536665'
  * obs         (obs) int64 7kB 0 1 2 3 4 5 6 7 ... 837 838 839 840 841 842 843
Data variables:
    time        (trajectory, obs) datetime64[us] 7kB 2022-05-10T12:56:16.5000...
    lon         (trajectory, obs) float64 7kB 5.332 5.332 5.332 ... 5.25 5.25
    lat         (trajectory, obs) float64 7kB 60.38 60.38 60.38 ... 60.45 60.45
Attributes:
    Conventions:          CF-1.10
    featureType:          trajectory
    geospatial_lat_min:   60.38380600000001
    geospatial_lat_max:   60.45141000000001
    geospatial_lon_min:   5.244493666666667
    geospatial_lon_max:   5.33242
    time_coverage_start:  2020-01-01T00:00:07.250000
    time_coverage_end:    2022-05-20T11:03:46.120000
Total running time of the script: (0 minutes 54.005 seconds)